A Dashboard of an Education Data Portal using Big Data
Solutions
R. A. Mahmood
Dep. of Comp. sciences, Faculty of Comp. and Info., Mansoura
University, Egypt
M. Z. Rashad
Dep. of Comp. sciences, Faculty of Comp. and Info., Mansoura
University, Egypt
M. A. El-Dosuky
Dep. of Comp. sciences, Faculty of Comp. and Info., Mansoura
University, Egypt
ABSTRACT
An Educational Data Portal (EDP) play important role in teaching and learning as it contains useful resources. Every big educational institutions such as university shall build an EDP soon or later. The aim of this study is to utilize Big Data solutions in building a Dashboard for an Education Data Portal. The proposed EDP is envisioned to be a core tool for all students and learning agencies, providing support for many types of views and content/instructional resources to allow effective data-driven decision-making for students, teacher and the public, based on recent standards. It supports many features such as accessibility of data and content anywhere, scalability, extensibility of functionality, and extensibility of the technology architecture to support integration with the Shared Learning Infrastructure (SLI).
The Data Dashboard is highly scalable and extensible architecture that will grow, if necessary, to meet the needs of students, and educators
General Terms
Big Data, MapReduce, Hadoop
Keywords
Big Data; MapReduce; Hadoop, Educational Data Portal
1.
INTRODUCTION
An Educational Data Portal (EDP) play important role in teaching and learning as it contains useful resources[1]. Many succesful implemntation of portals are proposed suc as StarBRITE, Vanderbilt University Biomedical Research Integration, Translation and Education portal [2]. Every big educational institutions such as university shall build an EDP soon or later. The aim of this study is to utilize Big Data solutions in building a Dashboard for an Education Data Portal. Section 2 reviews main terms and tools for Big Data solutions. Section 3 is the proposed framework. Section 4 invesitages the proposed framework.
2.
PREVIOUS WORK
It is often assumed that Big Data resources are too large and complex for human comprehension. The analysis of Big Data is best left to software programs. Not so.
When data analysts go straight to the complex calculations, before they perform a simple estimation, they will find themselves accepting wildly ridiculous calculations. [3] Rapid increases in high performance computing sets the stage for so-called “big data” analysis challenges. However, conventional climate analysis techniques are inadequate in dealing with the complexities of today's data. [4]. Big data are of special Volume, Variety, and Velocity([5], [6]). A data warehouse
stores a substantial amount of historical data. Users of this system are able to continuously ask or query it to retrieve data for analysis. [7] A data warehouse is a database containing data from multiple operational systems that has been consolidated, integrated, aggregated, and structured, so that it can be used to support the analysis and decision-making process of a business. [8] The data warehouse model is constructed from two relational data model schemas covering demographics and inventory-accounting. [9]
[image:1.595.318.526.545.723.2]Building a data warehouse requires focusing closely on understanding three main areas: the source area, the destination area, and the mapping area (Extraction– transformation–loading, ETL processes). [10]. MapReduce has become an important distributed processing model for large-scale data-intensive applications like data mining and web indexing. There is a predictive schedule and prefetching (PSP) mechanism, that reduces the execution time, increases the overall throughput and improves the I/O utilization. [11]. MapReduce is a parallel programming model to process large datasets, and it was inspired by the Map and Reduce primitives from functional languages. Its first implementation was designed to run on large clusters of homogeneous machines ([12],[13]) MapReduce’s execution model includes an all-map-to-all-reduce communication, called the shuffle, across the network bisection. [14]. Hadoop–an open-source imple- mentation of MapReduce is widely used for short jobs requiring low response time. [15]. Hadoop Technology Stack is shown in figure 1.
Figure 1. Hadoop Technology Stack [16]
Sq
o
o
p
, flu
m
e,
c
h
u
kw
a
Pig, Hive, HBase, Casasandra,
Lucene,Hama, Crunch, Avro
HDFS,
MapReduce,
YARN
Ambari
, Z
o
o
ke
eper,
Oo
zie
Java virtual Machine
Hive is a batch-oriented, data-warehousing layer built on the core elements of Hadoop (HDFS and MapReduce). It provides users who know SQL with a simple SQL-lite implementation called HiveQL without sacrificing access via mappers and reducers.
As a result, Hive is best used for data mining and deeper analytics that do not require real-time behaviors.[12] Hive uses three mechanisms for data organization : Tables , Partitions and Buckets. [17]. Hive, allows SQL developers to write Hive Query Language (HQL) statements that are similar to standard SQL statements , HQL statements are broken down by the Hive service into MapReduce jobs and executed across a Hadoop cluster. [18]
Pig was initially developed at Yahoo! To allow people using Hadoop to focus more on analyzing large data sets and spend less time having to write mapper and reducer programs. Like actual Pigs, who eat almost anything, the Pig programming language is designed to handle any kind of data. [18]. Pig was designed to make Hadoop more approachable and usable by nondevelopers. [17]
3.
PROPOSED FRAMEWORK
The proposed EDP is envisioned to be a core tool for all students and learning agencies, providing support for many types of views and content/instructional resources to allow effective data-driven decision-making for students, teacher and the public, based on recent standards [19].
To support this vision, the solution architecture must have the following characteristics:
Accessibility of data and content anywhere and anytime by students, public, teachers, and other educators at home, school, and via mobile devices.
Scalability to accommodate students, public, and teachers/principals/other educators.
Extensibility of functionality in the system environment.
Extensibility of the technology architecture to support integration with the Shared Learning Infrastructure (SLI).
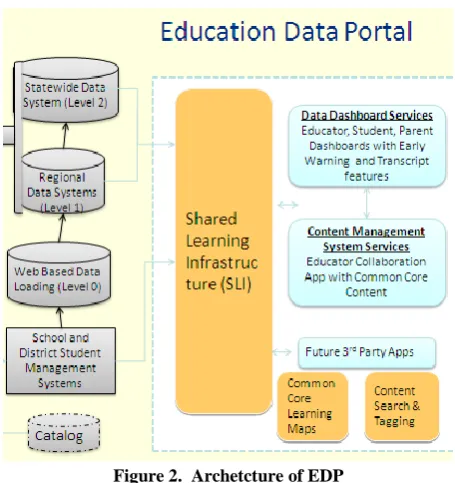
[image:2.595.314.542.68.310.2]The following diagram provides a graphical view of the proposed architecture for EDP.
Figure 2. Archetcture of EDP
The Data Dashboard is highly scalable and extensible architecture that will grow, if necessary, to meet the needs of students, and educators. It also supports:
Clustering/acceleration—offers a framework to cluster application components for load balancing.
Caching—offers a framework to cluster application components to share runtime data, as well as data caching mechanism for increased performance.
Event logging—it has a centralized logging framework to enables tracking user operations done via the exposed user interfaces.
Security —as it supports a secure (SSL) login . Notificatios—it has a powerful event publish with
many channels of notification.
4.
IMPLEMNTATION
[image:2.595.321.536.568.737.2]To access or modify one's data, student is asked to enter credentials, as shown in fugure 4.
[image:3.595.87.245.97.312.2]Figure 4. loging to the web site
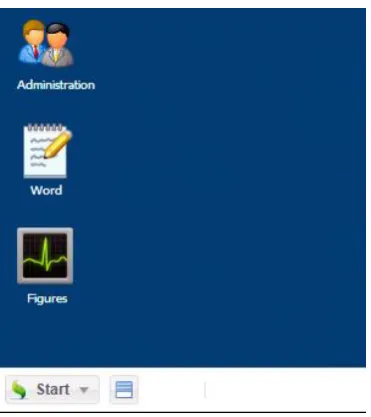
[image:3.595.75.261.332.541.2]Figure 5. XP desktop for each student
Figure 6. Administration
Figure 7. XP look and feel
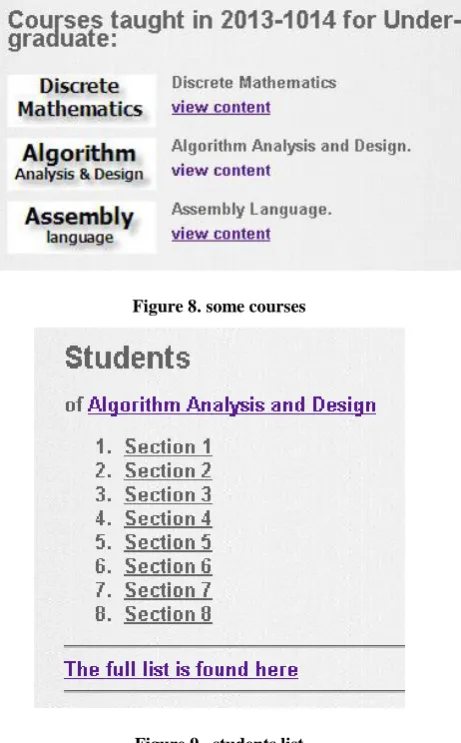
[image:3.595.329.528.380.603.2]Figure 8. some courses
Figure 9. students list
5.
CONCLUSION AND FUTURE WORK
The proposed EDP is envisioned to be a core tool for all students and learning agencies, providing support for many types of views and content/instructional resources to allow effective data-driven decision-making for students, teacher and the public, based on recent standards. It supports:
Accessibility of data and content anywhere and anytime by students, public, teachers, and other educators at home, school, and via mobile devices.
Scalability to accommodate students, public, and teachers/principals/other educators.
Extensibility of functionality in the system environment.
Extensibility of the technology architecture to support integration with the Shared Learning Infrastructure (SLI).
The Data Dashboard is highly scalable and extensible
6.
REFERENCES
[1] Rosnaini Mahmud, Mohd Arif Hj Ismail, Fadzilah Abdul Rahman, Nurzatulshima Kamarudin, Aisyatul Radhiah Ruslan, Teachers’ Readiness in Utilizing Educational Portal Resources in Teaching and Learning, Procedia - Social and Behavioral Sciences, Volume 64, 9 November 2012, Pages 484-491
[2] Paul A. Harris, Jonathan A. Swafford, Terri L. Edwards, Minhua Zhang, Shraddha S. Nigavekar, Tonya R. Yarbrough, Lynda D. Lane, Tara Helmer, Laurie A. Lebo, Gail Mayo, Daniel R. Masys, Gordon R. Bernard, Jill M. Pulley, StarBRITE: The Vanderbilt University Biomedical Research Integration, Translation and Education portal, Journal of Biomedical Informatics, Volume 44, Issue 4, August 2011, Pages 655-662
[3] Jules J. Berman, Chapter 8 - Simple but Powerful Big Data Techniques, Principles of Big Data, Morgan Kaufmann, Boston, 2013, Pages 99-127, Principles of
Big Data, ISBN 9780124045767,
http://dx.doi.org/10.1016/B978-0-12-404576-7.00008-3.
[4] S. Fiore, A. D’Anca, C. Palazzo, I. Foster, D.N. Williams, G. Aloisio, Ophidia: Toward Big Data Analytics for eScience, Procedia Computer Science, Volume 18, 2013, Pages 2376-2385, ISSN 1877-0509, http://dx.doi.org/10.1016/j.procs.2013.05.409.
[5] Zachary Dixon, Joe Moxley, Everything is illuminated: What big data can tell us about teacher commentary, Assessing Writing, Volume 18, Issue 4, October 2013,
Pages 241-256, ISSN 1075-2935,
http://dx.doi.org/10.1016/j.asw.2013.08.002.
(http://www.sciencedirect.com/science/article/pii/S10752 93513000330)
[6] http://blogs.sas.com/content/sascom/2012/04/12/turning-big-data-volume-variety-and-velocity-into-value/
[7] Paul Westerman, Chapter 1 - What is Data Warehousing?, The Morgan Kaufmann Series in Data Management Systems, Morgan Kaufmann, San Francisco, 2001, Pages 1-30, Data Warehousing, ISBN 9781558606845, http://dx.doi.org/10.1016/B978-155860684-5/50001-6.
(http://www.sciencedirect.com/science/article/pii/B9781 558606845500016)
[8] Dimitri Theodoratos, Timos Sellis, Designing data warehouses, Data & Knowledge Engineering, Volume 31, Issue 3, November 1999, Pages 279-301, ISSN 0169-023X, http://dx.doi.org/10.1016/S0169-023X(99)00029-4.
(http://www.sciencedirect.com/science/article/pii/S01690 23X99000294)
1319-1578,
http://dx.doi.org/10.1016/j.jksuci.2011.05.005.
(http://www.sciencedirect.com/science/article/pii/S13191 5781100019X)
[11]Jiong Xie, FanJun Meng, HaiLong Wang, HongFang Pan, JinHong Cheng, Xiao Qin, Research on Scheduling Scheme for Hadoop Clusters, Procedia Computer Science, Volume 18, 2013, Pages 2468-2471, ISSN 1877-0509,
http://dx.doi.org/10.1016/j.procs.2013.05.423.
(http://www.sciencedirect.com/science/article/pii/S18770 50913005668)
[12]Wagner Kolberg, Pedro de B. Marcos, Julio C.S. Anjos, Alexandre K.S. Miyazaki, Claudio R. Geyer, Luciana B. Arantes, MRSG – A MapReduce simulator over SimGrid, Parallel Computing, Volume 39, Issues 4–5, April–May 2013, Pages 233-244, ISSN 0167-8191, http://dx.doi.org/10.1016/j.parco.2013.02.001.
(http://www.sciencedirect.com/science/article/pii/S01678 19113000215)
[13]Minghong Lin, Li Zhang, Adam Wierman, Jian Tan, Joint optimization of overlapping phases in MapReduce, Performance Evaluation, Volume 70, Issue 10, October 2013, Pages 720-735, ISSN 0166-5316, http://dx.doi.org/10.1016/j.peva.2013.08.013.
(http://www.sciencedirect.com/science/article/pii/S01665 31613000916)
[14]Faraz Ahmad, Seyong Lee, Mithuna Thottethodi, T.N. Vijaykumar, MapReduce with communication overlap (MaRCO), Journal of Parallel and Distributed Computing, Volume 73, Issue 5, May 2013, Pages
608-620, ISSN 0743-7315,
http://dx.doi.org/10.1016/j.jpdc.2012.12.012.
(http://www.sciencedirect.com/science/article/pii/S07437 31512002936)
[15]Jiong Xie, Yun Tian, Shu Yin, Ji Zhang, Xiaojun Ruan, Xiao Qin, Adaptive Preshuffling in Hadoop Clusters, Procedia Computer Science, Volume 18, 2013, Pages
2458-467, ISSN 1877-0509,
http://dx.doi.org/10.1016/j.procs.2013.05.422.
(http://www.sciencedirect.com/science/article/pii/S18770 50913005656)
[16] http://www.cbtnuggets.com/it-training-videos/course/cbtn_hadoop/10621
[17]Judith Hurwitz, Alan Nugent, Dr. Fern Halper, and Marcia Kaufman , “ Big Data For Dummies “ , Wiley and sons Inc, 2013
[18]Paul C. Zikopoulos , Chris Eaton , Dirk deRoos , Thomas Deutsch , George Lapis, “ Understanding Big Data “, IBM, 2011
[19]http://usny.nysed.gov/rttt/rfp/ds-07/
[20]M. A. El-Dosuky, Ahmed EL-Bassiouny, Taher Hamza, Magdy Rashad, ,"Food Recommendation Using Ontology and Heuristics", A. Ell Hassanien et al. (Eds.): AMLTA 2012, CCIS 322, pp. 423–429, 2012. © Springer-Verlag Berlin Heidelberg 2012.
![Figure 1. Hadoop Technology Stack [16]](https://thumb-us.123doks.com/thumbv2/123dok_us/8050863.773889/1.595.318.526.545.723/figure-hadoop-technology-stack.webp)