A Comparative Performance Survey on Microarray Data
Analysis Techniques for Colon Cancer Classification
Kshipra Chitode
Research StudentGovernment College of Engineering Aurangabad, India
Meghana Nagori
Asst. Professor, CSE Dept. Government College of EngineeringAurangabad, India
ABSTRACT
The genetic information of any human beings is very helpful in cancer diagnosis. DNA microarray technology has enabled us to handle thousands of genes simultaneously. cDNA and Affymetrix microarray are the microarray technologies. The microarray data analysis can be done in supervised or unsupervised learning methods. Hierarchical clustering, k-means algorithms are widely used for clustering. As Curse of dimensionality is main challenge for microarray, Feature selection techniques are used. The classification accuracy depends on the feature selection technique used. In proposed work, feature selection techniques implemented are Signal-to-Noise ratio, Information Gain and Fishers criteria. SVM and KNN classifiers are built. The comparative results of performance accuracies are generated. The SVM classifier outperforms with fishers criteria and KNN outperforms with SNR.
General Terms
Cancer Classification
Keywords
Microarray, cancer, genes, feature selection, classification
1.
INTRODUCTION
Microarray is a powerful technique that allows monitoring the expression of tens of thousands of different genes in a small sample simultaneously [1]. This technique makes use of surfaces like glass slides, silicon chips on which sequences from thousands of different genes from a sample are covalently attached to a fixed location (probes) [2].
The microarray technologies currently available are cDNA microarray and affymetrix array. cDNA microarrays are small glass slides(or nylon membranes) on which double stranded DNA is spotted. Usually each spot on chip represents a gene. In cDNA microarray two samples a reference (a normal tissue) verses test sample (a malignant tissue) are used. This pair of two cDNA samples is independently copied from corresponding mRNA populations with reverse transcriptase enzyme. Distinct fluorescent molecules Cyanine5 (cy5) red and Cyanine3 (cy3) green are used for labeling. These two labeled cDNA samples are then pooled and hybridized to the array. The relative expression level of a particular gene is determined by measuring the densities at both fluorescence wavelengths and then calculating the ratios of fluorescence intensities (cy5/cy3) [2].
Affymetrix array is another technology also known as oligonucleotide array places thousands of gene-specific oligonucleotides (called probes) synthesized directly on silicon chip using a photolithographic technology. This synthesis uses in situ (on chip) light directed chemistry to
build up many thousands of oligonucleotide probes (each probe 25 bp long). Each gene has 15-20 pair of probes synthesized on the chip. Each pair of probes has two oligonucleotides perfect match (PM) and mismatch (MM). PM (reference sequence) is perfectly complementary to a specific region of gene or EST(Expression sequence tag) and MM (one base change) is identical to perfect match probes except for a single middle base pair mismatch [3][4].
The affymetrix scanner generates a TIFF (Tagged Image File Format) image of scanned array and store in DAT file. Image analysis is performed on DAT file and CEL file is generated which stores the probe level expression data (probe intensities). CDF (Chip Description File) describes which probe goes in which probe set. The computation of gene expression values for requires both CEL and CDF file. This computational process requires three steps background correction, normalization and summarization. Microarray Analysis Suite5.0 (MAS 5), Robust Multichip analysis (RMA), Model Based Expression Index (MBEI), GCRMA are the algorithms used for analysis of microarray. From studies it is concluded that RMA is superior to MAS in terms of sensitivity and specificity (i.e. true and false detection rate) [5].
Machine (SVM) [1] [6], K- Nearest Neighbors (KNN) [1], Naïve Bayes, Neural Network, and Decision Tree (DT). In this work, for first stage of classification authors have used three feature selection techniques, Signal-to-Noise Ratio (SNR), Information Gain (IG) and Fisher Criteria for extracting important predictive genes. In second stage of classification 2 powerful classifiers Support Vector Machine (SVM) and K Nearest Neighbor (KNN) are built. 4 publically available gene expression datasets are used.
This manuscript is organized as follows: Section 2 summarizes the related work. The proposed system is described in section 3. In Section 4 the experimental results and analysis are reported. Section 5 is summary and conclusion.
2.
RELATED WORK
The process of classification and clustering are generally considered to be similar, the only difference is classification is a supervised learning process (i.e. it is known that which training tuple belongs to which class) and clustering is unsupervised learning process (i.e. class label of training tuple is not known).
2.1
Clustering
Cluster analysis on gene expression values allows grouping of all genes or samples identical to each other based on some
criteria. Cluster is collection of objects similar to each other and dissimilar objects belongs to another cluster. These clustered known genes can be used for prediction of function of unknown genes. Hierarchical clustering, K-means, Self-organizing Map (SOM) are the clustering algorithms [4].
2.1.1
Hierarchical Clustering
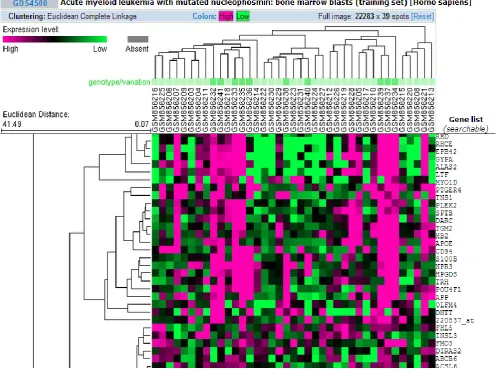
[image:2.595.55.555.367.743.2]There are two approaches of hierarchical clustering: Top-down approach (divisive clustering) and Bottom-up approach (agglomerative clustering). Gene expression data is clustered using agglomerative approach. In this approach initially each gene expression profile is assigned to a single cluster. The distance between every couple of cluster is measured using any distance measure i.e. Euclidean, Manhattan or correlation distance measure. The two closest clusters are merged, each time the distance matrix is updated to take this cluster merging into account. The widely used methods for calculation of inter cluster distance are: single linkage (minimum distance), complete linkage (maximum distance), average linkage (average distance), centroid linkage (distance between cluster centroids). This is an iterative process until one cluster is left. This gives a tree structure where height of the branches is proportionate to distance between the clusters [4].
Figure1. shows the hierarchical clustering applied on the Acute Myloid Lukemia (AML) dataset of 39 samples having 22283 gene expression values available on NCBI GEO public data repository GDS 4500. NCBI GEO allows clustering on microarray dataset using K-means, Hierarchical clustering algorithm using average, complete and single linkage method and Euclidean, Pearson Correlation and Uncentered Correlation distance measures. K-means allows clustering for values of k ranging between 2 to 15. The column indicates clustering among samples and row indicates clustering among gene expression values [8]. There are many application software available which allows various operations to be performed on microarray dataset. Bioconductor is one of the most famous open source application software available.
2.1.2
K-Means Clustering
In K-Means clustering each gene expression value belongs to exactly one predefined clusters K. This is an iterative process; center of cluster is computed iteratively followed by assignment of gene expression value to the cluster with the closest cluster center.
2.1.3
Self-organizing Map
In SOMs there is a predefined geometry of nodes, two dimensional grid one node for each cluster. The gene expression value is mapped to the node which is closest to it.
2.2
Feature Selection
Feature selections techniques are used to identify smaller subset of most relevant features which can be used for accurate classification. The feature relevance score of each feature is calculated, and features having low score are removed. The top ranked genes are used to build the classifier. The feature selection techniques are given below.
2.2.1
Signal-to-Noise (SNR) Ratio
In the SNR method, consider a dataset S consisting of m expression vectors, where m is the number of patient samples and n is the number of genes measured. For each gene , we calculate the mean and standard deviation .It is the ratio of difference of mean of the two classes to the summation of standard deviations of two classes.
µi and µj denote the average expression value of i th
gene over all samples in normal and tumor case respectively. σi and σj
denote standard deviation of ith gene over all samples in normal and tumor case respectively.
2.2.2
Information Gain (IG)
Information Gain is computed using entropy value. Entropy of Y is
p(y) is the marginal probability density function for random variable Y. Conditional entropy of Y after observing X is
p(y|x) is conditional probability of y given x [9][10]. The information gained about Y after observing X is
Information gain is symmetrical measure,
2.2.3
Fisher’s Criteria
In Fisher’s Criteria the gene ranking is done using following equation
m1 and m2 denote the mean expression value of gth gene across
all samples in tumor and normal case respectively. s1 and s2
denote standard deviation of gth gene across all samples in tumor and normal case respectively [11].
2.3
Classification
2.3.1
Support Vector Machine (SVM)
Support Vector Machine (SVM) is a kind of supervised learning methods for classification. SVM is a popular and powerful classification technique. The main objective of SVM is to construct optimal hyperplane where two classes are linearly separable or a set of hyperplanes in a high dimensional feature space. An optimal hyperplane is one having maximum margin of separation between different classes. The data points closest to the hyperplane are considered as support vectors. Consider ɤ is the width of the margin, then all the data points on or within this margin will form the subset of support vectors. The data points located at distance more than ɤ/2 from the separating hyperplane are ignored. The support vectors play a greater role in classifying the test samples. The complexity and accuracy of SVM classifier is based on number of support vectors rather than the dimensionality of the dataset. The two parameters in hyperplane equation are w and b. The separating hyperplane equation is written as
where w is a weight vector and b is a scalar often referred as a bias.
Given training set of instance-label pairs (xi, yi), i=1, …, n,
where xi are training sample with yi class label and n is the
number of samples in training set. The linear SVM classifier requires solving the following optimization problem
subject to
where C is the SVM sensitivity parameter, and ɛ is a slack variable. The dual formation of above optimization problem is
subject to
where αi is Lagrange multiplier, obtained by training SVM
2.3.2
K-Nearest Neighbor
KNN is a lazy learning algorithm where k nearest neighbors’ are used for classification. There is no explicit training phase on the training dataset. For classification of the test sample all the training data is used. At the time of classification, it computes the distance between test data and training data elements using distance measures. Euclidean distance, Manhattan distance, Cosine distance, or Correlation distance are the distance matrix. It finds the k closest training points of test sample to classify test sample. The class labels of these k closet points are used to find class of test sample.
The proper functioning of KNN depends on selection of parameter k i.e. number of nearest neighbors chosen to assign class label to test data and distance matrix used. Euclidean distance measure is most widely used in KNN [1] [13] [14]. Consider two vectors xi and xj such that xi= (xi1, xi2,….., xin)
and xj =(xj1,xj2,…...,xjn). The Euclidean distance between xi
and xj is given by
and the Manhattan distance is given by
3.
PROPOSED METHOD
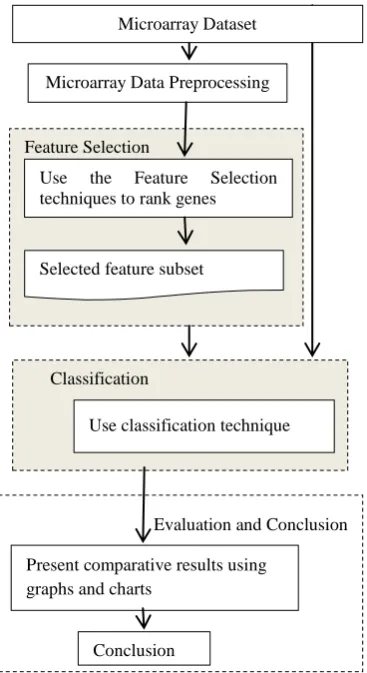
[image:4.595.78.262.403.740.2]In this paper the authors have comparatively studying and analyzed three feature selection and two classifications
Fig 2: Proposed microarray data analysis system
techniques for microarray data analysis for accurate classification of cancer.
The workflow of the proposed microarray data analysis system for cancer classification is shown in Figure 1. The feature selection techniques used are: Signal to Noise Ratio (SNR), Information Gain (IG) and Fishers Criteria. Support Vector Machine (SVM) and K-Nearest Neighbor (KNN) classifiers are built. The features extracted are used to build classifier.
Many online repositories are there which make the biomedical data set available which include microarray gene expression value, protein informative data, and genomic sequence data. The proposed method is using the dataset made available on Kent Ridge Bio-medical Data Set Repository.
The Colon cancer dataset is used. The dataset contains expression of 2000 genes across 62 samples collected from Colon Tumor patients. Among these samples, 40 are tumor biopsies (labeled as “positive”) from tumors and 22 are normal biopsies (labeled as “negative”) from healthy parts of the colons of the same patient.
There are four possible outcomes for a given classifier and an instance. (1) True positive (TP) if the positive instance is classified as positive, (2) False negative (FN) if positive instance is classified as negative (3) True negative (TN) if the negative instance classified as negative (4) False positive (FP) if negative instance is classified as positive [10]. The accuracy of a classifier is the fraction of the correctly classified samples to all samples.
4.
RESULTS AND DISCUSSION
In this work, a two class dataset (normal, tumor), the colon cancer dataset is used. The dataset gives different percentage of accuracies for different feature selection and classification techniques. Table 1 to Table 6. shows classification accuracies of SVM and KNN classifier with Signal- to Noise ratio (SNR), Information Gain(IG) and Fisher Criteria (FC) feature selection techniques when top 5,25.50,100,150,200 genes are selected.
Table 1. Accuracies (%) with 5 top ranked genes selected
Classifier SNR IG Fisher Criteria
SVM 85.48 98.38 98.38
KNN 88.7 64.51 93.54
Table 2. Accuracies (%) with 25 top ranked genes selected
Classifier SNR IG Fisher Criteria
SVM 83.87 79.03 95.16
KNN 99.9 83.87 99.9
Table 3. Accuracies (%) with 50 top ranked genes selected
Classifier SNR IG Fisher Criteria
SVM 79.03 87.09 87.07
KNN 99.9 87.09 87.07
Feature Selection
Use the Feature Selection techniques to rank genes
Microarray Data Preprocessing
Selected feature subset
Classification
Use classification technique
Evaluation and Conclusion
Present comparative results using graphs and charts
Conclusion
Table 4. Accuracies(%) with 100 top ranked genes selected
Classifier SNR IG Fisher Criteria
SVM 80.64 88.8 93.54
KNN 99.9 93.54 99.9
Table 5. Accuracies(%) with 150 top ranked genes selected
Classifier SNR IG Fisher Criteria
SVM 75.8 96.71 91.93
KNN 99.9 99.9 99.9
Table 6. Accuracies(%) with 200 top ranked genes selected
Classifier SNR IG Fisher Criteria
SVM 75.8 53.22 91.93
KNN 99.9 93.54 99.9
The performance of SVM classifier is good with Fishers Criteria. Fisher’s Criteria gives most relevant feature subset for classification than SNR and IG. The good performance of SVM does not depend on the dimensionality of the dataset but on the support vectors selected for classification. Because of support vector the SVM turns out to be the best performance classifier.
The performance of KNN classifier is good with Signal-to-Noise ratio (SNR) than IG and FC.
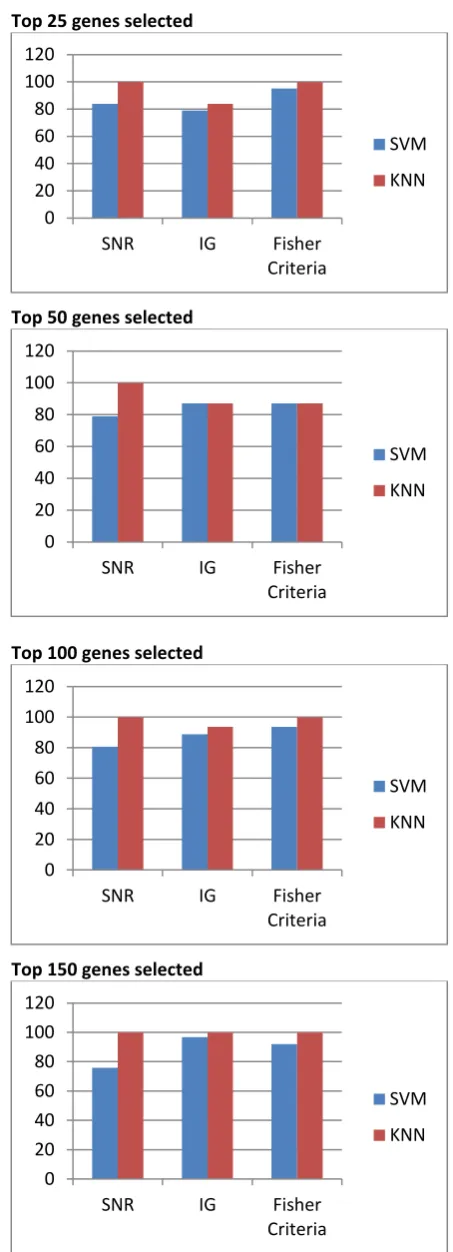
Figure 2. shows the performance results of the classification experiment using three feature selection techniques, SNR, IG and FC and considering top 5,25,50,100,150,200 ranked genes (refer Table 1 to Table 6.)
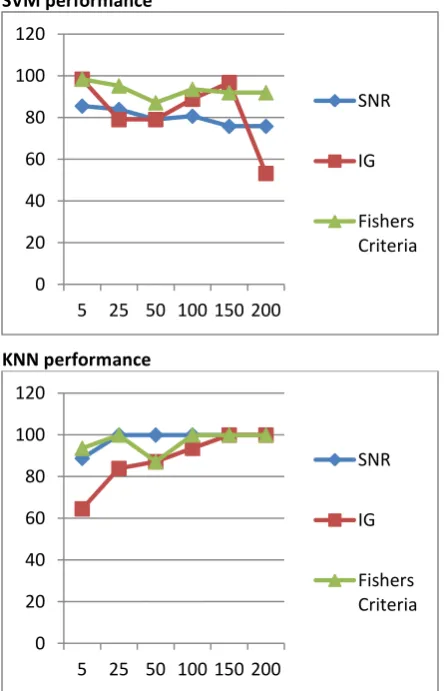
Figure 3. shows the performance results of the classification experiment considering top 5,25.50,100,150,200 ranked genes for classification. Results show that SVM gives 98.38 % of accuracy when implemented using Fishers criteria with top 5 ranked genes. KNN classifier gives 99.9 % of accuracy when implemented using Signal-to-Noise ratio (SNR) with top 25 features selected.
Top 5 genes selected
Top 25 genes selected
Top 50 genes selected
Top 100 genes selected
Top 150 genes selected
0 20 40 60 80 100 120
SNR IG Fisher
Criteria
SVM
KNN
0 20 40 60 80 100 120
SNR IG Fisher
Criteria
SVM
KNN
0 20 40 60 80 100 120
SNR IG Fisher
Criteria
SVM
KNN
0 20 40 60 80 100 120
SNR IG Fisher
Criteria
SVM
KNN
0 20 40 60 80 100 120
SNR IG Fisher
Criteria
SVM
[image:5.595.53.277.539.691.2]Top 200 genes selected
Fig 2: Performance result of classification with gene selection using SNR, IG and FC with different number of top ranked feature selection (genes)
SVM performance
KNN performance
Fig 3: Performance result of classification with gene selection using SNR, IG and FC with top 100 genes
5.
CONCLUSION
Microarray data can be analyzed by unsupervised learning (clustering) or supervised learning (classification). Hierarchical clustering is most widely used clustering algorithm for gene expression values.
The accuracy of classifier depends on the feature selection method used for finding the most relevant and informative features. The classifier is built using these extracted features. A good feature selection technique is one which extracts the
most relevant features for classification. The accuracy of classifier varies depending upon the number of top ranked features selected for classification. SVM best performs with Fishers Criteria using 5 features selected and KNN gives better performance with SNR feature selection technique using 25 feature selected.
6.
ACKNOWLEDGMENTS
The authors wish to express a deep sense of gratitude to Prof. V. P. Kshirsagar HOD of Computer Science and Engineering Department for his motivation and constant support during this work. The authors are also thankful to the Principal, Government College of Engineering, Aurangabad for being a constant source of inspiration.
7.
REFERENCES
[1] Alireza Osareh and Bita Shadgar “Microarray Data Analysis for Cancer classification” IEEE Antalya, Turkey 2009, pp.125-132.
[2] Jun S. Liu Department of Statistics Harvard University “Bioinformatics: Microarrays Analyses and Beyond”. [3] Ahmed Fadiel, Frederick Naftolin “Microarray
applications and challenges: a vast array of possibilities”
Int Arch Biosci 2003-02-02, pp. 1111-1121.
[4] Yves Moreau, Frank De Smet, Gert Thijs, Kathleen Marchal, and Bart De Moor, “Functional Bioinformatics of Microarray Data: From Expression to Regulation” Proceedings of the IEEE, Vol. 90, No. 11, November 2002.
[5] Bettina Harr and Christian Schlotterer“Comparison of algorithms for the analysis of Affymetrix microarray data as evaluated by co-expression of genes in known operons” Nucleic Acids Research, 2006, Vol. 34, No. 2. [6] Shang Gao, Omar Addam and colleagues, “Robust
Integrated Framework for Effective Feature Selection and Sample Classification and Its Application to Gene Expression Data Analysis” IEEE 2012 pp. 112-119. [7] Yvan Saeys, Inaki Inza and Pedro Larranaga “A review
of feature selection techniques in bioinformatics” 2005 pp 1–10.
[8] Tanya Barrett and colleagues “NCBI GEO: mining tens of millions of expression profiles—database and tools update”Nucleic Acids Research, 2007, Vol. 35, Database issue, pp. D760-D765.
[9] Jasmina Novaković, Perica Strbac, Dusan Bulatovic, “Toward optimal feature selection using ranking methods and classification algorithms” Yugoslav Journal of Operations Research 21 (2011), Number 1, 119-135. [10] Sri Harsha Vege “Ensemble of Feature Selection
Techniques for High Dimensional Data” Western Kentucky University 2012.
[11] Azadeh Mohammadi, Mohammad H Saraee, Mansoor Salehi, “Identification of disease-causing genes using microarray data mining and Gene Ontology” Mohammadi et al. BMC Medical Genomics 2011. [12] “Data Mining: Concepts and Techniques”, second
edition by Jaiwei Han and Micheline Kamber Chapter 6. [13] Seyyid Ahmed Medjahed , Tamazouzt Ait Saadi,
Abdelkader Benyettou, “Breast Cancer Diagnosis by using k-Nearest Neighbor with Different Distances and 0
20 40 60 80 100 120
SNR IG Fisher
Criteria
SVM
KNN
0 20 40 60 80 100 120
5 25 50 100 150 200
SNR
IG
Fishers Criteria
0 20 40 60 80 100 120
5 25 50 100 150 200
SNR
IG
[image:6.595.54.276.75.228.2] [image:6.595.53.277.281.627.2]Classification Rules”, International Journal of Computer Applications (0975 - 8887)Volume 62 - No. 1, January 2013.
[14]Sampath Deegalla, Henrik Bostrom, “Classification of Microarrays with kNN: Comparison of Dimensionality Reduction Methods” H. Yin et al. (Eds.): IDEAL 2007, LNCS 4881, pp. 800–809, 2007.
8.
AUTHOR’S BIOGRAPHY
Meghana Nagori has been working as an Assistant
Professor in Computer Science and Engineering department since last 10 years. Currently author is carrying out research work in the area of developing
models and methods for efficient detection and classification of Brain tumor.
Kshipra Chitode received her B.E. degree in Computer