http://dx.doi.org/10.4236/jcc.2015.310002
Apply AHP for Resource Allocation Problem
in Cloud
Avtar Singh, Kamlesh Dutta
Department Computer Science Engineering, National Institute of Technology, Hamirpur, India Email: [email protected], [email protected]
Received 31 August 2015; accepted 20 October 2015; published 23 October 2015
Copyright © 2015 by authors and Scientific Research Publishing Inc.
This work is licensed under the Creative Commons Attribution International License (CC BY). http://creativecommons.org/licenses/by/4.0/
Abstract
Cloud computing is an emerging paradigm with many applications that are integrated with IT or-ganization having the freedom to migrate services between different physical servers. Analytic Hierarchy Process (AHP) with a pairwise comparison matrix technique for applications has been used for serving resources. AHP is a mathematical technique for multi-criteria decision-making used in cloud computing. The growth in cloud computing for resource allocation is sudden and raises complex issues with quality of services for selecting applications. Finally, based on the se-lected criteria, applications are ranked using the pairwise comparison matrix of AHP to determine the most effective scheme. The presented AHP technique represents a well-balanced multi criteria priorities synthesis of various applications effect factors that must be taken into consideration when making complex decisions of this nature. Keeping in view wide range of applications of cloud computing an attempt has been made to develop multiple criteria decision making model.
Keywords
Cloud Computing, Analytic Hierarchy Process, Consistency Ratio (CR), Consistency Index (CI)
1. Introduction
Dy-namic resource allocation is also a challenge in cloud computing. A complex mathematical decision model as-sociated with the selection of cloud computing services in a multi-source scenario is presented [7]. PaaS by eva-luating ranking framework solutions according to the needs is required and also proposed a set of benchmarking algorithms that can help determine the suitable PaaS provider based on different resources and applications re-quirement [8]. When many users make requests for cloud resources at the same time, then how these requested and other resources will be allocated to users to get resources. This is a challenging task in cloud computing. Consider the following (hypothetical) example: an application that needs to define technical specifications for its cloud applications with various criteria that are important to them. When several applications are offered by dif-ferent vendors, the selection of particular application becomes a key issue [9]. It involves analysis of selection parameters and attributes of applications. As multiple criteria are involved in decision making, it is a multi- criteria decision-making (MCDM) problem. Being a problem involving multi-criteria and different application, it can’t be solved with mere assessment. The assessment may work fine, only when the selected parameters and attributes of applications are few. During the selection process, generally the characteristics are ranked or priori-tized. The prioritization includes deciding the weights of parameters. While considering the weights of parame-ters, it is quite likely that the user’s assessment may be based towards the key factors only. This may lead to im-proper priority and incorrect weights being assigned to the parameters. To make an appropriate decision, it is necessary to have a quantifiable value rather than subjective opinions. To deal with this problem we have pro-posed analytical hierarchy process which is widely accepted by the experts. AHP brings an ability to judge the consistency in the analysis process and helps to reduce deviations. Continuation of this paper includes AHP se-lection parameters based on literature study, methodology adopted and application of AHP to the problem fol-lowed by a conclusion.
2. AHP Methodology
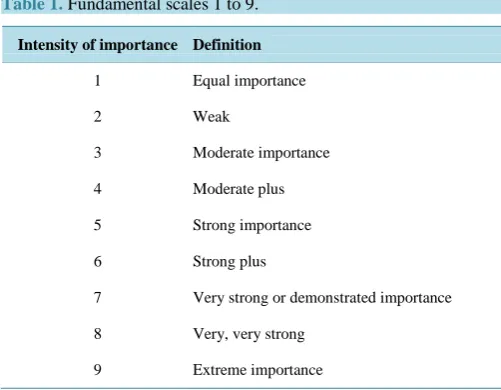
AHP is a mathematical technique used for multi-criteria decision-making. This is better than other multi-criteria techniques. It's designed to incorporate tangible as well as non-tangible factors, especially where the subjective judgments of different individuals constitute an important part of decision making [10] [11]. The pros of AHP over other multi criteria, methods are its flexibility, intuitive call to the decision makers and its ability to check inconsistencies. Normally, users find the pairwise comparison form of data input straightforward and convenient. The following (Table 1) shows the values and their description used for the comparison of relevant values of the elements of a typical AHP model.
[image:2.595.186.437.526.721.2]This technique proposed on weight priorities and ranking mechanism of task based on correctness of consis-tency ratio is proved mathematically and multi criteria evaluation hierarchy [12]. A suggested framework for ranking of cloud computing services [13]. The drawbacks of AHP in its invariable weight system and improved ranking approach [14]. This scenario is proposed where you need to prioritize two requirements having different weight at different time and the limitations of AHP in a practical environment [15]. SaaS products are made
Table 1. Fundamental scales 1 to 9.
Intensity of importance Definition
1 Equal importance
2 Weak
3 Moderate importance
4 Moderate plus
5 Strong importance
6 Strong plus
7 Very strong or demonstrated importance
8 Very, very strong
available in a cloud computing environment that uses AHP to prioritize product characteristic based on an expert scoring system [16]. The following method for calculating inconsistency [11]. The cons of the AHP technique are the limitation scale that uses 9-point. Sometimes, the decision maker might find difficult to differentiate among them and express for example, whether one alternative is 7 or 8 times more important than another. Giv-en k tasks, e.g. attributes or alternatives, author supposed the decision makers are able to compare any two of them.
2.1. Consistency
Saaty TL has proposed a consistency index CI which is related to the Eigen value method.
max
1 n
n n
CI =
λ
−− (1)
where n = dimension of the matrix, 𝜆𝜆max = maximum Eigen value.
The consistency ratio, the ratio of CI and RI, is given by:
CR = CI/RI (2)
where RI is the random index (the average CI of 500 randomly filled matrices).
If CR is less than 10%, then the matrix can be considered as having an acceptable consistency [10] [17] [18]
calculated the random indices shown in (Table 2) which gives the average inconsistency. Mathematically, in-consistency is not, but a rescaling of the largest eigenvalue. Since 𝜆𝜆max≥ n and CIn is always non-negative. The
inconsistency index in its own has no meaning, unless we compare it with some benchmark to determine the magnitude of the deviation from consistency. However, the revision process stops at the requirement that con-sistency ratio CR≤ 0.1, which may not obtain a superior CR. Decision theory helps the decision maker in se-lecting the best course of action from the available courses of action. The decision model is classified such that the type of information which is given about the state occurrence of the various state nature as well as depending upon the decision environment. There are four different states of decision environments: certainty, uncertainty, risk and conflict. AHP uses a five-step process to solve decision problems are as follows:
I. Create a decision hierarchy by breaking down the problem into a hierarchy of decision elements. II. Collect input by a pairwise comparison of decision elements.
III. Determine whether the input data satisfies a consistency test. If it does not, go back to Step II and redo the pairwise comparisons.
IV. Calculate the relative weights of the decision elements.
V. Aggregate the relative weights to obtain scores and hence rankings for the decision alternatives.
The first two steps are related to the popularity of AHP, which are decision maker involved in the model that does not require advanced knowledge of either mathematics or decision analysis to perform [19]. The rest of the three steps are computed and can be performed manually or by using software. AHP has a reference architec- ture with self-contained tightly integrated design with reliable, flexible and automated. Cloud computing pro-vides numerous types of users with different services. In the cloud computing, the following four parameters of QoS need to be considered as input for our case but not restricted to this because there are other parameters too
[20].
2.2. The Completion Time
The correctness of QoS comprises start time, the latest completion time, total completion time, finish time and so on. We select the total completion time (the time interval that a task is submitted to the completion) as the assessment index. TF represents the execution time of task Ti, it can be depicted as (3).
TF = Twait + Texec + Ttrans (3)
Table 2. Random indices (RI).
n 3 4 5 6 7 8 9 10 11 12 13 14 15
Twait represents the waiting times, Texec stands for the task execution time, Ttrans means the task transmission
time. For customers of real time necessity, it expects the tasks should be completed in as little time as possible.
2.3. Bandwidth
Bandwidth needs for adjustment to the application of regular communication, which customers demand higher communication bandwidth. For multimedia traffic demand, it needs to study bandwidth first. Usually, bandwidth depends on the bandwidth value of ISP that provides cloud computing services. Simultaneously, it is related to the customer's local host configuration. Commonly, in the cloud computing services, bandwidth is a fixed quan-titative value. It can be depicted as (4).
ISP
BW=BW ×α (4)
BW represents the actual bandwidth value, BWISP means the service bandwidth that ISP provided, α is the line
factor that access to the services. For example, the same service provides customer’s bandwidth is not same for all the services such as LAN and ADSL, because the quality of the lines.
2.4. Reliability
Customers with lengthy tasks, cloud computing must deliver a stable and reliable performance, such as cloud storage service. Customers with lengthy tasks, may fail because resource lost its strength. Selecting high bility of the resources in cloud computing can improve the quality of its services significantly. Generally, relia-bility of network can be measured by MTBF (Mean Time Between Failures) and MTTR (Mean Time To Repair). They can be depicted as (5) and (6).
MTBF = 1/λ (5)
𝜆𝜆 stands for the average fault cycle
rate r epair
MTTR=R ×R ×β (6)
Rrate denotes the fault response speed, R repair means the fault repair speed, β is the failure treatment factor.
2.5. Cost
Cloud computing pays a fee as essential. The usage charges are an element that customers are concerned about. Customers who want the low cost service will set the cost as a measurable standard of the cloud computing. We can depict the costs of the virtual machines as (7):
1 / 2 / 3 / 4
VM CPU num mem MB storage GB BW Mbps
Cost =C × +P C × +P C × +P C ×P (7)
Pirepresents the amount of resources, C is the resource costs of units.
2.6. Problem Modeling
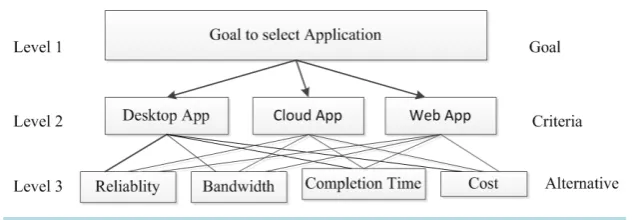
Unpredicted growth in cloud computing for resource allocation raises complex issues with quality of services for selecting applications to minimum cost, migration by balancing work where and when needed. Three criteria were considered while designing the components. They are Desktop app (DA), Cloud app (CA) and Web app (WA). CA is an application program that function in the cloud with some characteristics of pure web app. DA occupies totally on a single device at the user’s location. WA is stored totally on remote server and is delivered over the internet through browser interface. The structures of these components (reliability, bandwidth, cost, completion time etc) are given in the (Figure 1) AHP is selected as the method of decision process. The priori-ties will be derived from a sequence of size: pairwise comparisons involving all the components. The compari-sons will start by comparing the alternatives with respect to their strengths to meet each of the criteria. The next step will be to compare the criteria with their importance to the goal. Since we have three alternatives and need to compare with each other, we will make three pairwise comparisons with respect to each criterion: DA vs.CA, CA vs. WA, and WA vs. DA.
Figure 1.Hierarchy of selection process.
2.7. Formation of Hierarchy
In the real world, decision-making problems are filled with uncertainty. The decision hierarchy formulated by breaking down the problem into a hierarchy of decision components. Systematic step to find the requirement for selective application. The application can be Desktop app (DA), cloud app (CA) and Web app (WA). In offline the desktop app and cloud app will respond faster. While in online cloud app and web app need not permanently engaged on the local device. Cloud app is user control of storage. The user has a reasonably fast Internet con-nection, a good code cloud app extends all the interactivity of a desktop app by with the portability of a Web app.
2.8. Collection of Inputs
AHP is used as a tool for systematically analysis the subjective judgments of several experts belonging to the various fields in this step. To avoid bias that can be presented on judgments are considered from single expert user needs more expert consulting. Hence, for selection three different states an expert for decision making. The nominal ratio scale of 1 to 9 is adopted for pairwise comparison [11].
2.9. Consistency Tests
The results of pair wise comparisons are filled in positive reciprocal matrices to calculate the eigenvector and eigen value. The consistency of the judgments is determined by a measure called consistency ratio (CR). The consistency ratio is obtained to filter out the inconsistent judgments, when the value of the consistency index (CI) < 0.1. All the judgments are found to be consistent and accepted for analysis.
2.10. Calculation of Relative Weights & Ranking of Alternatives
The geometric mean method has been the most widely applied methods in AHP for aggregation of individual preferences when more than one expert is involved in the decision-making. All the expert opinions are consis-tent, but entirely different from other. Geometric mean of individual opinions is calculated and entered in the fi-nal judgmental matrix for finding out the ranks of the alternatives.
3. Result and Analysis
The framework uses an AHP technique for prioritization For using AHP
{
Create total of all attribute such as reliability, bandwidth, completion time and cost with consistency }
Calculate the weight by GM
the reliability of the other alternative. The comparisons are summarized below in (Table 3).
The next level is to weight matrix, by using the method AHP method. The AHP method had pros to support group decision making through accord by calculating the geometric mean of the individual pairwise compari-sons depicts inTable 4. Criteria having negative impact, uses reciprocal value.
The consistency ratio (CR) for the pairwise comparisons was calculated to be 0.0332.
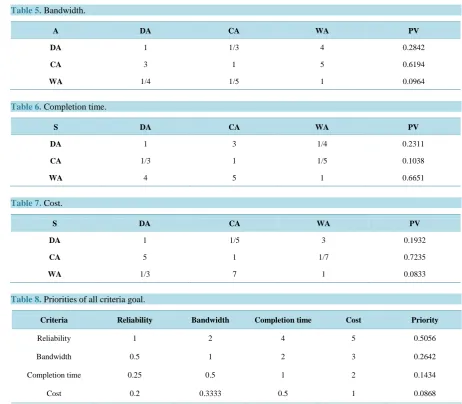
This matrix can be processed mathematically, the AHP derives priorities for the alternatives with respect to reliability. Priorities are sized by their relative strengths, derived from the judgment of the judgment makers as entered into the matrix. These can also be calculated by hand, or with a spreadsheet, or by using specialized AHP software. The same procedure can be used to calculate the weight to the matrices for Bandwidth, Comple-tion time and Cost by the judgment maker for comparisons as shown in (Tables 5-7).
DA 3 CA 1 CA Bandwidth is moderately preferred to that of DA. Weight: 3
DA 1 WA 4 DA Bandwidth is moderately preferred to that of WA. Weight: 4
CA 1 WA 5 CA Bandwidth is strongly preferred to that of WA. Weight: 5
The consistency ratio (CR) for the pairwise comparisons was calculated to be 0.0739.
DA 3 CA 1 CA Completion time is moderately preferred to that of DA. Weight: 3
DA 1 WA 4 DA Completion time is moderately preferred to that of WA. Weight: 4
CA 1 WA 5 CA Completion time is strongly preferred to that of WA. Weight: 5
The consistency ratio (CR) for the pairwise comparisons was calculated to be 0.074.
DA 1 CA 5 DA cost is moderately preferred to that of CA. Weight: 5
DA 3 WA 1 DA cost is moderately preferred to that of WA. Weight: 3
CA 7 WA 1 CA cost is strongly preferred to that of WA. Weight: 7
The consistency ratio (CR) for the pairwise comparisons was calculated to be 0.0559.
3.1. Criteria versus the Goal
As the judgement makers have evaluated the alternatives to their strength in satisfying the criteria, they will now evaluate the criteria with their importance to reach goal. In this case, the judgment makers have agreed on the following relative weights for the various pairs of Criteria are depicted in (Table 8).
The consistency ratio (CR) for the pairwise comparisons was calculated to be 0.0078.
Table 3. Reliability comparison.
DA 3 CA 1 CA reliability is moderately preferred to that of DA. Weight: 3
DA 1 WA 4 DA reliability is moderately preferred to that of WA. Weight: 4
CA 1 WA 5 CA reliability is strongly preferred to that of WA. Weight: 5
Table 4. Reliability.
R DA CA WA PV
DA 1 1/3 3 0.2605
CA 3 1 5 0.6333
Table 5. Bandwidth.
A DA CA WA PV
DA 1 1/3 4 0.2842
CA 3 1 5 0.6194
WA 1/4 1/5 1 0.0964
Table 6. Completion time.
S DA CA WA PV
DA 1 3 1/4 0.2311
CA 1/3 1 1/5 0.1038
WA 4 5 1 0.6651
Table 7. Cost.
S DA CA WA PV
DA 1 1/5 3 0.1932
CA 5 1 1/7 0.7235
WA 1/3 7 1 0.0833
Table 8. Priorities of all criteria goal.
Criteria Reliability Bandwidth Completion time Cost Priority
Reliability 1 2 4 5 0.5056
Bandwidth 0.5 1 2 3 0.2642
Completion time 0.25 0.5 1 2 0.1434
Cost 0.2 0.3333 0.5 1 0.0868
From this decision, Reliability, the highest ranked Criterion to Goal, is about twice as important to the goal as the second highest ranked Criterion, Bandwidth. Similarly, Bandwidth is about twice as important as Cost, which in turn is about twice as important as Completion time as depicts in (Table 9).
Pairwise comparison of four components requires six separate comparisons, while for three components re-quire three. The above refers pairwise comparisons of the four components rere-quire a larger matrix. This method has a cons in a cloud computing environment as the number of pairwise comparisons to be made, may become very large
(
n n(
−1 2)
)
, and thus become a long task.3.2. Final Multi Criteria Priorities Synthesis (MPS)
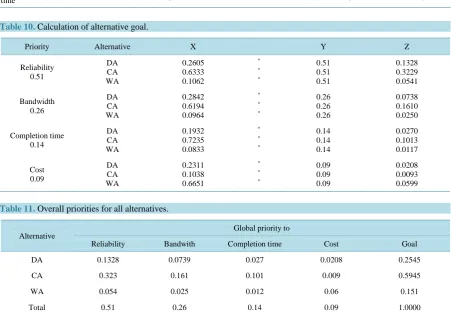
As we have known the priorities of Criteria to Goal, and the priorities of Alternatives Criteria, we can conve-niently calculate the priorities of Alternatives Goal as depicts in (Table 10).
Column X depicts priorities of alternatives Criteria. Column Y depict priority criteria to goal. Column Z de-pict product of two, which is global priority of each alternative to goal. Overall priorities for all alternatives.
Table 9. Criteria to goal.
Reliability 2 Bandwidth 1 Reliability is somewhat moderately more important than Bandwidth. Weight: 2.
Reliability 4 Completion time 1 Reliability is somewhat strongly more important than Completion time. Weight: 4.
Reliability 5 Completion time 1 Reliability is strongly more important than Completion time. Weight: 5.
Bandwidth 2 Cost 1 Bandwidth is somewhat moderately more important than Cost. Weight: 2.
Bandwidth 3 Cost 1 Bandwidth is moderately more important than Cost. Weight: 3
Completion
time 1 Cost 2 Completion time is therefore, somewhat moderately more important than Cost. Weight: 2.
Table 10. Calculation of alternative goal.
Priority Alternative X Y Z
[image:8.595.87.539.202.515.2]Reliability 0.51 DA CA WA 0.2605 0.6333 0.1062 * * * 0.51 0.51 0.51 0.1328 0.3229 0.0541 Bandwidth 0.26 DA CA WA 0.2842 0.6194 0.0964 * * * 0.26 0.26 0.26 0.0738 0.1610 0.0250 Completion time 0.14 DA CA WA 0.1932 0.7235 0.0833 * * * 0.14 0.14 0.14 0.0270 0.1013 0.0117 Cost 0.09 DA CA WA 0.2311 0.1038 0.6651 * * * 0.09 0.09 0.09 0.0208 0.0093 0.0599
Table 11. Overall priorities for all alternatives.
Alternative
Global priority to
Reliability Bandwith Completion time Cost Goal
DA 0.1328 0.0739 0.027 0.0208 0.2545
CA 0.323 0.161 0.101 0.009 0.5945
WA 0.054 0.025 0.012 0.06 0.151
Total 0.51 0.26 0.14 0.09 1.0000
4. Conclusion
This paper discusses the result to identify an achievable automation application, and the content should break down to task level. We have added attributes such as the reliability, bandwidth, completion time and cost level analysis during the application prioritization but still other attributes are not included. This analysis can help to re-prioritize for new attributes that are not considered. The proposed framework for the AHP approach will serve as a useful tool for judgment makers to value the range of performance issues that need to be considered when making complex decisions concerning applications. Moreover, the AHP hierarchical structure in this paper presents the well-balanced multi criteria priorities synthesis of various applications factors that must be judged by users for more competition. The AHP is an excellent approach for evaluation intangible concerns. Above case study depicts that CA is better in terms of reliability, completion time and cost with respect to WA which is better for scalability. In future these applications will play a vital role in terms of above mention agile resources at data centers.
References
[2] Hayes, B. (2008) Cloud Computing. Communications of the ACM, 51, 9-11. http://dx.doi.org/10.1145/1364782.1364786
[3] Buyya, R., Yeo, C.S., Srikumar, V., James, B. and Ivona, B. (2009) Cloud Computing and Emerging IT Platforms: Vi-sion, Hype, and Reality for Delivering Computing as the 5th Utility. Future Generation Computer Systems, 25, 599- 616. http://dx.doi.org/10.1016/j.future.2008.12.001
[4] Buyya, R., Broberg, J. and Goscinski, A. (2011) Cloud Computing: Principle and Paradigm. John Wiley& Sons, Ho-boken.
[5] Armbrust, M., Fox, A., Griffith, R., Joseph, A., Katz, R., Konwinski, A. and Zaharia, M. (2009) Above the Clouds: A Berkeley View of Cloud Computing. Technical Report, University of California at Berkeley.
[6] Chieu, T.C., Mohindra, A., Alexei, A., Karve, A.A. and Segal, A.A. (2009) Dynamic Scaling of Web Applications in a Virtualized Cloud Computing Environment. Proceedings of the IEEE International Conference on e-Business Engi-neering, Macau, 21-23 October 2009, 281-286. http://dx.doi.org/10.1109/icebe.2009.45
[7] Martens, B. and Teuteberg, F. (2012) Decision-Making in Cloud Computing Environments: A Cost and Risk Based Approach. Information Systems Frontiers, 14, 871-893. http://dx.doi.org/10.1007/s10796-011-9317-x
[8] Atas, G. and Gungor, V.C. (2014) Performance Evaluation of Cloud Computing Platforms Using Statistical Methods. Computers and Electrical Engineering, 40, 1636-1649. http://dx.doi.org/10.1016/j.compeleceng.2014.03.017
[9] Triantaphyllou, E. and Mann, S.H. (1995) Using the Analytic Hierarchy Process for Decision Making in Engineering Applications: Some Challenges. International Journal of Industrial Engineering: Applications and Practice, 2, 35-44.
[10] Saaty, T.L. (1990) How to Make a Decision: The Analytic Hierarchy Process. European Journal of Operational Re-search, 48, 9-26. http://dx.doi.org/10.1016/0377-2217(90)90057-I
[11] Saaty, T.L. (2003) Decision-Making with the AHP: Why Is the Principal Eigenvector Necessary. European Journal of Operational Research, 145, 85-89. http://dx.doi.org/10.1016/S0377-2217(02)00227-8
[12] Ergu, D., Kou, G., Peng, Y., Shi, Y. and Shi, Y. (2011) The Analytic Hierarchy Process: Task Scheduling and Re-source Allocation in Cloud Computing Environment. The Journal of Supercomputing, 213, 246-259.
[13] Garg, S.K., Versteeg, S. and Buyya, R. (2013) A Framework for Ranking of Cloud Computing Services. Future Gen-eration Computer Systems, 29, 1012-1023. http://dx.doi.org/10.1016/j.future.2012.06.006
[14] Cao, D., Leung, L.C. and Law, J.S. (2008) Modifying Inconsistent Comparison Matrix in Analytic Hierarchy Process: A Heuristic Approach. Journal of Decision Support System, 44, 944-953. http://dx.doi.org/10.1016/j.dss.2007.11.002
[15] Carlucci, D. and Schiuma, G. (2007) Knowledge Assets Value Creation Map Assessing Knowledge Assets Value Drivers Using AHP. Expert Systems with Applications, 32, 814-821. http://dx.doi.org/10.1016/j.eswa.2006.01.046
[16] Godse, M. and Mulik, S. (2009) An Approach for Selecting Software-as-a-Service (SaaS) Product. Proceedings of the IEEE International Conference on Cloud Computing, Bangalore, 21-25 September 2009, 155-158.
http://dx.doi.org/10.1109/cloud.2009.74
[17] Saaty, T.L. (1977) A Scaling Method for Priorities in Hierarchical Structures. Journal of Mathematical Psychology, 15, 234-281. http://dx.doi.org/10.1016/0022-2496(77)90033-5
[18] Rao, R.V. (2013) Decision Making in the Manufacturing Environment Using Graph Theory and Fuzzy Multiple Attribute Decision Making Methods. Springer Series in Advanced Manufacturing, Springer Verlag, London.
[19] Karapetrovic, S. and Rosenbloom, E.S. (1999) A Quality Control Approach to Consistency Paradoxes in AHP. Euro-pean Journal of Operational Research, 119, 704-718.