Feature Extraction using Contourlet Transform for
Glaucomatous Image Classification
F.Fanax Femy
Asst. Professor
Dept. of Computer Applications Noorul Islam University, Kumaracoil
S.P.Victor
, Ph.D Associate Prof. and Head Dept. of Computer ScienceSt. Xavier’s College (Autonomous), Tirulelveli
ABSTRACT
Glaucoma is one of the leading causes of blindness. It is caused by increased Intra Ocular Pressure (IOP) due to the malfunction of the drainage structure of the eyes. There are several methods to detect the Glaucoma from a human eye in the initial stages. In this paper a new system is proposed, which automatically detect Glaucoma disease in the human eye from the fundus database images. The feature extraction within images is based on Contourlet Transform (CT) and the classification is based on Support Vector Machine (SVM).In the existing system Discrete Wavelet Transform is used for feature extraction of Glaucoma images. Discrete Wavelet Transform have less number of information and the features obtained are only in three directions(vertical, horizontal, diagonal).Hence for better resolution and more directions Contourlet Transform is used. The better classification is arrived by extracting and selecting the best features from the contourlet coefficients of the fundus image and the outputs are used as an input to the Support Vector Machine classifier for classification with high accuracy. The proposed system classifies the input fundus images as normal or abnormal with very high accuracy.
1.
INTRODUCTION
Glaucoma is a disease affected in the human eye due to the fluid pressure within the eye rises. If the disease is not identified in the initial stages, the patient may lost their vision. A liquid is flown in and out of the anterior chamber in the human eye. If the liquid is not drained properly the eye pressure rises and it damages the nerve which leads to the loss of vision. Hence the disease must be identified in the initial stages. The digital image processing techniques automatically identify the initial stage of the disease using the fundus images of eye. These techniques give high accuracy for better identification of glaucoma affected eye.
The system in [1] have developed to automatically diagnosis glaucoma using texture and higher order spectra features. The HOS based and texture images based features are extracted from the pre-processed images and then the extracted features are fed to SVM, SMO, random forest and finally classification is done by naïve Bayesian classifiers. For classification four supervised classifiers were evaluated. Arturo Aquino et.al (2010), have simulated a system to detect the optic disc boundary in digital fundus images using morphological processing. The edge detection, and feature extraction techniques, optic disc detection techniques are important for automated diagnosis of various serious ophthalmic pathologies.
In the paper [2] described about the, wavelet subband selection algorithm which is based on the entropy cost function and the extraction of energy features from different subband is theoretically obtained and verified by the simulation results. In this paper MISS algorithm is applied for subband selection based on feature selection and also SGS algorithm is proposed by
incorporating both factors into the subband selection process. Wavelet packet analysis is first conducted theoretically and then is used for a given image model. Evaluation of individual subbands and dependence among subbands affect the subband selection. In wavelet transform reconstruction of denoising and compression is very difficult. Incrementally selecting an informative subset of wavelet subbands used in the MISS algorithm bears some similarities to minimax entropy principle. Due to lack of an accurate statistical model for natural images simulation results are used for different subbands. Jin Yu et.al (2009) have analyzed the automatic optic nerve very clearly in the automated optic nerve and diagnostic support system. The high quality optic nerve images are captured by CSLT and the images are automatically classified by clinical decision making system. CSLT is a new eye imaging technique. CSLT system uses a low intensity monochromatic laser beam to scan the image. The image processing techniques are applied to capture the image and subsets of the images are selected. Then the healthy and diseased optic nerve is classified by using optimal classification..
The system in [3] have developed the survey of retinal images for glaucomatous classification and exudates. The algorithms automatically analyze eye ultrasound images and locate all the features of interest within the images. The diagnoses of the retinal eye image will be performed by image analysis through texture features for classification and clustering model for abnormal images. The drawback of this method is to reduce the problem of storage space and efficient transmission of medical image through region based image compression technique using lossless and loss coding. In the paper [4] they have designed the feature selection and discretization of numeric attributes. They have mentioned that discretization can turn numeric attributes into discrete ones. Feature selection is a task to select the minimum number of attributes needed to represent the data accurately. The Chi square algorithm is based on chi square statistics. Two sets of experiments are conducted. Two extra data sets are designed to test if noise attributes are present. Chi square is a useful and reliable tool for discretization and feature selection of numeric attributes.
In paper [6] they have simulated the system to the detection of glaucoma using an artificial neural network. The feed forward network with error back propagation is used. The hidden nodes and the output node each used a sigmoid activation function. An ANN classification model, using HRT measurements of the ONH, was able to separate glaucomatous from healthy ONHs with a high degree of accuracy. The ANN minimizes the stress from the testing procedure.
This paper is mainly focused on a new system to find the glaucoma disease using the fundus image. The proposed system automatically detects the normal or glaucoma affected image with very high accuracy. The main objectives are the following,
To design a system to automatically classify the normal eye and diseased glaucoma eye from the fundus images.
To extract the best feature using contourlet transform from the given fundus image.
To do the better classification for the extracted image with high accuracy using support vector machine.
Fig.1.Block diagram for the proposed system
Fundus images are collected from the database,www.isi.uu.nl/Rearch/DRIVE/download.php. The image pre-processing is done mainly for noise removal. The median filter is used to remove the noise where a non linear removal technique is used. In this pre-processing step noise reduction helps to retain the edges because median filtering is commonly used for edge detection digital image processing. It removes the noise and keeps the edges of the image. In the next pre-processing step we use the adaptive histogram equalization technique which finds the number of histograms at a time
corresponding to a particular section and redistribute the lightness value throughout the image. The existing histogram equalization technique constructs only one histogram for a image. Hence the adaptive histogram equalization is useful in image enhancement technique which is capable of improving the local contrast of the image and gives the most detail of the image. The pre-processed image then fed for feature extraction.
2.
FEATURE EXTRACTION
Feature extraction is one of the techniques used in pattern recognition for dimensionality reduction. It is used to convert the input image data into set of features. Feature extraction involves how accurately the features are extracted from the image and without loss of any information on the image. This is achieved by several image transformation techniques used in feature extraction. Some of the techniques used for feature extraction are Discrete Cosine transform, Wavelet transform, Curvelet transform, GLC method and Contourlet transform. Wavelet transform is already implemented for Glaucomatous images. Hence in this paper we use contourlet transform for feature extraction of fundus images of the human eye.
2.1 Contourlet transform
The contourlet transform is one of the recent transform in image processing for feature extraction applications. It is used with multiscale and directional filter banks. In this transform the given input images directed to various orientation in multiple scales with flexible aspect ratios. The dominant features in the given input image are easily captured by this transform using image contours. In this transform different and multiscale directional systems are used compared to other transforms. It allows different and flexible number of directions at each scale. It has large number of filter banks which gives this transform computationally efficient. Contourlet transform can be divided into two main steps, namely, Laplacian pyramid (LP) decomposition and directional filter bank (DFB). In each level LP generates a down sampled low pass version of the original and the difference between the original and the prediction, resulting in a band pass image. The input images are captured by the design of filter banks very effectively.
Fig.2.Contourlet Transform
Fig.2. shows the couterlet transform with the filter banks.
CT allows the input pre-processed fundus image to select the best features using the following formulas.
Feature selection is the important step in this block diagram. The CT estimated the feature from the input preprocessed image and then feature selection is based on the variable selection and subset selection. This technique is very useful for redundant feature and the feature contains no information. It won’t allow choosing the feature without information, which will not helpful for further processing.
The selected feature from the fundus image is further taken for image classification.
3.
IMAGE CLASSIFICATION
The selected feature is classified for normal or abnormal (glaucoma affected or not) in the last step of this paper. The classification algorithm decides whether the input image affected with glaucoma or not affected with high accuracy. In this paper we used Support vector machines for effective classification.
3.1 Support vector Machine
Support vector machine very much useful for two class problems. SVM is useful when, using images as input, it gives high accuracy comparable to other neural-network algorithms. Currently, SVM is widely used in object detection & recognition, content-based image retrieval, text recognition, biometrics, speech recognition, etc. It is linear machine with constructing a hyper plane as the decision surface .The margin of separation between positive and negative examples is maximized.
The equation of a decision surface in the form of a hyper plane that does the separation is given by
--- (1)
Where x is the input vector, w is an adjustable weight vector and b is a bias.
for di = +1---(2)
[image:3.595.335.515.272.396.2]
for di = -1 ---(3)
Fig.3.Optimal hyper plane in SVM
Figure 3 shows the geometric construction of an optimal hyper plane for two dimensional input space.
4.
SIMULATION RESULTS:
The five steps mentioned in the block diagram of the proposed system have done using matlab with the input fundus images. In the system the SVM is trained with two different inputs such as non-glaucoma affected eye and glaucoma affected eye images. The simulation results have taken for two cases. In the first case, non-glaucoma affected eye is given as input to our proposed system and the output gives the eye is normal. In the second case, glaucoma affected eye images is fed as input and the output gives abnormal. The input images, pre-processed images and contourlet coefficients for the both cases are shown below.
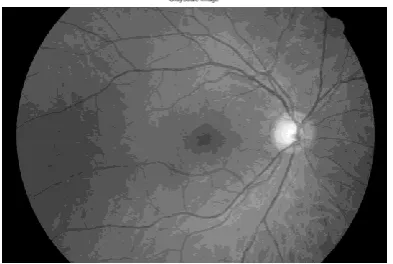
[image:3.595.328.525.432.564.2]Case I: For Non-Glaucoma eye as input
Fig. 4. Non-Glaucoma affected image
Fig.5.Pre-processed gray scale image
Input Image
[image:3.595.55.282.511.757.2]Fig.7.Contourlet decomposed images
Fig.6.Classified output
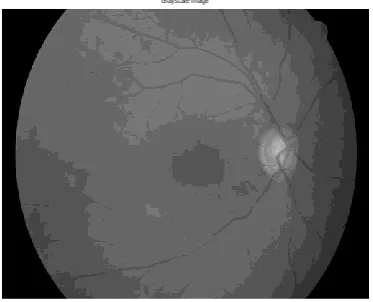
Case 2: Glaucoma eye as input
Fig. 8. Non-Glaucoma affected image
[image:4.595.313.533.297.482.2]Fig.9.Pre-processed gray scale image
Fig.10.Contourlet decomposed images
[image:4.595.89.258.301.417.2]
Fig.11.Classified output
Input Image
[image:4.595.324.526.527.690.2] [image:4.595.75.281.573.711.2]Table 1.Comparision between the proposed and existing methods
Method Recognition rate
With Contourlet and SVM 97.6%
With Wavelet and Neural
Network(MLP) 89.5%
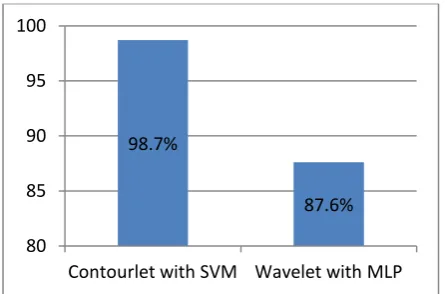
Table 1. shows that the recognition rate for our proposed method contourlet transform with SVM classification is 98.7% and in the existing method wavelet transform with neural network MLP classification gives only 87.6%.
Fig.12. Comparison Chart for existing and proposed method
5.
CONCLUSION
The contourlet transform generates decomposition co-efficient at higher rate which is used to get new features from the input image and these features are helpful for better classification. The feature extraction using wavelet decomposition rate is less to contourlet transform. Hence contourlet transform with SVM automatically classifies the normal eye and diseased glaucoma eye from the fundus images with the recognition rate of 97.8 % for fifty input images. The wavelet transform with multilayer perceptron in neural network gives only 87.6% recognition rate. In this paper our proposed method gives 10% accuracy than existing technique to find Glaucoma disease in the human eye.
6.
REFERENCES
[1] U. R. Acharya, S. Dua, X. Du, V. S. Sree, and C. K. Chua, “Automated diagnosis of glaucoma using texture and higher order spectra features,”IEEE Trans. Inf. Technol. Biomed., vol. 15, no. 3, pp. 449–455, May 2011.
[2] H. Liu and R. Setiono, “Chi2: Feature selection and discretization ofnumeric attributes,” in Proc. IEEE 7th Int. Conf. Tools WithArtif. Intell.,2005,pp.338-391
[3] Ke Huang and Selin Aviyente, ”Wavelet Feature Selection for Image Classification”, IEEE Transactions on image Processing, Vol.17,No.9,Sep 2008.
[4] V.RajendraAcharya. U,Sumeet Dua, Xian Du,VinithaSree S, and Chua KuangChua,”Automated Diagnosis of Glaucoma Using Texture and Higher Order Spectra Features ”,IEEE transactions On Information Technology In Biomedicine,Vol.15,No.3,May 2011.
[5] E.A Essock, Y.Zheng, and P.Gunvant, “Analysis of GDx- VCC Poarimetry data by Wavelet-Fourier analysis across gluacomastages”,Invest .Ophthalmol. V is.Sci…,Volume 46,PP.28382-2847,Aug 2005
[6] A.Khotanzad, J. Lu, “Classification of Invariant Image Representations Using a Neural Network”, IEEE Trans Acoustics, Speech, and Signal Processing, Vol. 38, 1990, pp. 1028-1038.
[7] R. O. Duncan et al., “Retinotopic organization of primary visual cortexin glaucoma: A method for comparing cortical function with damage tothe optic disk,” Invest. Ophthalmol. Vis. Sci., vol. 48, pp. 733–744, Feb.2007.
[8] K.Hild,D.Erdogmus, K.Torkkola, and J.Principe, “Feature extraction using information-theoretic learning,”IEEETrans.PatternAnal.Mach.Intell.,vol.28,no.9,p p.1385-1392,sep.2012.
[9] .X. Zhang, N.H. Younan, and C.G. O’Hara, “Wavelet do- main statistical hyperspectral soil texture classification,” IEEE Trans. Geosci. Remote Sensing, vol. 43, no. 3, pp. 615 – 618, 2005.
[10].J. Ham, Y. Chen, M. Crawford, and J. Ghosh, “Investiga- tion of the random forest framework for classification of hyperspectral data,” IEEE Trans. Geosci. Remote Sens- ing, vol. 43, no. 3, pp. 492–501, 2005.
[11]S. S. Keerthi et al., “Improvements to Platt’s SMO algorithm for SVMclassifier design,” Neural Comput., vol. 13, pp. 637–649, 2001.
98.7%
87.6%
80 85 90 95 100
[image:5.595.54.278.261.408.2]