Supervised ANN vs. Unsupervised SOM to Classify EEG
Data for BCI: Why can GMDH do better?
Omar al-Ketbi
University of Bedfordshire Luton, England
LU1 3JU
Marc Conrad
University of Bedfordshire Luton, England
LU1 3JU
ABSTRACT
Construction of a system for measuring the brain activity (electroencephalogram (EEG)) and recognising thinking patterns comprises significant challenges, in addition to the noise and distortion present in any measuring technique. One of the most major applications of measuring and understanding EGG is the brain-computer interface (BCI) technology. In this paper, ANNs (feedforward back-prop and Self Organising Maps) for EEG data classification will be implemented and compared to abductive-based networks, namely GMDH (Group Methods of Data Handling) to show how GMDH can optimally (i.e. noise and accuracy) classify a given set of BCI’s EEG signals. It is shown that GMDH provides such improvements. In this endeavour, EGG classification based on GMDH will be researched for comprehensible classification without scarifying accuracy. GMDH is suggested to be used to optimally classify a given set of BCI’s EEG signals. The other areas related to BCI will also be addressed yet within the context of this purpose.
General Terms
Pattern Recognition, Brain Computer Interface, Data Mining, Algorithms.
Keywords
GMDH, EEG, BCI, ANN, Supervised ANN, Unsupervised SOM.
1.
INTRODUCTION
A considerable amount of publication in literature, along with reviews and experiments aim to address the concepts and principles of brain-computer interface, with discussions on the most suitable types of BCI (invasive versus non-invasive), principles of operation of these systems, their applications in patients and the prospects the techniques of BCI in the coming years. However, classification of BCI data is one of the challenges yet to be further tackled in the field. Classification algorithms used in BCI systems are divided into main categories: linear classifiers, artificial neural networks (ANNs) including abductive-based networks, nonlinear Bayesian classifiers, nearest neighbour classifiers and combinations of these classifiers. ANNs such as multilayer perceptron model can be used to classify BCI data; however, improvements are always required. One of the major projects that is currently under extensive research within the group of Complex Adaptive Systems – which are complex systems constantly adapting to their environment – is developing a Brain Computer Interface (BCI). This system will allow a user to control a computer (or other devices) by only thinking of doing so. However, there are significant challenges in the construction of such system, such as measuring the brain
activity (electroencephalography (EEG)) and recognising thinking patterns. BCI systems follow a basic premise that comes directly from computer studies, physics and mathematics, which seeks to make machines respond to brain stimuli directly [1].
A brain-computer interface system uses electrical signals that can be detected on the scalp, the cortical surface, or subcortical brain areas. These signals are used to activate external devices such as computers, switches, or prostheses. The BCI modifies these signals from EEG and puts them in action, allowing the subject to communicate with the surrounding world. The BCI is distinguished by the use of two methods: invasive (or intracranial) and noninvasive (recordings of electrophysiological signals). The non-invasive system normally uses EEG to control certain devices. The invasive method is based on recording of small or large groups of neurons. Great efforts have been made however to create BCI systems for more ergonomic use of new types of interfaces such as voice, vision and other devices in virtual reality [2].
skull and to connect a sensor directly to the neuron to be monitored. This is not very practical in most cases and certainly not realistic in real applications. However, this invasive approach of BCI has been demonstrated using monkeys. Recently, scientists at Brown University, in the US have realised an experiment in which a monkey was able to control the cursor on a computer screen (as well as a robotic arm) through an electrode implanted in the part of the brain corresponding to the motor cortex [4]. Ideally, however, a non-invasive way to measure the activity the brain would be preferable. Fortunately, the electrical activity that takes place within the brain can be measured on the surface of the scalp. These signals are called electroencephalogram (EEG) and are extremely weak (micro volts).
An additional problem is that the non-invasive approach to EEG signals measures are a superposition of activities of all neurons in the brain and not correspond to individual neurons. This problem can be mitigated to some point using multiple sensors and complex signal processing techniques [5]. The second major challenge in the construction of a BCI is how to determine patterns of concrete thinking. In other words, how to interpret and decode the EEG signals and associate them with orders or specific thought patterns. This is a complex problem, which is exacerbated by the fact that no two brains are alike. Different people can have very different patterns of EEG for the same thought patterns. A solution to this is an adaptive system. That is, to be able to learn the EEG patterns in a user-specific system in a given time period [6].
3.
POTENTIAL AREAS OF STUDY
The following areas of study among others have been spotted in the BCI literature:1. A BCI system can be described as a closed loop system, consisting of six main steps:
a) Measurement of brain activity carried out mostly with EEG acquisition machines (Signal Acquisition) b) Pre-treatment of brain signals (Signal Processing) c) Feature extraction
d) Classification
e) Translation of commands f) Return perception
2. Suggesting a classifier or a set of classifiers for classifying BCI’s EEG signals, such as Multilayer Perceptron (MLP) and Probabilistic Neural Network (PNN). Generally, Artificial Neural Networks (ANNs) are used to solve complex problems in pattern recognition and classification. ANNs have the ability to generalise from examples, to produce non-linear functions from linear inputs and produce regular structure with massively parallel processing to make improved classification. In many problems the ANN gets results superior to statistical methods of classification, so its use is breakthrough, particularly in clinical areas, involving the analysis of biological signals.
3. Suggesting Methods and algorithms for reducing noise and artefacts contaminating the EEG signals
4. Resolving the high data dimensionality problem: around 9000 features only for a 5 sec. training session [7].
5. Inventing effective training methods as the non-invasive method requires intensive training of the patient to better “use” their brain (i.e. imagine the movement).
4.
INVASIVE AND NON-INVASIVE BCI
Brain Computer Interface (BCI) is a fundamentally new approach to establishing communication between the brain and an external device, especially when used by people with severe motor disorders such as stroke, spinal cord injury, and Amyotrophic Lateral Sclerosis (ALS) among other limitations. In other words, brain-computer interfaces offer entirely new routes to the brain, with the use of aspect still retained by the affected person, for example, use the eyes to select letters on a computer screen. This form of control is performed through brain signals that encode intention of the person to a computer, which translates the received signals and controls an external device such as a computer cursor or a neuroprosthesis [8].A brain computer interface system basically falls in one of two classifications, invasive and non-invasive. Although in 2004 researchers at the University of Washington developed a device which allowed the interaction of a person with a video game using a partially-invasive method, this method did not develop further [9]. The following subsections address a brief definition of these two methods.
The invasive methods capture the neural activity by introducing an electrode inside the skull. The invasive BCI methods often have much higher precision of signals in relation to other methods, but this accuracy itself may not be highly rewarding as it takes a surgical procedure to insert the devices responsible for the capture of the signals somewhere inside the cranium, exposing the user to potential surgical risks.
The non-invasive BCI is a technique proven useful to help patients suffering from paralysis or neurological limitations, which hinder communication with the outside world, and also to omit the risks of surgery on the patient. Furthermore, this technique does not require cerebral intervention, yet provides limited forms of communication to decipher the intentions and decisions of the patient. In general, it is a way of allowing registered patients to interact with a machine by measuring the EEG of a massive number of neurons through an integrated BCI.
In addition to EEG, there are two other ways to capture the neural signals, namely, Magnetoencephalography (MEG) and functional Magnetic Resonance Imaging (fMRI). However, electroencephalography is the most used because it is cheaper and more practical than the other two [10].
5.
APPLICATIONS
The field of BCI has rapidly advanced in recent years, expanding the research from laboratory to clinics, hospitals and computer studies. Initially, the main objective of BCI research was to provide new prospects of rehabilitation for people with severe motor disorders. However, applications are being extended in several other areas. Among the various applications that can be highlighted are those targeting people with physical limitations, such as brain-powered wheelchairs that analyse the brain signals and direct the movements, with the help of cameras and sensors.
controlled individually unlike any previous prosthesis. A prototype of this prosthesis is being tested in amputated humans. However, paralysed people from the neck down cannot use this prosthesis because researchers surgically redirect the nerves control arm to the pectoral muscles [11]. Other applications have also been developed, such as that developed by NASA which aims to restore speech to people who have this disability. The project aims to read the electrical signals in the region of the mouth and throat and transmit them to a processor and then to a microphone. Another company that carries out a similar project is Neural Signals (www.neuralsignals.com). However, instead of reading the lips and throat signs, this project introduces a device in an area of the brain associated with speech and sends the signals to a computer.
New applications of this technology also include leisure and entertainment, monitoring drivers and machinery operators’ vigilance and biofeedback and health monitoring of athletes.
6.
METHODOLOGY
Comparison between the performance of feedforward back-prop neural network and unsupervised using SOM (Self-Organising Maps have been conducted on MATLAB. Upon the results there will be further analysis why GMDH would perform particularly better given the EEG datasets.
6.1
Results of EGG using ANN
The data provided by the BCI Competition II were implemented on MATLAB Self-Organising Maps in order to
test how this method would perform. The data is divided into two training sets and 1 test set. According to BCI Competition, Training set 1 and set 2 have 268 trials that were recorded on two different days and mixed randomly. Training set 1 has 135 trials belonging to class 0 and 133 trials belonging to class 1. The matrix dimensions are 135×5377 and 133×5377. Every line of a matrix contains the data of one trial. The first column codes the class of the trial (0/1). The remaining columns contain the time samples of the 6 EEG channels. This starts with 896 samples from channel 1 and ends with 896 samples from channel 6. The test dataset has a 293×5376 dimension and contains 293 trials of test data. Every trial was recorded on the second day and belongs to either class 0 or class 1. The matrix has nearly the same structure as the train data matrices except for the missing class tag. Thus, every line contains 6 times 896 samples.
The winners of the BCI II competition of the dataset 1a, used in these experiments here, used Normalised Cut to find two clusters which consist of 168 and 100 trials respectively. Their classifier with the modified Cross-Validation technique managed to minimise the classification error to about 10%. The used the built-in linear classifier in MATLAB, called “Classify”.
[image:3.595.50.533.382.489.2]Figure 1 depicts the initial data. As can be noticed, no patterns for classifications can be detected.
Fig 1: Initial datasets before any processing has been undertaken
Classification of signal segments into a given number of classes using segments features can be achieved by various statistical methods. The following sections show the chosen methods.
6.1.1
Experiment 1: Supervised Feedforward
Back-Prop Neural Network
The first experiment on MATLAB is done based on feedforward back-prop neural network using the standard
[image:3.595.65.511.626.725.2]MATLAB toolbox. The entire datasets could not be performed as it took too long and did not finish. Hence, Training_0 was truncated to 160×135, Training_1 was truncated to 160×133 and the test matrix to 160×293. The iteration is illustrated in Figure 2:
Fig. 2: The feedforward back-prop neural network iteration process
Trainset_0
Trainset_1
Test
Ini
ti
a
l
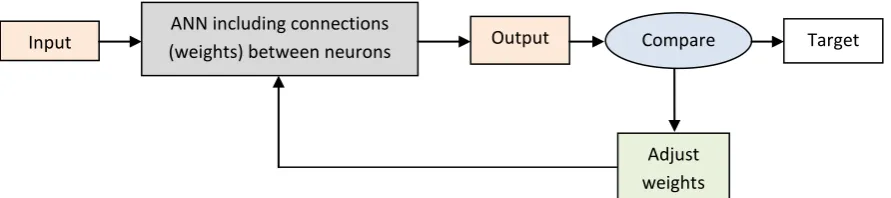
Input (weights) between neurons ANN including connections Output Compare Target
The conducted training using 10 layers on the two training sets has generated the followings results (Figure 3):
R
egr
es
si
[image:4.595.64.530.421.761.2]on
Fig. 3: The results of supervised feedforward back-prop neural network for the dataset
6.2
Experiment 2: Unsupervised
Self-Organising Maps
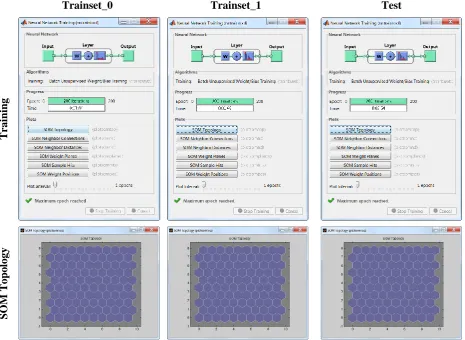
Unsupervised training has also been implemented using MATLAB SOM (Self-Organising Maps) Toolbox. The network was trained on each dataset with 10×10 neurons. Results are compared with the test sets and can be shown that
the network does not perform well (10 minutes on 3.5GHz core i7 processor, 16GB RAM) on the test data in the two datasets. The results are illustrated in the following figure (Figure 4):
Trainset_0
Trainset_1
Test
T
rai
nin
g
SOM
T
opo
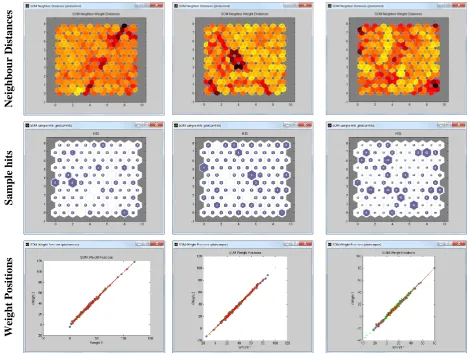
Fig. 4: The results of unsupervised Self Organising Maps (SOM) for the dataset
7.
DISCUSSION
According to Abdel-Aal [12], abductive networks, such as GMDH, allow easier model development and provide more transparency and insight into the modelled phenomena compared to neural networks, which are important aspects in medicine. This can be highly beneficial for the case of volatile EEG (Electroencephalography) data signals that are different in frequency bands and magnitudes in different people. The derived networks are also described in simple polynomial formats that are relatively easy for medical experts to understand [13].
A multilayer feedforward neural network consists of a layer of input units, one or more layers of hidden units, and one output layer of units. A neural network that has no hidden units is called a Perceptron. However, a perceptron can only represent linear functions, so it isn’t powerful enough for the kinds of applications related to BCI for instance. On the other hand, a multilayer feedforward neural network can represent a very broad set of nonlinear functions, so it is very useful in practice.
Unlike neural networks whose topologies are usually decided prior to all detailed (parametric) learning, the GMDH-type architecture is not fixed in advance but becomes fully optimised (both structurally and parametrically). A model in GMDH is represented by a set of neurons in which different pairs in each layer are connected by a linear (i.e.y g x x( ,1 2)w0w x1 1w x2 2) or quadratic
(i.e.yg x x( ,1 2)w0w x1 1w x2 2w x x3 1 2) polynomial to produce new neurons in the next layer. Additional layers are generated until the best performance of the extended model is obtained. Such methodology leads to an optimal PNN structure.
GMDH is based on the idea of finding a function fˆwhich can approximate another function f in order to as close as possible estimate the output yˆof an input vector
1, 2, , n
x x x x to its actual output y. In other words, given m observations of multiple input, single-output data pairs, respectively:
1 11 12 1
2 21 22 2
1 2
( , , , )
( , , , )
( , , )
n n m m m mn
y f x x x
y f x x x
y f x x x
it is possible to train a GMDH-type neural network to estimate the output values:
1 11 12 1
2 21 22 2
1 2
ˆ
ˆ ( , , , )
ˆ
ˆ ( , , , )
ˆ
ˆ ( , , )
n n
m m m mn
y f x x x
y f x x x
y f x x x
N
ei
ghb
our D
is
tance
s
Sampl
e hi
ts
Wei
gh
t Pos
it
of any given input vector:
1 11 12 1
2 21 22 2
1 2
( , , , )
( , , , )
x ( , , , )
n n m m m mn
x x x x
x x x x
x x x
This can be expressed as follows: Given m observations and supposei 1,2,m.Now, let yi f x( i1,xi2,,xin)be multiple input, single-output data pairs, respectively, it is possible to calculate yˆi f xˆ( i1,xi2,,xin)for any given
input vector xi (xi1,xi2,xin)using a GMDH-type neural
network.
In order to determine the GMDH-type neural network, the Kolmogorov-Gabor polynomial:
1 2 0
1 1 1
1 1 1
( , , )
n n n n i i ij i j
i i j n n n
ikk i j j i j k
y x x x a a x a x x
a x x x
is commonly used as the base function of a GMDH model. The relation between the input and the output variables of the Kolmogorov-Gabor polynomial can be expressed as a system of partial quadratic polynomials of two variables (neurons) of the form:
2 2
0 1 2 3 4 5
ˆ ( i, j) i j i j i j
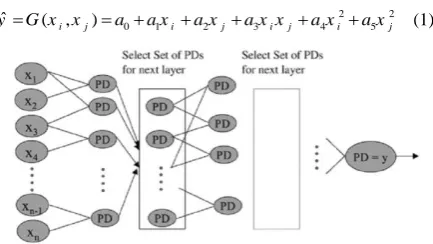
y G x x a a x a x a x x a x a x (1)
Figure 5: The GMDH process showing the tested models of the neurons produced PD (Partial Descriptions) in every layer
Equation (1) is estimated using the set of training data. Such partial quadratic description is recursively applied in a network of connected neurons to build the general mathematical relation of inputs and output variables given by the Kolmogorov-Gabor polynomial. The coefficient ai in the
equation are calculated using regression techniques such that the difference between the actual output y and the calculated one ŷ for each pair xi, xj of input variables is minimised.
This equation is tested for fit by determining the mean square error of the predicted ŷ and actual y values as shown in equation (1) using the set of test data.
Hence, a tree of polynomials can be constructed using the quadratic form given in equation (1), whose coefficients are obtained in a least-squares sense. In this way, the coefficients of each quadratic function Gi are obtained to optimally fit the output in the whole set of input-output data pair such
that
21
m i i i
E y G
and 0i
E a
. This means the error is
reduced to minimum.
In the basic form of the GMDH algorithm, all the possibilities of two independent variables out of total n input variables are taken in order to construct the regression polynomial in the form of equation (1) that best fits the dependent observations (y ii, 1,2,,m)in a least-squares sense. Therefore,
( 1) 2
n n n
n
C neurons are built in the first hidden layer of the feedforward network from the observations
yi,xip,xiq , i1, 2, ,m
for different p, q in{1,2,n}. This is to say that it is now possible to construct m data triples
yi,xip,xiq
,
i 1, 2, ,m
from observation using p, q ∈ { {1,2,n}by Aa = Y, where:0 1 2 3 4 5 a a a a a a a , 2 2
1 1 1 1 1 1
2 2
2 2 2 2 2 2
2 2
1 1
1
p q p q p q p q p q p q mp mq mp mq mp mq
x x x x x x
x x x x x x
A
x x x x x x
and
1 2 m y y Y y
Calculating a is done by the least-squares technique from multiple-regression analysis, leading leads to the solution in the form
T
1 Ta A A A Y which determines the vector of the optimal coefficients of the quadratic equation (1) for the whole set of m data triples. It should be noted that this procedure is repeated for each neuron of the next hidden layer according to the connectivity topology of the network. However, such a solution directly from normal equations is rather susceptible to round off errors and, more importantly, to the singularity of these equations.
7.1
Significance of GMDH in EEG
Classification
Based on the conducted literature review, BCIs (Brain Computer Interfaces) have been successfully used to interpret brain activity signals (Electroencephalogram (EEG)) in a variety of applications ranging from basic cursor movement on a computer screen to a complex prosthesis movement. The main benefits of a BCI system are for patients with severe disabilities to control their external environment.
Classification of EEG signals is the process that aims to determine whether the signals have distinguishable features in their power spectrum in order to regenerate them or make better use of them [13]. According to Lotte et al. [14], there have been different classification methods used to classify EEG signals, namely: linear classifiers, artificial neural networks, nonlinear Bayesian classifiers, nearest neighbour classifiers and combinations of classifiers. Other classification methods, including GMDH (Group Methods of Data Handling), exist, but have not been particularly applied in this field.
[image:6.595.58.275.379.501.2]Abdel-Aal [12] has achieved improved classification accuracy in medical diagnosis by using GMDH algorithms compared to other methods. Schetinin [15] has used polynomial neural networks based on modified GMDH to correctly classify EEG signals, attaining better results compared to those achieved by feedforward neural networks. However, classification of EEG signals for BCI based on GMDH has not been addressed in the literature on the subject.
Chumerin et al. [16] have used GMDH to optimally select amplitude-based features to allow mind-type text on a computer screen. According to these authors, GMDH feature selection method has not been used in the BCI domain so far. Chumerin et al. [16] have attained successful solutions of a GMDH-based classification model. However, their study did not address extensive classification that GMDH potential may provide as their main focus was on attaining a simple solution in the field of BCIs based on Event-Related Potentials (ERPs). Knowing the significant of the achieved results of using GMDH methods for solving classification problems, classification of EEG signals for BCI implementation using GMDH will be researched and implemented in this work.
8.
CONCLUSION
8.1
Summary of Results
For the used dataset 1a from BCI Competition, the following is a summary of the results attained:
8.1.1
Feedforward Back-Prop Neural Network
The regression analysis conducted shows that the data cannot be fit by a straight line as they are co-centred and not temporal
Traindata_0 did 9 epochs whereas Traindata_1 did 10 epochs
Best validation performance achieved at epoch 3 for Traindata_0 and at epoch 4 for Traindata_1
The results show that data are still sparse with the generated classifier
The regression analysis conducted shows that the data cannot be fit by a straight line for both Traindata_0 and Traindata_1 as they are both non-temporal and co-centred
Therefore, basic feedforward neural network does notperform well with the provided data, even after being truncated to a much smaller size, as the generated classifier does not provide satisfactory classification of neither Traindata_0 nor Traindata_1
8.1.2
Self-Organising Maps
The SOM is an unsupervised algorithm that uses a neighbourhood function to preserve the topological properties of the input space. It can be implemented in MATLAB with many parameters that provide possibility to adjust the model. This approach is based on the self-organising neural networks using features as patterns for the input layer of neural networks. The generated graphs are explained below: Neighbour Distances
Because the input data is high dimensional, all the weights cannot be visualised at the same time. In this case, Neighbour Distances plot is used. The figure indicates the distances between neighbouring neurons. This figure uses the following colour coding:
The blue hexagons represent the neurons. The red lines connect neighbouring neurons.
The colours in the regions containing the red lines indicate the distances between neurons.
The darker colours represent larger distances. The lighter colours represent smaller distances. SOM Sample Hits
It can tell how many data points are associated with each neuron.
It is best if the data are fairly evenly distributed across the neurons.
However, the data are concentrated in different areas (i.e. Traindata_0 at 2, 4, 6, 8 and Traindata_1 at 2, 3, 5, 6) Weight Positions
It shows the locations of the data points and the weight vectors.
As the figures above show, after 200 iterations of the batch algorithm, the map is not well distributed through the input space. The weights are rather concentrated in a fuzzy way.
As can be seen in the aforementioned discussion, Feedforward Neural Network and Self-Organising maps have failed to classify the EEG data provided by the BCI Competition, due to its high dimensionality and sparseness. Hence, further methods should be used in order to classify high-dimensional and sparse data, such as EEG (Electroencephalogram) used for BCI (Brain Computer Interfaces) research in feasible time. The literature review conducted has shown that GMDH (Group Methods of Data Handling) can be used to classify such data. Classification of EEG signals is the process that aims to determine whether the signals have distinguishable features in their power spectrum in order to regenerate them or make better use of them. Classification of EEG signals using GMDH has been addressed by Abdel-Aal [12], Schetinin [15] and others, but has not been particularly for BCI applications.
Knowing the significant of the achieved results of using GMDH methods for solving classification problems, classification of EEG signals for BCI implementation using GMDH may be implemented to attain better results in EEG classification.
9.
REFERENCES
[1] Bos, D. P. O., Reuderink, B., van de Laar, B., Gürkök, H., Mühl, C., Poel, M., Nijholt, A. & Heylen, D. 2010. computer interfacing and games. In Brain-Computer Interfaces (pp. 149-178). Springer London. [2] Fetaji, M., Loskoska, S., Fetaji, B. and Ebibi, M. 2007.
Investigating Human Computer Interaction Issues in Designing Efficient Virtual Learning Environments, Balkan Conference in Informatics (BCI 2007)
[3] Nijboer, F., Sellers, E., Mellinger J., Jordan M., Matuz, T., Furdea, A., Halder, S., Mochty, U., Krusienski, D. and Vaughan, T. 2008. A P300-Based Brain-Computer Interface for People With Amyotrophic Lateral Sclerosis, Clin. Neurophysiol
[5] Krauledat, M. 2008. Analysis of Nonstationarities in EEG Signals for Improving Brain-Computer Interface Performance, Doctoral Dissertation, Technical University Berlin
[6] Huan, N. J. and Palaniappan, R. 2004. Classification of Mental Tasks using Fixed and Adaptive Autoregressive Models of EEG Signals, pp. 507-510, IEEE EMBS Conference
[7] Moazzami, M. M. and Mutka, M. 2011. EEG signal Processing in Brain-Computer Interface, Master Thesis, Computer Science Department, Michigan State University, September
[8] Wolpaw, J. R., Birbaumer, N., McFarland, D. J., Pfurtscheller, G. and Vaughan, T. M. 2002. Brain-Computer Interfaces for Communication and Control, Clin. Neurophysiology, vol. 113, pp. 767–791
[9] Bogue, R. 2010. Brain-Computer Interfaces: Control by Thought", Industrial Robot: An International Journal, Vol. 37 Issue 2, pp.126-132
[10]Friston K. J. and Dolan R. J. 2010. Computational and Dynamic Models in Neuroimaging, Neuroimage 52, pp. 752-765
[11]Jabr, F. 2011. Mind-Controlled Prosthetics to Help Amputees, New Scientist Magazine, issue 2810, 28 April [12]Abdel-Aal, R. E. 2005. Improved Classification of Medical Data Using Abductive Network Committees Trained on Different Feature Subsets, Computer Methods and Programs in Biomedicine, Vol. 80, pp. 141-153
[13]Schetinin, V. 2001. Polynomial Neural Networks Learnt to Classify EEG Signals, NIMIA-SC2001 - NATO Advanced Study Institute on Neural Networks for Instrumentation, Measurement, and Related Industrial Applications: Study Cases, Crema, Italy, 9-20 October [14]Chumerin, N., Manyakov, N., Combaz, A. and Van
Hulle, M. 2009. An Application of Feature Selection to On-Line P300 Detection in Brain-Computer Interface. IEEE International Workshop on Machine Learning for Signal Processing a16
[15]Adlakha, A. 2002. Single Trial EEG Classification, Swiss Federal Institute of Technology