Time Series Data Mining in Real Time Surface Runoff
Forecasting through Support Vector Machine
Vinayak Choubey
PG Scholar, VNS Group CSE DEPT RGPV, Bhopal
Satanand Mishra
Scientist, WRM & IT DEPT CSIR-AMPRI
Bhopal
S.K.Pandey
Associate Professor VNS Group, CSE DEPT
RGPV, Bhopal
ABSTRACT
This study presents support vector machine based model for forecasting the runoff-rainfall events. A SVM based model is either implemented through Radial base or Gaussian based Kernel functions. SVM uses precipitation, temperature, sediment, rainfall, water level and discharge as input variable parameters. In this research the Sequential minimal optimization algorithm (SMO) has been implemented as an effective method for training support vector machines (SVMs) on classification tasks defined on large and sparse real time data sets. In this work, we generalized the SMO so that it can handle regression problem and by dividing datasets into test data and trained data performed future forecasting keeping four major evaluation parameters Root Mean Square Error (RMSE), Mean Absolute error (MAE), Mean Squared error (MSE) and correlation coefficient (CC). Study site for this research is Narmada basin reservoir hosahangabad catchment area and the experimental results on predicting the full natural flow of Narmada River indicates that support vector machine method performs far better and more accurate from the current forecasting practices (Artificial Neural Network).
Keywords
Rainfall-runoff prediction, Support Vector Machine (SVM), Sequential Minimum Optimization regression (SMOreg), Artificial Neural Network (ANN)
1.
INTRODUCTION
Rainfall-runoff brings the most important role in the aspects of human life in all types of weather happenings. This is natural climatic phenomenon whose prediction is tough and demanding. Accurate information on rainfall is very necessary for the planning and management of water resources. In hydrology rainfall-runoff prediction is most complex but vital to understand and to model because of the complexity of atmospheric situation that produce rainfall and voluminous range of variation over a wide range of scales both in time and space. On a worldwide scale, more and more attempts have been made by different researchers and scientists to forecast the rainfall accurately using various approaches and techniques. Science of data mining provides so many defying techniques to predict the rainfall-runoff at a satisfactory level. Support vector machine algorithm is one of the most attractive and inductive approach in rainfall prediction owing to their (i) highly nonlinearity (ii) flexibility (iii) better generalization performance other than NN models, (iv) unique, optimal and absent from local minima solution (as it uses linearly constrained quadratic programming) (v) Few parameters are required for turning the learning machine. Support vector machine is a simple and novel machine learning algorithm which is based on statistical learning theory and later it advanced by V.N.Vapnik using theory of the VC dimension
algorithm and based on the experiments, analysed the results. Used dataset consisted of monthly data from two stations and monthly rainfall data from three measurement stations. Analysis of various approaches such as multilinear regression, multilayer perceptron, RBF network, REP Tree, K star, decision table as possible forecasting algorithm and finally concluded that the best one is multilinear regression [11]. In a comprehensive comparison approach of SVM and ANN, Behzada et al. predict one day lead flow runoff. In this research SVM makes use of convex optimization problem produce unique and globally optimal solution. By comparing the forecasting result with artificial neural network concluded that the prediction accuracy of SVM is at least as good as that of other models and in some cases better [7]. Another comparative study of flood forecasting artificial intelligence models in between ANN and SVM have been developed and implemented in different locations to help in weather forecasting over the past years and concluded that SVM has higher nonlinear mapping capabilities that ANN model [12]. In different approaches for predicting runoff SVM and ANN along with hybrid approach is implemented in order to enhance the accuracy of simulating forecasting results [13,14]
2.
MATERIALS AND METHODS
2.1
Study Area and Data Sets
[image:2.595.339.531.143.322.2]The time series of monthly stream flow data of the Narmada river of Madhya Pradesh India is used. The Narmada River catchments cover an area of 39,372 km2 while its length is 1,312 km. For this study out of the seven Narmada basin sites Hosahangabad selected. The basin lies between the latitudes 21o45′N and 24o00′N and longitude 77o45′ E and 80o30′ E approximately. Initially data set had divided in two subsets as training or input set and testing data set. For practical experimental evaluation, statistics of previously stored historical data of 10 years from 2001-2010 is used.
Fig. 1 River basin catchment
2.2
Approach and Learning Methods
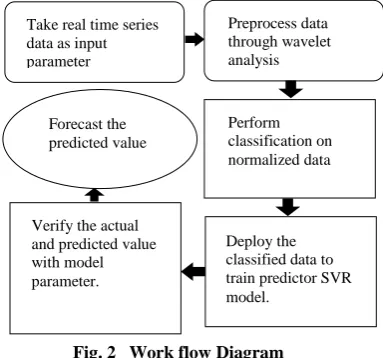
Use of daily basis precipitation, temperature, sediment, rainfall, and water level and discharge data gathered from Hosahangabad monitoring station located in the Narmada River Basin and formatted the data as a desired file format. With the real time data set the prediction further moved across the data to create each forecast. For forecasting, a Machine Learning tool WEKA (Waikato Environment for Knowledge Analysis) used. WEKA provides a large toolbox for learning and mining. In addition WEKA makes it easy to try individual learning algorithm and vary the algorithm parameters to determine which set of parameters provides the best result. In this research pre-processing of data through wavelet analysis (basically used Haar wavelet) has been applied which
[image:2.595.56.279.475.585.2]decomposes the dataset in training and test data with detailed signal and then SMOreg (Support Vector Machine with Sequential Minimum Optimization) with a RBF kernel function is implemented by choosing the last month mean data as the month to predict and data of the other month as the training sample to predict the rainfall and to build the model.
Fig. 2 Work flow Diagram
2.2.1
Support Vector Machine
The idea of support vector machine is initially proposed by Vapnik and his co-workers in late 60’s. SVMs are effective machine learning system which can be used in pattern classification, multiphase evaluation; hydrological forecasting. It uses linear high dimensional hypothesis space called feature space. In other words we can say that it realized through nonlinear mapping an input space to high dimensional feature space [3]. This method is introduced by Vapnik and his colleagues which use supervised learning bias derived from Statistical learning theory (SLT). SVM were generally used to find the optimal separating hyper plane of linear classification problem. The so called minimum separating hyper plane not only separates the data correctly but also maximizes the margin.
SVM is a well-known approach for solving the problem of function estimation. SVM algorithm was first developed to solve the classification problem, but the concept was further extended to the domain of regression problem. In regression and time series forecasting and prediction approaches, excellent performances were obtained. Those approaches are inspired from the Vapnik- Chervonenkis (VC) theory. When SVM is deployed to handle the problems of function approximation and regression estimation, the approaches are often referred to as the support vector regression (SVR) [4].This type of function approximation is very effective, especially in case of high dimensional input space. To find a function f(x) as an approximation of the value y(x) with minimum risk and only based on the available independent and identically distributed data. In SVR the main regression problem can be described as:
Using train data, which is defined as the data used to develop the regression model. Suppose we have a training data {(x11,
x12,………., x1n,y1),………….,
(xl1,xl2,…………xln,yl)} Ϲ X x R, where (Xl1…………..X1n)
represents the predictor variables and Y1 represents observed
variables. The aim in SVR is to find a function f(x) that has most ε deviation from the observed lateral displacements Yl
for all the training data. There are so many forms of loss function e.g. linear, quadratic, exponential etc.in this research
Take real time series data as input parameter
Preprocess data through wavelet analysis
Perform classification on normalized data
Deploy the classified data to train predictor SVR model.
Verify the actual and predicted value with model parameter.
work Vapnik’s Loss function is used, which is known as ε-insensitive specific loss function. In simple words, what Vapnik introduced through the ε-insensitive loss function is that errors less than ε are acceptable, but those deviations larger than ε are unacceptable. It can be mathematically expressed as:
f(x)= + b with w є X, b є R (1)
where denotes the dot product in X. A small value of w, can be obtained by minimizing the Euclidean error norm, i.e., ||w||2.So the SVR problem can be formulated as follows:
Minimize, (2)
Subject to ( ε
yi ‒ ( ε
But, in so many cases having a function f that is flat with error less than ε is not feasible. To tackle this type of infeasible situations a constant C and slack variables , are introduced which leads to the formulation as mentioned in Vapnik.
Minimize + C (3)
Where C is the term that expressed the magnitude of penalty related with errors outside the error margin and , variables representing upper and lower constraints on the output system.
2.2.2
Sequential Minimum Optimization
Regression
The regression optimizer we used is based on the Sequential Minimum Optimization (SMO) algorithm with a radial basis function (RBF) kernel for forecasting process. The SVM with SMO algorithm is named “SMOreg” in WEKA. SMOreg implements the support vector machine for regression. The parameters can be learned using various algorithms. The algorithm is selected by setting the RegOptimizer. The most popular algorithm is RegSMOImproved and its valid options are:
-C <double>
The complexity constant C. (default 1) -N
Whether to 0=normalize/1=standardize/2=neither. (default 0=normalize)
-I <classname and parameters>
Optimizer class used for solving quadratic optimization problem
(default
weka.classifiers.functions.supportVector.RegSMOImproved) -K <classname and parameters>
The Kernel to use. (default:
weka.classifiers.functions.supportVector.PolyKernel)
Options specific to kernel ('-K')
weka.classifiers.functions.supportVector.RBFKernel:
-D
Enables debugging output (if available) to be printed. (default: off)
-no-checks
Turns off all checks - use with caution!(default: checks on) -C <num>
The size of the cache (a prime number), 0 for full cache and -1 to turn it off. (default: 250007)
-E <num>
The Exponent to use. (default: 1.0) -L
Use lower-order terms. (default: no)
Options specific to optimizer ('-I')
weka.classifiers.functions.supportVector.RegSMOImproved:
-T <double>
The tolerance parameter for checking the stopping criterion. (default 0.001)
-V
Use variant 1 of the algorithm when true, otherwise use variant 2. (default true)
-P <double>
The epsilon for round-off error. (default 1.0e-12) -L <double>
The epsilon parameter in epsilon-insensitive loss function. (default 1.0e-3)
-W <double>
The random number seed. (default 1)
2.3
Design of Datasets
Main concentration on comparing final evaluations with the current forecast and changed either the algorithm parameter or used learning algorithm. At initial point, data set had 8 input parameters from a single monitoring station of Narmada Basin sites that is Hosahangabad. Input parameter comprises of four months (June to September) discharge-Rainfall mean data of ten consequent years i.e. from 2001-2010. We replaced input parameter with mean value for missing data.
The data set contain 10 instances for the years 2001 through 2010. These ten year instances used for training purpose and then trained on the years 1975 through 2000. After testing input parameter data set we then further narrowed down the data to create each forecast.
2.4
Description of Development Tools /
Methodologies Used
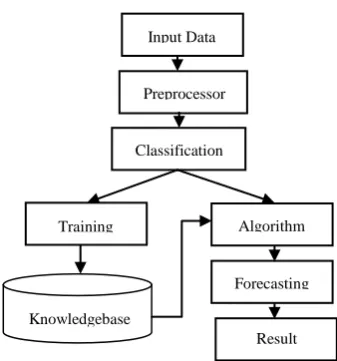
Fig. 3 Algorithm Flow Diagram
3.
RESULTS
The single output parameter was the total unimpeded discharge and rainfall for the June-September period of the Narmada River at the Hosahangabad measurement station, this data point is measured in MCM (Million Cubic Meter). In table 1 we show the Narmada River June-September discharge and Rainfall for 2001 through 2010.
Table2 shows the training and cross validation evaluation parameter statistics. It can be observed from table 2 that SVM model have good performance during training and validation. For the same site, in the training phase, the model obtained the best Correlation coefficient (CC), Root Mean Square Error (RMSE), Mean Absolute Error (MAE) and Relative Absolute Error (RAE) with value of 0.958, 1.193, 1.573 and 41.03%. CC evaluates the linear relation between observed and computed flow, while RMSE evaluates the residual in between forecasted and observed flow. The MAE is a quantity used to measure how close the forecasts to the computed eventual outcomes and RAEgives an estimation of how good a measurement is relative to the size of the thing being forecasted. In addition, in the validation phase also SVM model predictions were able to evaluate a good, near forecasting value.
Table 1. Narmada River Unimpeded Discharge and Rainfall June-Sept (MCM)
Table 2 : Comparison of Evaluation parameters in Training and Validation Phase
Evaluation Parameters
Training Phase
Validation Phase
Correlation coefficient
0.958 0.7572
Mean Absolute Error
1.1933 2.1095
Root Mean Square Error
1.5736 2.3731
Relative Absolute Error
41.0339% 65.286%
Root relative Square Error
46.0436% 62.491%
4.
DISCUSSION
To evaluate performance of this research, compare the Multilayer Perceptron Artificial Neural Network with the result of SVM-SMOreg and additionally compare both with the actual discharge and rainfall for the test years. For evaluation criterion we considered statistics of correlation coefficient, Relative absolute error (RAE), Root Mean Square Error (RMSE). Correlation coefficient statistics value is if more than .6 than it indicates that strong correlation between Discharge-Rainfall (Q-R) which results in more accurate predictions forecast for Rainfall-Runoff and by minimizing RAE and RMSE we will able to produce less erroneous predicted forecasting too. By the help of above statistics plotting of forecasted value for next two consecutive years for the actual- predicted and predicted-predicted
rainfall prediction (future forecast) can be easily and clearly observed by figure 4.
Future Rainfall Forecast for: Actual, Predicted [95% conf. intervals]
Year (2001-2012)
Actual Predicted Actual-predicted Predicted-predicted
Fig. Forecasted Rainfall Prediction Graph
5.
CONCLUSION
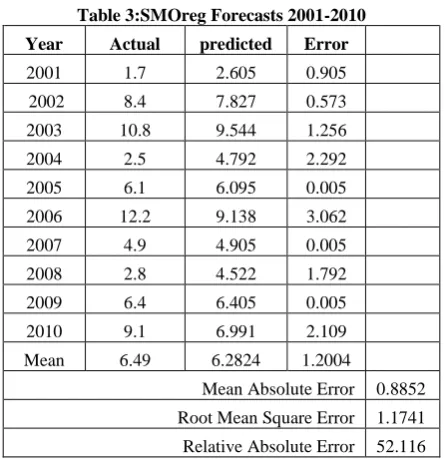
In this paper, the Mean absolute error, Root mean square error, Relative absolute error and correlation coefficient were employed for evaluation model performance. In order to discover more accurate and suitable models for forecasting future runoff-rainfall, for the same basis of comparison, the same training and verification sets, respectively, are used for the two models that are Artificial Neural Network (ANN) and Support Vector Machine (SVM). It can be observed that current results using SMOreg with a RBF Kernel yield a relative absolute error 52.376% in table 3 versus 73.02% for the ANN forecast in table 4.
YEA R
Q June
Q July
Q Aug
Q Sept
R June
R July
R Aug
R Sep t 2001 303.3 1933 1762 518.2 13.8 18.5 8.5 1.6 2002 169.9 178.5 2197 1818 2.5 5.2 14.0 8.3 2003 160.5 1668 1496 4832 0 6.8 13.2 10.8 2004 352.6 321.7 2863 550.8 6.39 7.5 17.0 2.5 2005 201 3202 3758 2012 5.7 16.6 4 6.1 2006 115.6 555.2 2692 2333 0.9 15.2 26.3 12.2 2007 164.8 958.1 1044 829.9 6.5 14.2 5.1 4.9 2008 256.2 681.2 1445 483.9 6 6.9 5.9 2.8 2009 132.6 1058 310.7 2466 5.1 14.1 10.4 6.4 2010 173.2 423.1 987.5 1639 1 10.5 13.8 9.1
Input Data
Preprocessor
Classification
Training Algorithm
Knowledgebase
Forecasting
Result
Ra
in
fa
ll
in
m
[image:4.595.309.524.103.249.2]This is significant improvement over the current forecasts and yields a good model for producing future forecasts. SMOreg also minimizing RMSE error which yields better forecasted result of Rainfall-Runoff with less error. This result clearly indicating that SVM approach is a more convincing and relatively predicting more accurate simulation results than ANN and out performs the ANN model too.
Our most promising line of future work is to apply our methods on other Narmada Basin Sites in Madhya Pradesh and Gujrat and determine if the SMOreg algorithm continuously yields better results than the current forecast methods. A promising possibility is adjusting the SMOreg parameters to optimize prediction
Of dry years.
6.
ACKNOWLEDGEMENT
The authors would like to thank the Central Water Commission, Ministry of Water Resources, India for providing Water Level and Discharge data.
7.
REFERENCES
[1] Ben-Hur A. and Weston J., A User’s Guide to Support Vector Machines.
[2] Behzad M., Asghari K., Eazi M. and Palhang M., Generalized performance of SVM and NN in runoff modelling, 2009, ELSEVIER SCIENCES, Expert System with Application, Vol. 36, Issue 4, pp 7624-7629
[3] Botsis D., Latinopulos P. and Diamantaras K., 2011, Rainfall-Runoff Modeling Using Support Vector Regression and Artificial Neural Networks, CEST2011- Rhodes, Ref No. XXX, Greece.
[4] Bray M. and Han D., 2004, Identification of Support Vector Machines for runoff modeling, journal of hydroinformatics, 06.4, IWA Publishing.
[5] Burbridge Robert and Buxton Bernard, An Introduction to Support Vector Machines for Data Mining, UCL, Gower Street, WC1E 6BT, UK..
[6] Choy Y.K. and Chan W.C., 2010, Modeling of river discharges and rainfall using radial basis function networks based on support vector regression, International Journal of Systems Science, vol.34, numbers14-15, pp763-773.
[7] Hopson T.M. and Webster P.J., 2010, A 1-10-Day Ensemble forecasting Scheme for the major River Basins of Bangladesh: Forecasting Severe Floods of 2003-07, Journal of Hydrometeorology, DOI: 10.1175/2009 JHM1006.1, Vol. 11, pp 618-638.
[8] Mishra S., Majumder S., and Dwivedi V.K. , pattern discovery in hydrological time series data mining in a Sustainable Water resources Management And Climate Change Adaptation, Vol.-II, pp.107-115, February 17-19, 2011, NIT Durgapur.
[9] Mishra S., Dwivedi V.K. , Sarvanan C. and Pathak K. K., Pattern Discovery in Hydrological Time Series Data Mining during the Monsoon Period of the High Flood Years in Brahmaputra River Basin, IJCA(0975-8887), doi-10.5120/11397-6698, Vol. 67, No.6, pp.7-14,April, 2013.
[10] Mishra S., Sarvanan C., Dwivedi V.K. , and Pathak K. K., Discovering Flood Rising Pattern in Hydrological Time Series Data Mining during the Pre Monsoon Period, Indian. Journal of Geo-Marine Science, Accepted on 12/01/2014.
[11] Mishra S., Choubey V., Pandey S.K., and Shukla, J.P. , An Efficient Approach of Support Vector Machine for Runoff Forecasting, IJSER(ISSN 2229-5518) Vol, 5, Issue 3, March-2014,PP. 158-167.
[12] Mishra S., Gupta P. ., Pandey S.K., and Shukla, J.P. , An Efficient Approach of Artificial Neural Network for Runoff Forecasting, IJCA(0975-8887), Vol. 93, No.8, April 2014, Accepted on 25/03/2014.
[image:5.595.47.270.224.454.2][13] Suliman A., Nazri N., Othman M., Malek M.A. and K. Ruhana, Artificial Neural network and Support Vector machine in Flood Forecasting : A Review, 2013, International Conference on Computing and Informatics, ICOCI 2013, pp 327-332.
Table 3:SMOreg Forecasts 2001-2010
Year Actual predicted Error
2001 1.7 2.605 0.905
2002 8.4 7.827 0.573
2003 10.8 9.544 1.256
2004 2.5 4.792 2.292
2005 6.1 6.095 0.005
2006 12.2 9.138 3.062
2007 4.9 4.905 0.005
2008 2.8 4.522 1.792
2009 6.4 6.405 0.005
2010 9.1 6.991 2.109
Mean 6.49 6.2824 1.2004
Mean Absolute Error 0.8852
Root Mean Square Error 1.1741
Relative Absolute Error 52.116
Table 4: ANN Forecast 2001-2010
Year Actual Predicted Error
2001 1.7 4.63 2.93
2002 8.4 4.556 3.844
2003 10.8 6.445 4.355
2004 2.5 4.581 2.081
2005 6.1 4.601 1.499
2006 12.2 10.18 2.02
2007 4.9 7.191 2.291
2008 2.8 2.223 0.577
2009 6.4 6.543 0.143
2010 9.1 4.949 4.151
Mean 6.5 6.2512 2.3891
Mean Absolute Error 2.1234
Root Mean Square Error 2.8022
[image:5.595.48.270.508.739.2][14] Terzi O., Monthly River Flow Forecasting by Data Mining Process, www.intechopen.com.
[15] Wang W-C, Chau K-W, Cheng C-T and Qiu L., 2009, A comparison of performance of several artificial intelligence methods for forecasting monthly discharge time series, Journal Of Hydrology, Vol. 374, No. 3-4, pp
294-306.
[16] Xu J., Wei J. and LIU Y., 2010, Modeling Daily Runoff in a Large-Scale Basin based on Support Vector Machines, International conference on computer and Communication Technologies in Agriculture Engineering, 978-4244-6947-5/10.