Volume 66– No.3, March 2013
Individual Mining and Prediction of Patterns for
Improving Mobile Commerce
Reshma Cherian
P.G Scholar Software EngineeringKarunya University, Coimbatore, India
Bright Gee Varghese.R
Assistant ProfessorDept. of Computer Science and Engineering Karunya University, Coimbatore, India
ABSTRACT
Mobile commerce is a new frontier.It involves the purchase transactions based on a mobile device.The mining and prediction of patterns can suggest stores that are more similar to his/her previous patterns mined and unknown to a customer.In this paper we propose a framework for pattern mining and prediction which is different from all previous perspectives.The difference is advantageous to the user mainly, when a user has no patterns to mine, that is a new customer. To improve mobile commerce, we propose a credit point system. This work enables the user to motivate the purchasing skills, thereby improving mobile commerce. We perform experiments based on various performance metrics and show that it can achieve good results.
Keywords
Data mining, Mobile commerce, Pattern mining and prediction
1.
INTRODUCTION
[image:1.595.48.272.565.680.2]Mobile Commerce is a new emerging technology with greater scope. Mobile devices mainly smart phones overcome laptops and desktops in many perspectives.Its size, portability, availability of internet and so on. Here comes the possibility of mobile commerce. Mobile commerce is the process of business transactions based on a mobile device. When introducing the technology of mining and prediction of mobile commerce patterns with mobile commerce, we can improve the scope of mobile commerce. It is advantageous to customers with the fact that during purchasing,customers
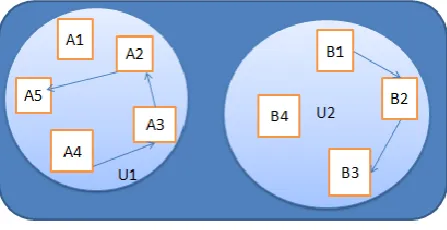
Figure 1. Mobile Commerce Network
usually carry a mobile device mainly a smart phone than laptops because of its smaller size and portability.
In this paper, we aim at developing mining and prediction of patterns of customers.Patterns are the transactions stored when a user is purchasing something,visiting a shopping mall(eg.,“Figure 1”). It has shop information and item information. For example if a user is going to shop A and then to shop B and then to shop C.The user purchases item i1,i2 from shop A, only visits shop B and from shop C,user purchases item i3.This transaction is represented as
{[A,(i1,i2)],[B,0],[C,(i3)]}
It is only one transaction. A user can have many transactions on a day. So counting the number of days,the transactions may be 25, 50 and so on. From all these transactions, coming with the conclusion of 2 or 3 shops based on the items purchased is a very tough task. This is what the system does.
U1
A4->A3->A2->A5 U2
B1->B2->B3
Where U1 and U2 are user1 and user2.
To obtain more knowledge about mining, data mining is used to predict the behavior of users. From data mining the uses of performance metrics mainly precision, recall, F-measure and use of confusion metrics for finding the error percentage and use of data mining algorithms has been envisaged. In data mining, mining can be implemented by association rule mining[1],fast algorithms for mining association rules[2],mining frequent patterns without candidate generation[3] and so on. In [3] a frequent pattern tree approach is used. This approach is more advantageous as it has no candidate generation thus increases performance requiring less time and space complexity. In [4] Eric Hsueh-Chan Lu Et al. implemented a tree called PMCP tree which has user details too. Combining the knowledge of this we build tree for each user, thus individual mining and prediction is possible. Even if the user has no patterns to match then the mining system can depend on users interests specified during the registration procedure.
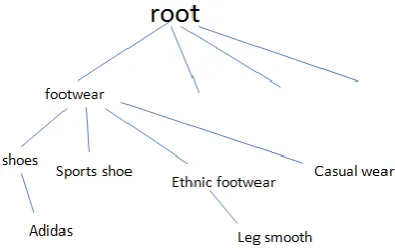
Figure 2. Categorical Heirarchy
similar stores. In their inference model if two stores are similar,then the items are similar and if two items are dissimilar,then the stores which sell them are dissimilar. In their studies they point out that most of the similarity measures can only process numerical data ,but not categorical data.Our transactions are mainly categorical data. It is understandable by a small example in Figure 2. If store A and B sell footwear,both products have different names based on a particular brand. A->adidas and B->Legsmooth. If we are comparing Adidas and Legsmooth based on numerical methods, both are entirely different. But based on categorical hierarchy it has some similarities. The earlier similarity measure can have only two values 1 and 0.If exact match 1 else 0.In the above example it gives the result 0.But it is not correct. The category hierarchy of earlier example is in Fig.2. According to parents degree we assign values ranging from 0 to 1.
2.
RELATED WORKS
In this section , we study and do literature survey based on two categories
1)Mining of patterns , 2)Prediction and behavior of users
2.1 Mining of patterns
In [5] R. Agrawal Et al. solve the problem of pattern mining with two algorithms. They are Apriorisome and Aprioriall and have comparable performance. In [6] D. Xin Et al. solved the problem by compressing frequent pattern sets using RP global and RP local. In [3] J. Han Et al. proposed a frequent pattern tree structure which is used for storing frequent patterns.It avoids costly candidate generation.
2.2 Prediction and behavior of users
A number of observation and research is going on in this field. In [7] S.C. Lee Et al. mine temporal mobile access patterns that suggest mobile users temporal behavior patterns. In [8] V.S. Tseng Et al. have a precise and efficient mobile behavior prediction systems. When users move within the mobile network,their location and services are stored in a mobile transaction database. It has an offline mechanism for mining and online engine for mobile behavior prediction. In [4] Eric Hsueh-Chan Lu Et al. proposed a framework called MCE framework for mining and prediction of mobile users movements and purchasing transactions.
3.
PROPOSED METHOD
This section describes the design of Individual mining and prediction of patterns for improving mobile commerce. It consist of three basic entities mainly 1) Mobile Network , 2) Data mining and prediction and 3) Output of Data mining and Prediction
3.1 System Framework
[image:2.595.102.506.541.741.2]Volume 66– No.3, March 2013
consist of a network of mobile phones and they interact with a system called a web interface,which mainly have various options to interact with customers, shops and malls to register and communicate .From this interface the mobile database get information such as users’ details, their check in to a store, shop details, product information and various other information for mining. Data mining and prediction consist of 1) Mobile Pattern database 2) Data Mining and Prediction 3)Similarity Model and 4) User Interests and Credit Point System. Data mining and Prediction is the basic framework for mining. The Mobile Pattern database stores the patterns for each user whenever a user check in to a store. From the information stored in Mobile Pattern database Data Mining and Prediction system mines and predict the store ,that user next visits based on the shop similarity and pattern similarity. Similarity model mines the shop that is most similar to user patterns.User interests and credit point system is the system which finds the interests of the user and user can give interests and check any credits and offers. This system really improves Mobile commerce. Output of Data Mining and Prediction consist of three outputs. 1) Prediction output 2) Similarity model output and 3) User interests and Credit point system output.
3.2 Data mining and prediction
Data mining and prediction system involves the mining and prediction of recommended stores from user patterns, based on the items purchased and type of items of each store. From the patterns stored in Mobile pattern database, the data mining and prediction system mines the patterns by constructing a tree, which has no candidate generation. This tree is similar to FP-tree in [3]. From the discovered patterns, find the support of each pattern and also the matching length. Matching length is the length of each pattern matching.
Let P1={(a,i1)->(c,i2)->(f,i3)}, Sup(P1)=5
P2={(c,i2)->(i.i4)}
Sup(P2)=8 be two PMCPs.
P’={(a,i1)->(c,i2)->DE
Where P’ is users recent mobile commerce behavior.
Matching length=2 between P1 and P’.
Matching length=1 between P2 and P’.
Pattern score=matching length*support
Pattern score of P1=2*5=10 and
Pattern score of P2=1*8=8.
The consequence of P1 is used to predict the users next behavior.
3.3 Similarity model
Our transactions are mainly categorical data.It is understandable by a small example.If store A and B sells footwear,both products have different names based on a particular brand. A->adidas and B->Legsmooth.If we are comparing Adidas and Legsmooth based on numerical methods, both are entirely different. But based on categorical hierarchy in Figure 2, it has some similarities. The earlier similarity measure can have only two values 1 and 0.If exact match 1 else 0.In the above example it gives the result 0.But it is not correct. According to parents degree we assign values ranging from 0 to 1.From the value called similarity score it predicts the stores having higher similarity score.The similarity score can be obtained by averaging all similar item pairs.
3.4 User interests and credit point system
The user is the main actor involved.Mining is impossible for users those have no previous patterns.Even if Similarity Inference model suggests similar stores,the result is not so accurate.Inorder to overcome such difficulties we introduce user interests.Whenever a user login into the system or during registration, user can specify their interests.User add their interests based on the category that is added by admin. So based on the interests,the system can respond to their predictions. User can add the interests from a list of interests which are leaf nodes of the category tree. So user can view the available categories. Also when entering a shop,the user should get a service regarding the interests specified. This work is a motivation to customers,which improves Mobile Commerce applications.In Credit point system each shop can set the minimum credit point for an item. As users purchase and their number of transactions increase, their credit points increase. As a result users are more interested in mobile commerce.
4. EXPERIMENTAL EVALUATION
We conducted several experiments and collected datasets, mainly patterns and recorded the result of prediction output and similarity model output.The result shows that the output have a high proportion of positives.So ROC (Reciever Operating Characteristic) curves is used to evaluate the performance as shown in Fig.5 and Fig.6.
No. Mochi Legs Royal Nike Reabok Similarity
Model output
1 Britney shoe Royal,Mochi
2 Royal bridal
shoe
Legs
3 Adidas Nike shoe Reabok,Legs
4 Elizabeth bridal Cindrella bridal shoe
Royal
5 reabok Nike,Mochi
No. Mochi Legs Royal Nike Reabok Prediction
output
1 Adidas nike Reabok
2 Cindrella bridal
shoe
Royal
3 Elizabeth bridal Royal Legs
4 nike Reabok brnded Mochi
5 Royal reabokbrnded Mochi
Table1. Similarity Model input-output
cccCCCCCCComparCCCCCComparison
Volume 66– No.3, March 2013
Figure 5. ROC Curve for Similarity Model
It plots the number of positives included in the sample on vertical axis,against the number of negatives on the horizontal axis.Thus we plot ROC curves for prediction utput and similarity model output.We select five similar shops out of fifty shops in the database for prediction of a particular shop. The selected shop for prediction comes under the category footwear. The footwear shops in the database are
a)Mochi-a casual footwear shoe shop.
b)Legs-a bridal shoe shop.
c)Royal-a bridal footwear shop.
d)nike-a sports shoe shop.
[image:5.595.54.283.67.283.2]e) reabok-a sports shoe shop.
Figure 6. ROC Curve for Prediction Model
Table 1 and 2 shows the values of similarity model output and prediction output,out of which we plot the graph.From the table it is known that Royal and Legs are similar shops and nike and reabok are similar shops.The output consist of two or three results which may have true positives and false positives.The jagged line shows the distribution of true positives and false positives.
5.
CONCLUSION
In this paper, we have proposed a novel framework for mining and prediction of mobile commerce.From the experimental results we found out that from a large no of patterns,the framework can conclude two or three results which have high support and prediction score.The user interests and credit point system can achieve high impact on improving mobile commerce.Each user has individual patterns so that individual mining and prediction is possible. So personalized mining is possible which motivates mobile commerce.
6. REFERENCES
[1] R. Agrawal , T. Imielinski, and A. Swami, “Mining Association Rule between Sets of Items in Large Databases,” Proc. ACM SIGMOD Conf. Management of Data, pp. 207-216, May 1993.
[2] R. Agrawal and R. Srikant, “Fast Algorithm for Mining Association Rules,” Proc. Int’l Conf. Very Large Databases, pp. 478-499, Sept 1994.
[3] J. Han, J. Pei, and Y. Yin, “Mining Frequent Patterns without Candidate Generation,” Proc. ACM SIGMOD Conf. Management of Data, pp. 1-12, May 2000.
[4] Eric Hsueh-Chan Lu, Wang-Chien Lee, and Vincent S. Tseng, “A Framework for Personal Mobile Commerce Pattern Mining and Prediction”, IEEE transactions on Knowledge and Data engineering, vol. 24, no. 5, may 2012.
[5] R. Agrawal and R. Srikant, “Mining Sequential Patterns,” Proc.Int’l Conf. Data Eng., pp. 3-14, Mar. 1995.
[6] D. Xin, J. Han, X. Yan, and H. Cheng, “Mining Compressed Frequent-Pattern Sets,” Proc. Int’l Conf. Very Large Data Bases,pp. 709-720, Aug. 2005.
[7] S. C. Lee, J. Paik, J. Ok, I. Song, and U.M. Kim, “Efficient Mining of User Behaviors by Temporal Mobile Access Patterns,” Int’l J. Computer Science Security, vol. 7, no. 2, pp. 285-291, Feb. 2007.
[8] V.S. Tseng, H.C. Lu, and C.H. Huang, “Mining Temporal Mobile Sequential Patterns in Location-Based Service Environments,”Proc. Int’l Conf. Parallel and Distributed Systems, pp. 1-8, Dec. 2007.
0 20 40 60 80 100 120
0 5 10 T r u e P o s i t i v e
s False Positive
ROC curve for
Similarity Model
Series1 Series2 Jagged curve 0 5 10 15 20 25 30-20 0 20 40 T r u e P o s i t i v e s False Positives
ROC Curve for
Prediction Model
Series1
[image:5.595.53.283.488.735.2]