International Research Journal of Management and Commerce Vol. 3, Issue 8, August 2016 IF- 3.861 ISSN: (2348-9766)
© Associated Asia Research Foundation (AARF)
Website: www.aarf.asia Email : [email protected] , [email protected]
NEXUS BETWEEN NON-PERFORMING ASSETS AND BANK
SPECIFIC VARIABLES: A STUDY WITH REFERENCE TO ASSAM
GRAMIN VIKAS BANK
Tapashi Dasgupta
Faculty Associate, Department of Commerce, ICFAI University Nagaland & Research Scholar, Assam University, India.
ABSTRACT
Financial institutions are indispensible for the growth and development of any country in
today’s world but in a country like India, where still a major portion of the population do not
have access to and any account in the most common financial institution “bank”, there
amongst all the different categories of financial institutions, banks play the most crucial role;
and as such it is necessary to look into the efficiency with which bank operate and to look
into its lending portfolio. A healthy bank is considered as one where the assets remain assets
only and do not turn into liability. In this backdrop, the paper is a humble attempt to look in
the health of Assam Gramin Vikas Bank in terms of its non-performing assets for a period of
5 years beginning from 2010-11 till 2014-15 respectively.
Keywords: Non-Performing Assets, Assam Gramin Vikas Bank, Gross & Net advances,
Total Assets, Profitability
1. Introduction
Soundness of financial institutions give an indication of the soundness of the economy and in
India, “banks” are the most important financial institution for meeting the basic requirements
of savings and also for getting money (borrowings) to meet different obligations. Though
after the initiation of the LPG model, private sector banks and foreign sector banks also got
the permission of doing business but their concentration is seen mostly in urban areas of the
because of limited penetration of even most of the public sector banks in interior areas of the
country, the rural population is left with no option but to borrow money from richer persons
of their regions and thereby facing exploitation. The Government of India has started
Regional Rural Banks (RRBs) so that the rural population can have access to basic banking
facilities and currently in one such remote areas of north east, Assam Gramin Vikas Bank
(AGVB) is operating to provide banking facilities to the rural people of the largest north
eastern state of Assam. Assam Gramin Vikas Bank, the only restructured Regional Rural
Bank of north east India was set up on the 12th of January 2006 with its head office situated at
Guwahati. The bank came into existence by amalgamating Pragjyotish Gaonlia Bank,
Lakhimi Gaonlia Bank, Cachar Gramin Bank and Subansiri Gaonlia Bank as per the
provisions under section 23(A) of the Regional Rural Bank Act, 1976. The bank is jointly
owned by the Government of India, Government of Assam and United Bank of India with
stake holdings of 50%, 15% and 35% respectively [1]. While catering to and fulfilling every
ones‟ need in the rural areas by RRBs, it may create problems for the banks if they do not
scrutinize the reasons and viability of the proposal given by the borrowers. The amount of
loans and advances constitute banks‟ assets and if the money lend by the bank is not returned
by the borrowers in due time, then the same assets become banks‟ „liability‟ and affect their
financial health and market standing. The good assets when not repaid within due time by the
borrowers becomes bad and constitute Non-Performing Assets. Non-Performing Asset is
defined as credit facility in respect of which the interest and/or instalment of principal has
remained „past due‟ for a specified period of time. It is a classification used by financial
institutions that refer to loans that are in jeopardy of default [2]. According to Reserve Bank
of India guidelines, Non-Performing Asset means an asset in respect of which: a) interest or
principal (or instalment thereof) is overdue for a period of 90 days or more from the date of
acquisition or the due date as per contract between the borrower and the originator,
whichever is later; b) interest or principal (or instalment thereof) is overdue for a period of 90
days or more from the date fixed for receipt thereof; is overdue on expiry of the planning
period, where no plan is formulated for realization of the assets; d) any other receivable, if it
is overdue for a period of 90 days or more in the books of the Securitization Company or
Reconstruction Company. Non-Performing Assets are classified under two heads: Gross
Non-Performing Assets and Net Non-Performing Assets.
Gross Non-Performing Assets refer to the sum total of all loan assets that are classified as
non-performing as per the guidelines of Reserve Bank of India and consist of all non-standard
type of performing assets in which the bank has deducted the provision regarding
non-performing assets. Net Non-Performing Assets show the actual burden of banks. Since in
India, Balance Sheet of banks contains a huge amount of non-performing assets and the
process of recovery and write off of loans is very time consuming so banks have to make
some provisions against non-performing assets as per the directives of Reserve Bank of India
[4].
2. Review of Literature
Stuti & Bansal [5] have examined the performance of public and private sector banks with
respect to non-performing assets, studied the trends of non-performing assets and also the
causes that lead to high rise in the non-performing assets in the two sectors of the banking
industry. The study found that though there was increase in bank‟s advances but
non-performing assets ratio declined which indicates that public and private sector banks have
made an improvement in the assets quality and also credit portfolio. Rani & Gaba [6] has
done a comparison of gross non-performing assets and gross advances of public, private and
foreign sector banks operating in India. Kumar [7] has also done a comparative study on
gross non-performing assets and gross advances of old private sector and foreign sector banks
operating in India. Manohar [8] has also done a comparison of gross and net non-performing
assets of public and private sector banks in India and provided the reasons for high
performing assets in the banking sector. The paper also analyzed the impact of
non-performing assets on the operations of banks and suggested different ways for management
of non-performing assets. Selvakumar et al [9] has studied the extent of non-performing
assets in four private sector banks operating in Tamil Nadu i.e. City Union Bank, Karur
Vysya Bank, Tamilnad Mercantile Bank and Lakshmi Villas Bank and also made a
comparison of these four banks‟ in terms of their gross and net non-performing assets, ratio
of gross and net performing assets on each banks‟ total assets, ratio of gross and net
performing assets on each banks‟ total advances and percentage of each banks‟ net
non-performing assets on net profitability.
3. Objectives of the study
i. To find out the relationship between gross and net non-performing assets with gross
ii. To find out the relationship between gross and net non-performing assets with total
assets of Assam Gramin Vikas Bank from 2010-11 to 2014-15
iii. To find out the relationship between non-performing assets with net profit of Assam
Gramin Vikas Bank from 2010-11 to 2014-15
4. Methodology
The study has made use of secondary data which are collected from bank‟s annual reports.
The time frame of the study is 5 years beginning from 2010-11 to 2014-15. For analyzing
data, graphs and correlation analysis is done.
5. Hypotheses of the study
H01: There exists no relation in movement ofgross and net non-performing assets with gross
and net advances of Assam Gramin Vikas Bank.
H02: There exists no relation in movement ofgross and net non-performing assets with total
assets of Assam Gramin Vikas Bank.
H03: There exists no relation in movement ofgross and net non-performing assets with net
profit of Assam Gramin Vikas Bank
6. Data Analysis
The following and figures are constructed for making an analysis of Assam Gramin Vikas
Bank‟s Non-Performing Assets.
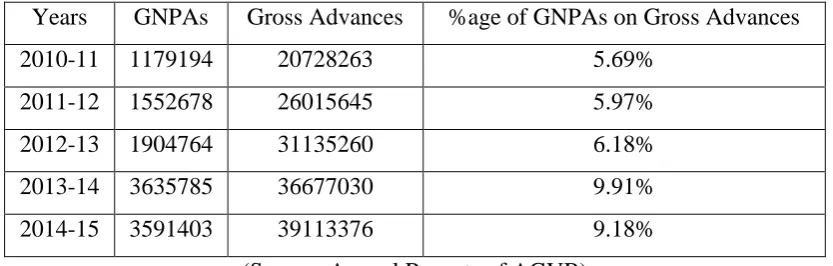
Table I (Amount in thousands)
Years GNPAs Gross Advances %age of GNPAs on Gross Advances
2010-11 1179194 20728263 5.69%
2011-12 1552678 26015645 5.97%
2012-13 1904764 31135260 6.18%
2013-14 3635785 36677030 9.91%
2014-15 3591403 39113376 9.18%
[image:4.595.90.507.532.665.2]Table I (Amount in thousands)
Years NNPAs Net Advances %age of NNPAs on Net Advances
2010-11 673776 20222845 3.33%
2011-12 836736 25299703 3.30%
2012-13 915763 30146259 3.04%
2013-14 1688667 34729912 4.86%
2014-15 1475672 36997645 3.99%
(Source: Annual Reports of AGVB)
The following are the two figures constructed with the help of the information displayed in
the two tables given above.
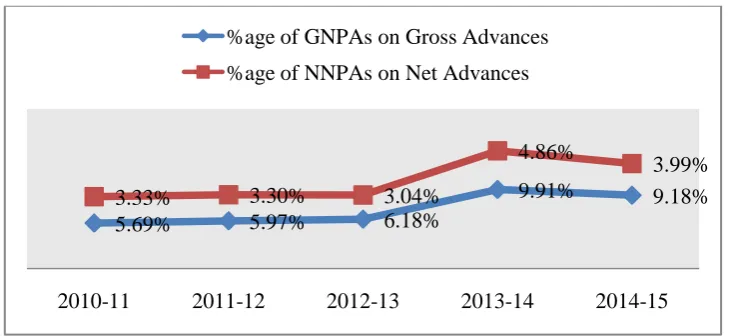
Figure I
From the above figure it can be seen that the percentage of GNPAs on bank‟s Gross
Advances is showing an increasing trend from the first two years of the study period and then
in 2012-13 there is minimal decrease in the percentage. Again in 2013-14, the percentage
increases and reaches 4.86%. There is a decline in the percentage in 2014-15 to the extent of
3.99%.
The trend of percentage of NNPAs on Net Advances is showing a different trend as in
this case an upward trend is visible in the graph above up to 2013-14 and then in 2014-15 the
percentage declines to the extent of 9.18%. The burden of GNPAs and NNPAs on bank‟s
gross and net advances is highest in the year 2013-14 as visible in the graph above.
5.69% 5.97% 6.18%
9.91% 9.18%
3.33% 3.30% 3.04%
4.86%
3.99%
2010-11 2011-12 2012-13 2013-14 2014-15
[image:5.595.116.481.285.453.2]Figure II
From the above figure it can be seen that the percentage of GNPAs on Total Assets of Assam
Gramin Vikas Bank is showing a mixed trend as in 2010-11and 2011-12 there is upward
trend and then there is decline of 1.43% in 2012-13. The percentage increases again in
2013-14 with 2.30% and again falls with 1.68% in 202013-14-15.
As far as percentage of NNPAs on Total Assets of Assam Gramin Vikas Bank is
concerned, from the above graph it can be seen that there is an upward trend up to 2013-14
and then in 2014-15 decline is seen with 4.08%. The burden of GNPAs and NNPAs on
bank‟s total assets is highest in 2013-14 as can be seen in the graph above.
In order to find out whether there is any relation between GNPAs & NNPAs with
bank‟s gross and net advances, GNPAs & NNPAs with bank‟s total assets, and bank‟s net
profit with GNPAs & NNPAs, Karl Pearson‟s correlation analysis is done with the help of
SPSS software. The results are presented below
Gross Advances GNPAs
Gross Advances
Pearson Correlation 1 .950*
Sig. (2-tailed) .013
N 5 5
GNPAs
Pearson Correlation .950* 1
Sig. (2-tailed) .013
N 5 5
2.36% 2.77% 2.96%
4.95%
4.08%
1.35% 1.49% 1.43%
2.30%
1.68%
2010-11 2011-12 2012-13 2013-14 2014-15
*. Correlation is significant at the 0.05 level (2-tailed).
From the above table it can be seen that the coefficient of correlation between Gross
Advances and GNPAs is 0.950. It can thus be inferred that there is high degree of positive
correlation between Gross Advances and GNPAs and that with increase in Gross Advances,
there is high increase in GNPAs each year.
Net Advances NNPAs
Net Advances
Pearson Correlation 1 .901*
Sig. (2-tailed) .037
N 5 5
NNPAs
Pearson Correlation .901* 1
Sig. (2-tailed) .037
N 5 5
*. Correlation is significant at the 0.05 level (2-tailed).
From the above table it can be seen that the coefficient of correlation between Net Advances
and NNPAs is 0.901. It can thus be inferred that similar to the relation between Gross
Advances and GNPAs also there is high degree of positive correlation between Net Advances
and NNPAs and that with the increase in Net Advances every year, there is high increase in
NNPAs of the bank.
Total Assets GNPAs
Total Assets
Pearson Correlation 1 .923*
Sig. (2-tailed) .025
N 5 5
GNPAs
Pearson Correlation .923* 1
Sig. (2-tailed) .025
N 5 5
*. Correlation is significant at the 0.05 level (2-tailed).
From the above table it can be seen that the coefficient of correlation between Total Assets
and GNPAs is 0.923. It can thus be inferred that there is high degree of positive correlation
between Total Assets and GNPAs and that with the increase in bank‟s Total Assets every
Total Assets NNPAs
Total Assets
Pearson Correlation 1 .850
Sig. (2-tailed) .068
N 5 5
NNPAs
Pearson Correlation .850 1
Sig. (2-tailed) .068
N 5 5
From the above table it can be seen that the coefficient of correlation between Total Assets
and NNPAs is 0.850. It can thus be inferred that though the degree is less in comparison to
Total Assets and GNPAs but nonetheless there is high degree of positive correlation between
Total Assets and NNPAs and that with the increase in bank‟s Total Assets every year, there is
high increase in the mount of NNPAs.
Net Profit GNPAs
Net Profit
Pearson Correlation 1 -.423
Sig. (2-tailed) .478
N 5 5
GNPAs
Pearson Correlation -.423 1
Sig. (2-tailed) .478
N 5 5
From the above table it can be seen that the coefficient of correlation between Net Profit and
GNPAs is - 0.423. It can thus be inferred that there is low degree of negative correlation
between Net Profit and GNPAs and that with the increase in Net Profit every year, there is
decrease in GNPAs of the bank but the degree of decline is low.
Net Profit NNPAs
Net Profit
Pearson Correlation 1 -.489
Sig. (2-tailed) .403
N 5 5
NNPAs
Pearson Correlation -.489 1
Sig. (2-tailed) .403
From the above table it can be seen that the coefficient of correlation between Net Profit and
GNPAs is - 0.489. It can thus be inferred that similar to the former case, there is low degree
of negative correlation between Net Profit and NNPAs also and that with the increase in Net
Profit every year, there is decrease in NNPAs of the bank but the degree of decline is low.
From all the above analysis it is seen that non-performing assets have the highest impact
on bank‟s advances followed by its detrimental impact on bank‟s total assets. Net Profit are
not that impact as with its increase, non-performing assets do not increase and shows an
opposite trend of downfall but still then the decline is not to a high extent as the analysis
shows low degree of correlation.
7. Conclusion
The study has tried to display and discuss the non-performing assets scenario of Regional
Rural Banks by taking Assam Gramin Vikas Bank as the sample and similar to the situation
of public sector banks, the study finds that non-performing assets has found its way to
Regional Rural Banks also as Assam Gramin Vikas Bank‟s advances and total assets are not
safe due to the mount of non-performing assets.
The Indian banking sector has more bad assets or asset turned liabilities than „actual
assets‟ and it is very high time for the Government of India, the Reserve Bank of India to take
some strong measures and see that the measures are implemented properly. Though Reserve
Bank of India has directed banks to get rid of their non-performing assets by 2017 but to what
extent there will be success only time will tell.
References
[1] http://www.agvbank.co.in/
[2] Babu, P. Raja, Non-Performing Assets of public sector banks in India. International
Journal of Applied Financial Management Perspectives,2(3),2013, 493-505.
[3] Parmar, Rajeshwari, Non-performing Assets (NPAs): A comparative analysis of SBI and
ICICI bank, International Journal for Research in Management and Pharmacy, 3(3), 2014,
63-72.
[4] Yadav, Sushama, NPAs: Rising Trends and Preventive Measures in Indian Banking
Sectors, International Journal of Advance Research in Computer Science and Management
[5] Stuti, & Bansal, Sanjeev, An analysis of non- performing assets in Indian banking sector,
Vignettes of Research, I (IV), 2013, 73-85.
[6] Rani, Neha & Gaba, Dinesh, Analysis of Non-Performing Assets of Public sector Banks,
Global Journal for Research Analysis, 3(9), 2014, 4-5.
[7] Kumar, Vinod, Major issues in Non-Performing Assets of commercial banks in India,
International Journal of Applied Financial Management Perspectives, 2(3), 2013, 527-536.
[8] Manohar, Ronil K., Management of non-performing assets in Indian banks – A concept
and diagnostic approach, International Journal in Management and Social Science, 2(12),
2014, 257-260.
[9] M. Selvakumar, M, Anbalagan, M, & Gurusamy, M, Analysis of Non-Performing Assets
of Tamil Nadu based Private Sector Commercial Banks in India, International Journal of