AN EMPIRICAL STUDY ON CUSTOMER SATISFACTION
TOWARDS PACKAGEDMILK IN CHENNAI
Mrs. C. T. Neena Mary,
Research Scholar, Department of Commerce, S.I.V.E.T College,GowrivakkamChennai . &
Dr R Rathina Bai,
Research Supervisor, Asst prof in Commerce,S.I.V.E.T College, Gowrivakkam, Chennai
Subject unde r which :INTERNATIONAL JOURNAL OF RESEARCH IN Paper to be included FINANCE AND MARKETING (IJRFM)
ABSTRACT
Consumer behavior is the behavior that consumers display in searching for,
purchasing, using, evaluating and disposing of products and services that they expect will
satisfy their needs and wants (Schiffman, G and Kanuk , 2008). In India, packet milk is
preferred for its hygiene, quality, readily availabile and so on. It is available in reasonable
quantity for the consumers at any time wherever it is needed. Moreover, it is sterilized at a
required temperature so that the quality is assured to the potential consumer for ensuring
customer satisfaction in the market. In this research study the researcher focuses on a sample
of hundred consumers is taken and customer satisfaction towards packaged milk is analyzed
through primary data. Various analyses are studied on Descriptive Analysis, and measure of
dispersion like mean and standard deviation,and also finding out mean rank of different
brands of milk by the consumers are also computed.
Key Words: Customer satisfaction, Packaged milk, Brand preference, consumers
Inte rnational Research Journal of Management and Comme rce ISSN: (2348-9766) Impact Factor- 5.564, Volume 4, Issue 7, July 2017 We bsite- www.aarf.asia, Email : editor@aa rf.asia , ed itoraarf@g mail.co m
I.1 INTRODUCTION
Milk is a vital part of the global food system and also vital for human growth and
development. It maintains our body and protects us from various diseases. The economic
outlook and the process of absorbing nutrients from food and processing them in the body in
order to grow healthy, benefits to a large proportion of the world‟s population. In India, dairy
and dairy products are needed to an unspecified very large number of people in the village. It
has become one of the sources of income for the Indian rural families in addition to the
traditional agricultural products
1.2 NEED OF THE STUDY
The Customer Satisfaction of packaged milk describes that a consumer‟s commitment
in the usage of milk brand. It is also described as the degree to which a consume r continually
buys the same milk brand over a period of time. Moreover, customer satisfaction may be
considered as a mediating and dominating factor for the brand preference of any milk brand.
Therefore it makes it essential and important for the researcher to study about customer
satisfaction towards packaged milk in Chennai.
1.3 OBJECTIVES OF THE STUDY
1. To study the demographic features of consumers in using packaged milk.
2. To examine the impact of variables on customer satisfaction.
3. To analyze the brand preferences on packaged milk.
2. REVIEW OF LITERATURE
Ahila, B.etal (2015)1in his study viewed that, India is the world‟s largest dairy
producer. Indian Dairy sector has grown substantialy over the years. The demand for dairy
products in India has increased attention both in rural and urban sectors. In the state of Tamil
Nadu, Aavin milk brand being the major milk contributor, procures milk, processes it and
sells milk and milk products to consumers. Aspecial reference to the Pollachi Taluk of Tamil
Nadu state is taken for the study. Here the researcher studies consumer perception over Aavin
milk products based on demographic features like age, educational qualification and house
monthly income of the consumers‟ family. Further Chi-square test was analysed.
Ananda Kumar,A and Babu, S (2014)2 studied customer‟s preferences and desires, an
abundant number of choices and many diverse factors that influence their buying behavior.
Factors affecting consumer‟s buying behavior, with the focus on dair y products in
cost, availability, ingredients, product popularity, product quality, product taste, etc., that
influences the choice of a brand
SivasankaranandSivanesan (2013)3 viewed that India has the highest livestock
population in the world with 50 percent of the buffaloes and 20 percent of the world‟s cattle
population, most of which are milk cows and milk buffaloes. India‟s dairy industry is viewed
as one of the most successful development programs after its independence. The year
2006-07 were the total milk production in the country was over 94.6 million tons with a per capita
availability of 229 gms per day. The industry recorded an annual growth of 4 percent during
the period 1993-2005, which is almost 3 times the average growth rate of the dairy industry
in the world. Milk processing in India is around 35 percent, of which the organized dairy
industry accounts for 13 percent of the milk produced, while the rest of the milk is either
consumed at the farm level, or sold as fresh, non-pasteurized milk through unorganized
channels. Dairy cooperatives account for the major share of processed liquid milk marketed
in India.
Jothymary, C (2013)4studied marketing concept starts with the consumer needs and
behavior in meeting consumer needs. Every action of a person is based on the needs. The
actual problem is to learn what a customer takes into account when he decides on a particular
brand. Such a study is concerned with consumer behavior. Importance to study the consumer
attitudes, consumer behaviour, marketing mix, consumer awareness, advertisement
effectiveness, and brand preference are the objectives of the study, Sample size was limited to
120 consumers by using radom sample check.It includes the study of what they buy, why
they buy it, when they buy it, where they buy it, how often they buy it, and how often they
use it.
Franklin John, S.etal(2013)5 investigated the influence of Milk brand rating and
different dimensions of milk brand. The study covers the population includes 325 consumers
from Tamilnadu, who are all using branded milk. The questionnaires were distributed to 500
consumers out of which only 325 were duly filled in and returned promptly. The participants
completed the two sets of self- reported questionnaires, including personal characteristics and
variables were chosen for this study in order to measure the influence of branded milk are the
salience, performance, imagery, judgment, feelings, and Resonance. The collected data were
study were generalized as follows. Statistically significant differences were fo und in the milk
brand rating and the different brand dimensions like Salience, Imagery, Judgement, feelings,
and resonance and there is no statistically significant difference in dimension performance
and milk brand rating.
SubramaniyaBharathy,Retal (2013)6 observed that the India is the leading producer of
milk in the world. It was in the year 1904 when the seed of cooperation was sown in India
with the passage of first Cooperative Act. Since then the cooperative movement has made
rapid strides in all fields of socio-economic activities. Due to the white revolution, there is a
fierce competition among the dairy firms to increase their market share in India. Dairy
Industry is undertaken by farmers to augment their income and it has been the source of
livelihood for the rural masses. In Tamil Nadu, Salem is the leading producer of milk and due
to which many firms have started flooding in the market. It‟s because of the various attributes
Salem consumers continue to be brand loyal to Aavin.
ShahramGilaninia, (2013)7 investigated the effective factors of packaging dairy
products and prioritizing these factors on consumer behavior in the GuilanFarhangian stores.
In this study, we discuss the effect of visual elements(shape, color, size) and
information(tags) dairy products packaging on consumer behavior will be assessed. The
present study, from the purpose sight, is practical and from method, sight is classified in
descriptive- survey researchers. To evaluate the main hypothesis, is used regression and to
ranking components of packaged dairy products is used the Friedman test. The results
indicate that the visual elements of color and packaging and information factors(the label)
have a significant impact on consumer have the highest ranking among respondents.
Vinayagamoorthy,Aetal (2012)8 observed that people complaint that fat in the milk
increases the content of cholesterol in their body causing some disease. To get rid of this
complaint people can go for skimmed milk. Previously, the availability of cattle fa rm was
more and the population was less. To carry out all the day-to-day life activities, energy is
needed. Food gives energy. Hence it is irritable for any human being to intake food. One of
the important factors that must be considered in food is its nutritious value. Nutritious is the
science of food. It is the process by which the organism ingests digests, absorbs, transports,
and utilizes nutrients and disposes of its end products. Collectively, it is the process of intake,
quality product has lead to the increased demand for packet milk. Moreover, the contents of
the packet milk are highly nutritious. It has no cholesterol. This enables even aged people to
consume packet milk. As such, being a nutritious food is important for the human being. Milk
is an essential item used by the people as vegetarian diet more consumption of milk depend
not only on its factor but also on the availability of children and also by the practice of taking
coffee, tea, etc. the chief factor which influences the consumption of milk are availability
level of income of people and prices. Milk is not only an essential item but also most
frequently and commonly used by the people.
Vipul Pare (2012)9 examined the extent to which packaged- goods brands exhibit
excess loyalty over a multi- year period. Brand loyalty for 300 brands in 20 UK product
categories is compared to theoretically expected loyalty levels calculated using the Dirichlet
model. Results show that while many brands show excess loyalty in a particular year (31%),
fewer of them (25% and 22%) exhibit excess loyalty over 2 and 3 years, respectively. Almost
all the brands that do show persistent excess loyalty are private- label brands or are
market-share leaders (either the biggest or the second-biggest brand in the market). Therefore, excess
loyalty over multiple years is a rare occurrence for a band unless it is the market leader or a
private- label brand. The study also shows that 38% of all high-share brands have consistent
access loyalty, and 37% of all private- label brands have consistent excess loyalty. These
results suggest that existing explanations in the literature as to the sources of excess loyalty
need further investigation. The reason is that those explanations relate to distribution effects,
which should be similar across such brands. They, therefore, imply that most high-share and
private- label brands should exhibit excess loyalty. The study suggests several avenues for
further research to identify the reason why some high- share or private-label brands show
excess loyalty and others do not.
MitulDeliya, (2012)10 studied the importance of packaging design as a vehicle for
communication and branding is growing in competitive markets for packaged FMCG
products. This research utilized a focus group methodology to understand consumer behavior
toward such products. The challenge for researchers is to integrate packaging into an
effective purchasing decision model, by understanding Consumer‟s behavior towards the
packaging ofFMCG products. When consumers search for and process information in-store,
the product's package can contain relevant and useful information for the consumer. Product
and may, therefore, play an important role in predicting consumer outcomes. Packages also
deliver brand identification a label information like usage instructions, contents, and list of an
ingredient or raw materials, wanting for use and directives for the care of the product.
Nidhyananth andSugapriya ( 2011)11 studied the overview of consumer behavior of
Aavin milk with reference to Erode District. The major objective of the study to determine
the consumer behavior towards Aavin milk products and to find out the consumer mentality
towards using the service. The research mainly focuses on the factors like quality, consumer
preference, price, service, attitudes and experience of consumers. In this study, data are
collected from the consumers through a questionnaire (interview schedule). 100 samples are
selected using convenience sampling. Using the interview schedule prepared, the
100consumers are interviewed personally and their opinion was collected. Second ary data
was collected from related websites, books. The collected data is analyzed using simple
percentage and chi-square. Suggestions are given to the company to take initiation to fulfill
the consumer needs in the study.
AEN De Alwis and AMTP Athauda (2009)12 study focused on analyzing the
consumer attitudes, demographic and economic factors that affecting fresh milk consumption
among the mid-country consumers of Sri Lanka. Data were collected through a consumer
survey conducted in Kandy district at randomly selected supermarkets, groceries, milk bars
and retail shops. Factor analysis was carried out in order to weigh up the consumer attitudes
and factor scores were introduced to the final model as independent variables which can be
categorized as cost and usage, nutrition, sensory factors, and availability. An ordered logistic
regression was carried out to find out the relationships between a number of demographic and
socio-economic characteristics of consumers such as age, gender, the level of education,
income, size and composition of the household, ethnic group and presence of diseases that
affect fresh milk consumption. Results from estimation of ordered logistic regression model
of consumption show age of the respondent, cost and usage related att itudinal factor and
Nutrition related attitudinal factors are the key determinants of milk consumption levels;
however, household monthly income, health problems effect on fresh milk consumption and
level of education play a more important role in consumption. Finally, these findings suggest
VladislavaBartosevicien and GintarasSaparnis (2005)13 study observed that the turn of
the economy changes the needs of current customers and would attract new ones. Because
customer behavior is a constituent of human behavior, it is difficult to forecast. Therefore
enterprises have periodically to carry out the analysis of customer behavior, allowing
understating customer deeds and forecast their future behavior. In the paper, the level of milk
and its product consumption in Lithuania and consumption tendencies are highlighted. Only
fully satisfied customers can become loyal customer
3 RESEARCH METHODOLOGY 3.1 Research Design
The investigator has chosen the “Descriptive Research” design which best suits in the
present study. The main characteristics of descriptive research are that the investigator has no
control over the variables studied and can only report what has happened or w hat is
happening? The major purpose of descriptive research is a description of the state of affairs
as it exists at present (Kothari, 2004).
3.2 Population
The population of the present study consists of different consumers in chennai and it
is found to be more of infinite in nature, therefore, the unit of population is difficult to
measure in the study.
3.3 Sampling Design
For the present study, the investigation has selected both simple random sampling and
convenience sampling technique.
3.4 Sample Size
The sample consists of 100 consumers from C hennai which include students,
employed persons (male & female), housewives, educated, unemployed, self-employed etc.
Their personal information such as Gender, Marital Status, Educational level, Occupation,
Household Income, Size of family, type of Food Habit and type of family are studied. The
preferential meanrank( i.e.,) the choice of the customers of branded packaged milk and
variables of Customer satisfaction are also studied.
3.5 Data Collection Method
Primary and secondary data were collected and used for this present study. Primary
data are collected fresh from the consumers for the very first time and happens to attain
originality. With the help of the questionnaire, the researcher was able to collect and gather
given to the consumers concerned with a humble request to answer and fill in the
questionnaire and return it to the researcher.The secondary data were collected through
books/magazines, journals, websites and company records.
3.6 Reliability and Validity
In the present study, the researcher has chosencronbach‟s Alpha reliability test. The
study reveals all items are satisfied and was found values to be r = 0.85
Table 4.11 showing cronbach alpha value for custome r satisfaction
S, No Variables No. of
sample
No. of
items
Cronbach
Alpha values
1. Customer
satisfaction
100 9 .827
Table 4.11 reveals that the cronbach alpha value for customer satisfaction is .827
which satisfies the alpha value r =.85 and the number of variables taken for the study are
nine.
4. ANALYSIS AND INTERPRETATION DESCRIPITIVE ANALYSIS
In this study the research analysed some of the demographic profile of the
respondents which are felt relevant. The variables such as Gender, Educational qualification,
marital status, occupation, type of family, family size, food habit and Household income are
being studied. All these variables have an effect on customer satisfaction on packaged milk in
chennai. These effects are studied through percentage analysis.
Percentage analysis is one of the statistical measures used to describe the
characteristics of the sample or population in totality. It also involves computing measures of
variables selected of the study and its finding will give easy interpretation for the reader.
Table 4.1
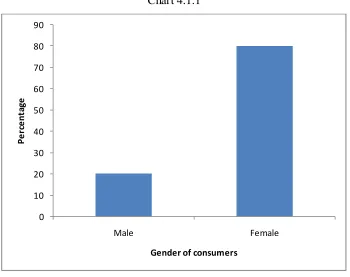
Gende r wise distribution of consume rs Gende r No of Respondents Percentage
Male 20 20.0
Female 80 80.0
Total 100 100.0
Chart 4.1.1
From the above table 4.1, it is indicated that majority of the respondents (80%) are
female consumers and (20%) are male consumers. The above percentage of respondents
determined that female consumers are the maximum than male consumers since they are the
consumers who decide the essentials and need of the product for their household. It is also
[image:9.596.124.474.64.341.2]pictorially shown in chart 4.1.1
Table 4.2
Educational Qualification of consume rs Educational Qualification No of
Respondents Percentage
UptoHsc 22 22.0
UG 24 24.0
PG 27 27.0
Professional 12 12.0
Others 15 15.0
Total 100 100.0
Source: Primary data 0
10 20 30 40 50 60 70 80 90
Male Female
P
e
rc
e
nt
ag
e
Chart 4.2.2
Table 4.2 describes that most of the respondents are professional consumers having
(27%) who decides to purchase their favouritemilk brand followed by undergraduates
consumers of (24%). Other categories of respondents who are housewives around (15%) also
[image:10.596.106.493.63.227.2]determine to purchase their milk brand. This is also shown in diagram 4.2.2
Table 4.3
Marital Status of consumers
Marital Status No of Respondents Percentage
Married 72 72.0
Unmarried 28 28.0
Total 100 100.0
Source: Primary data
Table 4.3 shows that majority (72%) of the respondents are married. Married
[image:10.596.158.444.371.473.2]respondents are consuming more quantity of branded packaged milk.
Table 4.4
Occupation of the consume rs
Occupation No of Respondents Percentage
Business 8 8.0
Government Employee 11 11.0
Private Employee 46 46.0
Others 35 35.0
Total 100 100.0
Source: Primary data
Upto Hsc
UG
PG
Professional
[image:10.596.130.467.552.706.2]Table 4.4 expresses that out of the total respondents 46% are working in private concerns and
35 % are other category people like housewives, daily coolies, students etc. It reveals that
[image:11.596.166.432.130.285.2]private concerns are interested in trying out more type of branded packaged milk.
Table 4.5
Type of family Distribution Type of family No of
Respondents Percentage
Joint 31 31.0
Nuclear 69 69.0
Total 100 100.0
Source: Primary data
From the above table it indicates that 4.5 majority (69%) of the respondents belong to
[image:11.596.149.447.387.554.2]nuclear type of family who prefer to buy branded packaged milk for their daily consumption.
Table 4.6
Number of family me mbe rs distribution Number of family
me mbers
No of
Respondents Percentage
Upto 4 members 73 73.0
Upto 5 members 13 13.0
Upto 6 and above 14 14.0
Total 100 100.0
Source: Primary data
From the above table 4.6 73% of the respondents family are having four members
and more than five and six member family are having 13% and 14% respectively. So more
Table 4.7
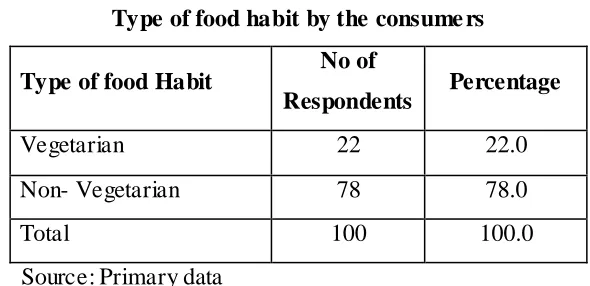
Type of food habit by the consume rs Type of food Habit No of
Respondents Percentage
Vegetarian 22 22.0
Non- Vegetarian 78 78.0
Total 100 100.0
Source: Primary data
Table 4.7 shows the type of food habit among respondents are more in the case of non
[image:12.596.151.444.308.497.2]vegetarian which is around 78% than vegetarian respondents which is around 22 %
Table 4.8
Household Income of the consume rs Family monthly
income
No of
Respondents Percentage
Below 30,000 39 39.0
30,000-40,000 16 16.0
40,000-50,000 21 21.0
50,000-60,000 24 24.0
Total 100 100.0
Source: Primary data
The household income 39% of consumers are having below 30,000 as their family
monthly income in table 4.8 and 24% of consumers are having above 50,000 as monthly
income. Since it is an essential product in their household all income groups contribute to
Table 4.9
Mean Rank of Preferential choice of brand Preferential choice of brand Mean
Aavin 1.98
Arokya 2.96
Cavins 4.57
Jersey 6.28
Thirumala 4.96
Heritage 4.68
Hatsun 5.35
Govardhan 7.35
Source: Primary data
The test reveals in table 4.9 about the preferential choice of different brands of milk.
The least mean rank being the best which is Aavin (1.98), followed by Arokya which is
(2.96) and the last preferred is Govardhan which is less preferred by respondents which ahs
the mean rank of 7.35.
Table 4.10
Mean and Standard Deviation of Custome r Satisfaction
Custome r Satisfaction Mean SD
Satisfied with Quality 4.10 0.927
More benefits 4.11 0.875
Trust the milk 4.02 0.876
Purity and thickness 3.81 0.961
Committed to buy 3.91 0.965
Usage of same brand 4.05 0.978
Contentment of service 3.89 1.136
Available in all stores 3.97 0.969
Advertisements 3.42 1.191
[image:13.596.94.495.459.688.2]Based on the mean scores in Table 4.10 with regard to customer satisfaction , the
respondents are highly satisfied with quality (4.10), they feel the benefits(4.11) are more by
using their favorite milk. Consumers also trust the milk they buy having a mean score of
(4.02), and continue to use the same brand of milk (4.05), they do not rely much on
advertisements(3.42) as they feel they could assess the quality by their usage of milk.
FINDINGS OF THE STUDY
Majority of the respondents are female consumers than male consumers since female
are the consumers who decide the essentials and need of the product for their
household.
Most of the respondents are professional consumers who decide to purchase their
favorite milk brand followed by undergraduates, housewives to purchase their milk
brand.
Majority of the respondents are married consumers.
Out of the total respondents, most of the consumers are working in private concerns
and other category people like house wives, daily coolies, students etc. It reveals that
private concerns are interested in trying out more type of branded packaged milk.
Study also reveals that majority of the respondents belong to the nuclear type of
family who prefers to buy branded packaged milk for their daily consumption.
A good majority of the respondents family are having four members and more than
five and six members of the family. The study reveals that more than four members
type of family are consuming more quantity of milk.
The type of food habit among respondents are more in the case of nonvegetarian than
vegetarian respondents.
The household income of consumers are having below 30,000 as their family monthly
income and also consumers are having above 50,000 as monthly income. Since it is an
essential product in their household all income groups contribute to purchase their
favorite branded packaged milk.
The test reveals about the preferential choice of different brands of milk. The least
mean rank being the best which is Aavin, followed by Arokya and the last preferred
is Govardhan which is less preferred by respondents.
The mean scores with regard to customer satisfaction, the respondents are highly
satisfied with the quality and they feel more benefits are derived by using the ir
milk they buy and continue to use the same brand of milk, they do not rely much on
advertisements as they feel they could assess the quality by their usage of milk and
take the right decision in purchasing their favourite brand.
LIMITATIONS OF THE STUDY
1. The research findings were applied only in Chennai city
2. The respondents may not be true in filling the questionnaire
3. Time was the major constraint in collecting the data.
4. The sample size was restricted to hundred respondents only
CONCLUSION
Even though there are many competitors in the market, Consumers are
stronglysatisfied with Aavin Milk brand, as it stands out as the best brand. The study reveals
that the competitors brand need to improve and enhance in order to withstand in the market
and to gain customer satisfactionConsumers felt that in preparation of other milk products
like curd, paneer, and sweets Aavin brand of milk is preferred. Satisfied customers are loyal
towards the brand and prefer to use the same brand. Customers do not rely on Advertisement
in taking decision for purchasing the brand. Thus with regard to Gender, education
qualification, marital status, occupation, household income, size of the family, type of food
habits customers are highly satisfied with their preference.
“SATISFIED CONSUMERMAKES A DIFFERENCE IN THE MARKET”
REFERENCES
1. Schiffman L. G. and Kanuk L.L. (2008) “Consumer behavior”. 9th edition, Pearson Prentice hall of India, New Delhi, p. 23.
2. Philip Kotler, Marketing Management, 11th Edition, Prentice-Hall of India Pvt. Ltd., New Delhi, 2004
3. Ahila, B.(2015) Consumer Behaviour On Aavin Milk and Dairy Products in Pollachi Taluk of Tamil Nadu International Journal of Commerce, Business and Management.
Vol: 4, NO: 6.
4. Ananda Kumar,A and Babu, S (2014) Factors Influencing Consumer Buying Behavior with Special Reference To Dairy Products In Pondicherry State. Journal Of Research In
5. SivasankarandSivanesan,R (2013) Brand preference of packed Milk- Comparative Study on Rural and Urban Consumers in Kanyakumari District Vol:2, NO:7,
PP:22-35
6. JothiMary,C (2013) A study on Consumer Behavior of Aavin Milk in Bhel Township :Trichy Vol :1, NO:4, PP:34-39
7. Franklin John,S (2013) Branding is the Solution for Product differentiation in Indian Dairy Industry. IOSR Journal of Business and Management (IOSR-JBM) Vol:14, NO:14,
PP:93-99.
8. SubramaniyaBharathy, R(2013) A Study on The Competitive of Aavin over Its Rivals in the Salem Region: An Empirical Study.Vol:2, NO: 7, PP: 44-56
9. ShahramGilaninia (2013) Affecting Factors of Packaging Milk Production On Guilan Consumer Behavior. Arabian Journal Of Business and Management
Review(Nigerian Chapter).vol:1, NO:3.
10.Vinayagamoorthy,A(2012) A Study on Consumer Satisfaction of Aavin Milk in Salem City. Indian Journal of Applied Research.Vol:1 NO: 9.
11.Vipul Pare (2012) The Persistence of excess brand loyalty over multiple ye ars. Springer.PP:163-175.
12.Mitul Deliya( 2012) Consumer Behavior Towards The New Packaging Of FMCG Products. Vol NO: 1, PP:199-207
13.Nidhyananth,D and Sugapriya,S (2011) An overview of consumer behavior towards Aavin Milk in Erode District. IOSR Journal of Business Management, PP
64-66.
14.AEN De Alwis, AMTP Athauda (2009)Analysis of Factors Affecting Fresh Milk Consumption Among The Mid-Country Consumers. Faculty of Agriculture, University of
Ruh.