Measuring Relative Military Security
Andreou, Andreas and Zombanakis, George
Cyprus University of Technology, The American College of Greece
14 July 2003
Online at
https://mpra.ub.uni-muenchen.de/78660/
37
“When two armies are about to clash and the second is ten
times the manpower of the first, it is certain in advance – irrespective of all other considerations –that the first will flee.”
Sun Tzu, “The Art of War”
It seems, therefore, that there is much more to the demographic problem of Greece
than what meets the eye. The rapid rise of the standard of living in the country during
the past two decades had very little to do with the widely acknowledged recipe provided
by the Rostwian pattern of development. This “irregular” pattern of development in
Greece, attributed to a large extent to the misallocation of EU funds generously flowing
in the country for the last twenty years was not, however, free of any adverse
repercussions. In fact, it formulated a mentality founded on excessive materialism,
which, in its turn, became the cause of radical revisions as it concerns the moral and
ethical standards of the Greek society. These revisions resulted to losing traditional
values concerning marriage, family and children and to adopting structural changes in
the average family pattern1 with the abortions figure being a multiple of that of births2.
1
The problem, however, is not only a social one. Its economics aspect appears in the
form of a rapidly approaching social security problem3 and a massive flow of
immigrants, estimated to exceed one million today, aiming at satisfying the excess
demand in selected professions considered as inferior by the local labor force4. The
labor market rigidities of the Greek economy simply aggravate the situation.
These adverse demographic developments used to be more pronounced in the north
of the country, near the Greek-Turkish border, a highly underdeveloped region with a
strong Moslem presence. The problem in the area, however, seems to be, at least to a
certain extent, resolved thanks to the contribution of the Church which, beginning 1999,
has been subsidizing all families in the area having more than two children, a measure
that yielded impressive results. Thus, in 1999 the number of families with three children
was 105, it rose to 404 in the next year and to 670 in 2001, while it exceeded 800 for the
year 2002. The tragic part of this story is that these families used to collect this subsidy
between 1990 and 1993, when, following a change of government, this form of financial
support was declared inefficient and was, therefore, abandoned. It took the government
about ten years to realize the extent of the damage caused and beginning 2003 the
support of these families has been decided to take the form of tax exemptions. This
example simply underlines the considerable degree of government inconsistency in
cases in which sensitive issues of top national interest must be handled.
2
Abortions are estimated to about 250,000 compared to 100,000 births per year. Concerning the latter, the birth rate has declined by about 30% since the decade of the eighties and to make things worse, 20% of the latest birth figures refer to immigrants’ children. In fact, almost the entire population increase of the country during the past few years is attributed to the flow of immigrants, a large number of whom are Moslems.
3
During the nineties the number of pensioners increased by about 25% bringing the employed over pensioners ratio down to 1.75. Moreover, the present value of the accumulated liabilities in terms of state social security contributions amounts to a rough aggregate of 150% of the GDP based on the regulations and parameters of the present system (Bank of Greece, “Report of the Governor to the Parliament ”, 2002 p.p. 119-123. See also, “Greek Strategy on Pensions”, Athens, September 2002).
4
Interim 1 39
The corresponding picture in Turkey is much more promising and its projection
shows that the population will reach 91.8 million people by 2025. The problem in this
case, however, seems to be more qualitative rather than quantitative, as Turks account
for less than 80% of Turkey's population with the majority of the rest being Kurds5.
At least in quantitative terms, therefore, the demographic comparison of Greece and
Turkey is overwhelmingly in favour of the second. And it goes without saying that such
developments will undoubtedly affect the balance of power between the two sides. We
shall have the opportunity to refer to this point later on in this book, by arguing in
favour of the Greek defence authorities’ shift to the new dogma, which places emphasis
on technology, flexibility and speed of action rather than large manpower figures.
Unfortunately, however, the element of demagogy and vote maximisation has made its
presence strongly felt in this case as well, in the form of repeated governmental
promises for military service term reduction. Given the outlook regarding the
demographic developments earlier presented, the shift from compulsory military service
to professional armed forces deserves much more attention than what the authorities
attach to it. One cannot deny, of course, the importance of professionals in times of
adverse demographic developments and galloping technological advance, which makes
weapons more and more sophisticated. However, relying less on manpower does not
mean denying the contribution of the population to the defence of the country.
The expression “denying the contribution” has been chosen to reflect its full
meaning in this case. The average Greek, with very few exceptions, feels that it is his
duty to contribute to the defence of the country. In fact the military service is the only
experience that all male Greeks share irrespective of background, social or economic
status and, despite their continuous bragging about time wasted, one of their favorite
discussion topics has always been their memories referring to their military service.
Moreover, reducing, or even abolishing military service comes down to being equivalent
5
to denying the average Greek his right to serve and contribute to the defence of the
Nation, given that according to the Greek Constitution, Defence is a public good to
which everybody must be willing and able to contribute. The state, in its turn, has
always been providing those serving their military service with much more than just
daily food and shelter. There is a wide variety of benefits one can acquire during his
service term which has been particularly true for the period following the Second World
War when the only way to prove that you could exercise any profession, from flying an
airplane to being a barber, was to show that you had been doing this during your military
service. Paradox as it may sound, the fact remains that this is just one of the ways in
which the armed forces and the military service, in particular, have contributed to the
impressive post-war growth rates of the Greek economy. Given these facts, the current
position of the Greek state simply confirms the radical revision of its traditional values
by promising a gradual reduction of the military service offering in return the chance to
all young Greeks to join the unemployment lists one or two years earlier. These lists are
expected to grow longer in the future in anticipation of a number of inevitable structural
changes in the domestic labor market!
The long military history of Greece provides no example in which professionalism
has triumphed over the focus on national interests. The latter, on the contrary, has been
one of the leading motives behind the brilliant performance of the Greek armed forces
for centuries now. It seems, unfortunately, that everybody consult History except the
Defence authorities of Greece. In fact, one cannot help recalling that there are rumors
according to which a notorious foreign politician has pointed out that History teaches
how Greeks are difficult to handle. He has suggested, therefore, that they may become
more manageable if one strikes deep into their cultural roots, i.e. their language, their
religion and their intellectual and historical resources, thus eliminating their every
possibility to excel and become powerful. As a result, he concluded, the Greeks would
stop obstructing his country’s foreign policy in the Balkans, the Eastern Mediterranean, the Middle East and all this area that has always been sensitive for his country’s
interests. Irrespective of whether this is true or not, the mere fact that our modern Greek
affluent society tends to prove the usefulness of such an advice more so every day, at
Interim 1 41
alarm everybody, especially those responsible for the defence of the country. It is
therefore imperative that the government, instead of offering the military service
reduction in exchange for votes should see how to make the best use of the abilities of
those drafted, in the framework of the new defence dogma, something which currently
seems to be done in a way that leaves a lot to be desired6.
This suggestion does not exactly exhaust the list of “musts” for the Greek
authorities. In cases in which such intricate problems are faced the first task that
assumes primary importance involves the thorough study of the problem phased. We
have already concentrated on this rather thoroughly in the fist chapter by establishing the
importance of human resources for the defence of Greece. The population statistics of
Greece and Turkey, moreover, designate the rapid deterioration of the performance of
the former with respect to that of the latter in this field. It is more than straightforward,
therefore, that to the extent that Greece is compelled to race Turkey in the field of
demographic developments it can stand no chances to win. The second task required,
following this diagnosis, is to consider how serious the problem is for Greece in its
confrontation with Turkey, even if the former is supported by Cyprus along the lines of
the so called “Integrated Defence Doctrine”. This is exactly what the next paper does: It
proposes a relative security measure that relies exclusively on human resource indicators
thus introducing the two dimensions of the problem: The leading importance of human
resources and the deterioration of the two allies’ position with regard to Turkey in this
respect, while, in addition, it considers the extent to which an arms race against Turkey
would affect the long-term interest of the two allies.
6
43
A Neural Network Measurement of Relative Military
Security
*The Case of Greece and Cyprus
By
Andreas S. Andreou and George A. Zombanakis
2.1 INTRODUCTION
The Greek - Cypriot Integrated Defence Space Doctrine has been regarded by the
two parties involved as a strategy aiming at facing potential offensive action by Turkey
against either of the two allies, with particular emphasis on the protection of their
national interests in the Aegean Sea theatre. This paper does not aspire to criticize the
effectiveness or otherwise of such a doctrine, since an attempt of this kind would touch
upon sensitive issues requiring the use of classified information over and above the
needs of scientific research. What one can certainly do, however, is attract the reader’s
attention to certain related issues, which may contribute to drawing a number of
conclusions regarding the usefulness or otherwise of similar strategies, in view of the
latest developments concerning the relations of the three countries involved.
These conclusions refer to the extent to which the security of the two allies in the
area is promoted given the arms race which has long been going on between Greece and
Turkey (Kollias and Makrydakis 1997). Whereas the impact of an arms race on the
economy of the countries involved in it has been extensively dealt within the literature
*
(Balfoussias and Stavrinos 1996; Ozmucur 1996; Kollias 1997), research referring to the
consequences of arms races upon the security of the sides involved leaves a great deal to
contribute on the issue. To forecast the impact of this arms race on the security of
Greece and Cyprus we resort to using artificial neural networks, with all advantages a
data driven approach may entail, given the complexity of the models employed by the
theory of alliances and the contradictory empirical results (Hartley and Sandler 1995), as
well as the limited theoretical background covering the concept of relative security in
similar cases.
The technical support concerning the structure and training of the networks used is
given in section 3, after the theoretical background, along with a description of the input
variables and a brief review of the relevant literature have been presented in section 2.
The forecasting results of the relative security factor, as well as a presentation and
analysis of various alternative scenarios concerning arms race tactics between the
countries involved are reported in section 4. Finally, section 5 sums up and concludes
the findings of this paper.
2.2 LITERATURE OVERVIEW AND THEORETICAL
BACKGROUND
The topic of arms races in its general context has been a rather popular issue, which
was thoroughly investigated in the literature (e.g. Richardson 1960; Intriligator 1982; Isard and Anderton 1985 and 1988). Concerning the specific arms - race case between
Greece and Turkey, earlier research has concluded that the pressure on the Greek
economy resulting from this arms race is determined chiefly by demographic factors
strongly favoring the Turkish side, while the estimation of input significance has
indicated that the leading determinants of such a race describe the Turkish rather than
the Greek economic and demographic environment (Andreou and Zombanakis 2000).
Having established the above framework for the arms race between Greece and Turkey,
we now proceed to investigate the extent to which its impact on the sides involved may
A Neural Network Measurement of Relative Military Security 45
hypothetical figures of a payoff matrix in the context of a game theory exercise (e.g.
Wagner 1983). Such a measure requires defining a Relative Security (RS) coefficient,
tailored to fit the environment of such a conflict involving Greece and Cyprus on one
hand and Turkey on another. Ayanian (1994) has already employed such a security
coefficient aiming at explaining exchange-rate fluctuations better than conventional
macroeconomic variables. Combining Ayanian’s reasoning on the subject together with
our earlier conclusions regarding the leading role of population developments in the
Greek-Turkish arms race, we have proceeded to determining an RS coefficient. This
coefficient is suitable to use when measuring the impact of the Greek-Turkish arms race
on the security of the two allies, namely Greece and Cyprus.
Following Ayanian (1994), we define the security of Greece and that of Cyprus in
the context of an Integrated Defence Space Doctrine scenario as follows:
SG = (1/ k) * [(FG + FC) / FTG] (1)
and
SC = (1/ k) * [(FG + FC) / FTC] (2)
where SG is the military security of Greece
SC is the military security of Cyprus
FG is total Greek defence forces
FC is total Cypriot defence forces
FTG is Turkish forces potentially directed against Greece
FTC is Turkish forces potentially directed against Cyprus
k is the probability of a conflict between the sides involved
The measure of the relative security of Cyprus with reference to Greece RSCG,
which is the quintessence of the Integrated Defence Space Doctrine between Greece and
Cyprus, is defined as the ratio of (2) over (1):
RSCG = [FTG / FTC] (3)
Turkish forces potentially directed against Greece and Cyprus can be considered as
an increasing function of the relative population growth rates between Turkey on one
hand and each of the two allies on the other. This specification is based on the
the dominance of human resources over financial resources in determining the defence
burden on the Greek economy as a result of the ongoing arms race with Turkey7. Thus,
the corresponding relationships for the two allies, Greece and Cyprus, may be stated as
follows:
G T
T
TG F exp p /p
F (4)
and
C T
T
TC F exp p /p
F (5)
where FT stands for the total of Turkish armed forces and pG, pC, pT denote the
respective population growth rates for Greece, Cyprus and Turkey. The interpretation of
(4) and (5) requires special attention due to the asymmetric effect of the variables
involved: Thus, in a purely hypothetical case which would involve a faster growth of the
Greek or Cypriot population compared to that of Turkey, one may argue that this
difference in the population rates involved may be considered as representing a potential
threat to Turkey, which would, therefore, be compelled to channel more forces to face
those of the two allies8. However, where the Turkish population exhibits a faster rate of
growth compared to that of Greece or Cyprus, which has always been the case, this will
allow Turkey to increase FT, which is the total Turkish forces, and provide for an
increase of the forces facing Greece and Cyprus, thus offsetting the effect caused due to
the reduction of the exponent.
Substituting the equivalent of FTG and FTC from (4) and (5) in (3) we come up with
the following Relative Security (RS) measure between Greece and Cyprus:
RSCG = exp[x] (6)
7
Indeed, any variable that represents or includes developments in human resources in the countries involved may be suitable. Since, however, population developments are decisive in affecting most of the human resource variables, we feel that their role must be acknowledged as leading. The use of population growth rates rather than the corresponding levels aims at stressing the dynamic character of the relative security measure proposed.
8
A Neural Network Measurement of Relative Military Security 47
where x
pG -pC
/ pT (7)Equation (6) interpreted together with (7) show how the population rates of growth
of the three countries involved are expected to affect the relative security of Cyprus with
reference to Greece, as this is measured by RSCG. More specifically, for an increase of
this index as given by (6), x at time t2 must be higher than x at an earlier period t1 (t1 and
t2 represent years in our case). In terms of (7), therefore, x1 < x2 , or:
pG(1)-pC(1)
/ pT(1) <
pG(2)-pC(2)
/ pT(2) (7a)Bearing in mind that RSCG as it is expressed by (6) and (7) measures the relative
security of Cyprus, it is evident that (7a) holds true in the following three cases:
(a) If pT(1)pT(2), holding pG and pCconstant, as shown byequations (6) and (7).
(b) If pC(1)pC(2), holding pG and pTconstant, since FTC in equation (5) will fall.
(c) If pG(1)pG(2), holding pC and pT constant, since FTG in equation (4) will rise,
meaning that Turkish forces are expected to move towards Greece and away from
Cyprus. This case underlines the importance of the Greek support in the Greek –
Cypriot alliance, in the context of which, all population growth rates not included
in one of the above cases entail a decline of the RSCG, indicating a reduction of the
relative security of Cyprus9.
(d) If all rates fluctuate, the direction of change of the RS will depend on the outcome
of equation (7a), that is, RS will rise if the second term of (7a) is greater than the
first.
It is now evident that this relative security measure can be used to provide for a
much more precise strategy payoff measure compared to the hypothetical payoffs used
in the literature, as we indicated earlier in this section. Indeed, if the percentage changes
included in the exponent of (6) are instead denoted as logarithmic first differences, then
the exponent x of the relative security measure RSCG in (7) may be expressed as follows: x = [ ln ( PG / PG(-1) ) - ln ( PC / PC(-1) ) ] / [ ln ( PT / PT(-1) ) ] (8)
where PG, PC and PT stand for the populations of Greece, Cyprus and Turkey
Denoting by g, c, and t the corresponding Greek, Cypriot and Turkish population
increases, as given in (8) above, i.e:
g = ln ( PG / PG(-1) ) (9)
c = ln ( PC / PC(-1) ) (10)
t = ln ( PT / PT(-1) ) (11)
Then, following Chiang (1984), x represents the algebraic solution of the following
equation:
c * tx - g = 0 (12)
It is evident, therefore, that (12) provides the necessary theoretical framework
within which a relative security coefficient may be developed and used to quantify the
impact of the various strategies selected by the sides involved in an arms race.
The benefits of introducing such a measure and applying it using neural networks
are clear:
(a) It provides for a means to measure the impact of an arms race on the security of
the allies involved in a much more specific way compared to the arbitrary payoffs
found in the literature so far. Using, therefore, the relative security coefficient
described in this paper, one may proceed to cardinal measurement comparisons
among various arms race scenarios, thus drawing useful conclusions on the impact
of such a race on the member states of an alliance.
(b) This Relative Security coefficient, by emphasizing the role of demographic
variables, is tailored to fit the case of specific categories of arms races, in which
human resources play a dominant role, such as the one between Greece and Turkey.
It is important to remember, however, that the application of this relative security
coefficient is not necessarily confined to cases of two - member alliances. In fact, the
number of the member countries in an alliance does not impose any constraint, as long
as one focuses on the relative security involving pairs of member countries each time,
facing a common threat.
The relative security coefficient for the Greek-Cypriot alliance thus established
represents the output of our network algorithm, using as input some of the leading
9
A Neural Network Measurement of Relative Military Security 49
determinants of the Greek-Turkish arms race (Stavrinos and Zombanakis 1998; Andreou
and Zombanakis 2000), as well as the top performing variables during preliminary input
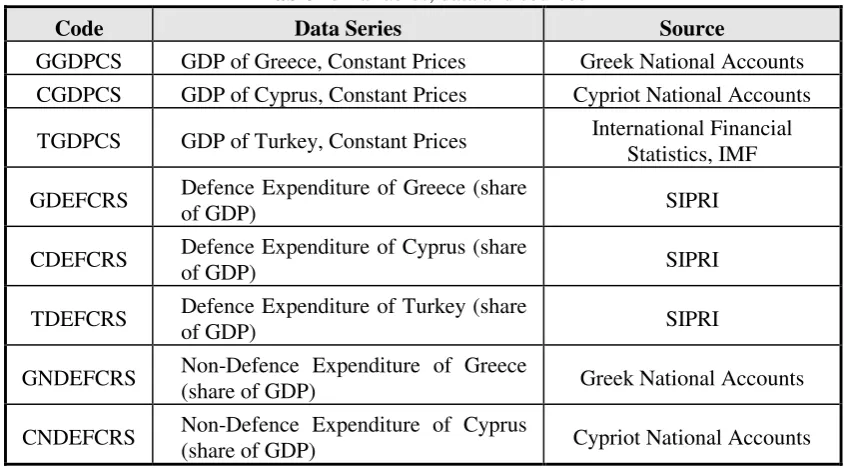
significance exercises (Table 1). The input variables thus selected are the GDP as well
as its share representing defence expenditure of the three countries involved. In addition,
the GDP share of the non-defence spending in Greece and Cyprus have been employed
in order to introduce the opportunity cost of defence and thus the dimension of the peace
[image:14.595.100.523.301.536.2]dividend in the analysis.
Table 1: Variables, data and sources
Code Data Series Source
GGDPCS GDP of Greece, Constant Prices Greek National Accounts
CGDPCS GDP of Cyprus, Constant Prices Cypriot National Accounts
TGDPCS GDP of Turkey, Constant Prices International Financial Statistics, IMF
GDEFCRS Defence Expenditure of Greece (share
of GDP) SIPRI
CDEFCRS Defence Expenditure of Cyprus (share
of GDP) SIPRI
TDEFCRS Defence Expenditure of Turkey (share
of GDP) SIPRI
GNDEFCRS Non-Defence Expenditure of Greece
(share of GDP) Greek National Accounts
CNDEFCRS Non-Defence Expenditure of Cyprus
(share of GDP) Cypriot National Accounts
2.3 TECHNICAL BACKGROUND
This section is devoted to present briefly the methodology of artificial neural
networks. By using this data driven approach in forecasting the impact of the arms race
on the security of the allies, one may avoid the complications arising due to the use of
intricate models involving non-linearities, where, for example, the empirical results are
occasionally contradictory. This approach is based on developing a “machine”
each other forming layers. A network is trained through general-purpose algorithms
based on available data. The problem is reduced to the computation of weight neuron
connections in a feed-forward network to accomplish a desired input-output mapping.
The learning phase can be viewed as a high dimensional, non-linear, system
identification problem. In a feed-forward Multi-Layer Perceptron (MLP) links from each
neuron in the kth layer are being directed to each neuron in the (k+1)th layer. Inputs from
the environment enter the first layer and outputs from the network are manifested at the
last layer (Azoff 1994; Andreou and Zombanakis 2000).
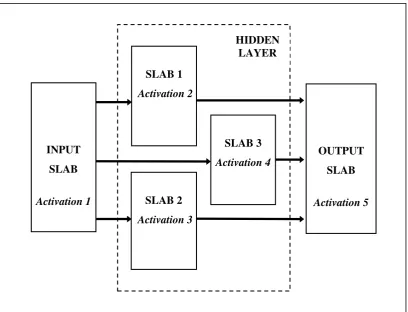
Figure 1. The Multiply Activated Multi-Layer Perceptron (MAMLP) neural network architecture
The core architecture of our networks is the feed-forward MLP described above.
Variations of this scheme were employed, such as the m-d-1 and m-d1-d2-1 topologies SLAB 3
Activation 4
SLAB 1
Activation 2
SLAB 2
Activation 3
OUTPUT
SLAB
Activation 5
INPUT
SLAB
Activation 1
[image:15.595.92.501.319.631.2]A Neural Network Measurement of Relative Military Security 51
(m input nodes, one and two hidden layers respectively and one output) and a Multiply
Activated (MA) one. The latter uses one hidden layer partitioned into three parallel
sub-layers activated by a different function (Figure 1). All networks developed have one
output neuron, which yields the next sample (predicted value) in the time sequence. The
training algorithm used is the well-known Error Back Propagation with a momentum
term (e.g. Rumelhart and McLelland 1986; Azoff 1994). The networks are trained to
learn and then predict the behaviour of the time-series presented in specific patterns of
data.
The networks used in the present paper were divided into three categories: The first
one employs MLPs with a single hidden layer (category A), the second one includes
MLPs with two successive hidden layers (category B) and the last one involves the
Multiply Activated MLP (MAMLP – category C) described above. Different topologies,
as regards the number of nodes within the hidden layers, were implemented. In addition,
variations of learning schemes were adopted, lying on different activation functions
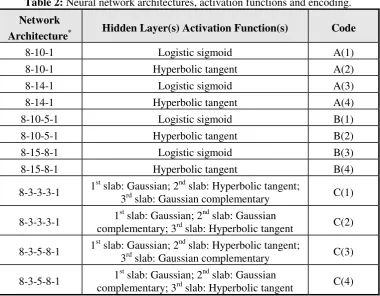
(Table 2), such as:
Logistic sigmoid : f y( ) ( 1 exp(by))1 (13) Hyperbolic tangent : f(y)(1exp(by))*(1exp(by))1 (14)
Gaussian : f(y)exp
x2 (15)Gaussian complement : f(y)1exp
x2 (16)where, y w xi i
i n
1
(17)
and xis denote the input values of a node, while wis the real valued
weights of edges incident on a node and n the number of inputs to the
node from the previous layer. b is known as the steepness of equations
(13) and (14).
Table 2: Neural network architectures, activation functions and encoding.
Network
Architecture* Hidden Layer(s) Activation Function(s) Code
8-10-1 Logistic sigmoid A(1)
8-10-1 Hyperbolic tangent A(2)
8-14-1 Logistic sigmoid A(3)
8-14-1 Hyperbolic tangent A(4)
8-10-5-1 Logistic sigmoid B(1)
8-10-5-1 Hyperbolic tangent B(2)
8-15-8-1 Logistic sigmoid B(3)
8-15-8-1 Hyperbolic tangent B(4)
8-3-3-3-1 1
st
slab: Gaussian; 2nd slab: Hyperbolic tangent;
3rd slab: Gaussian complementary C(1)
8-3-3-3-1 1
st
slab: Gaussian; 2nd slab: Gaussian
complementary; 3rd slab: Hyperbolic tangent C(2)
8-3-5-8-1 1
st
slab: Gaussian; 2nd slab: Hyperbolic tangent;
3rd slab: Gaussian complementary C(3)
8-3-5-8-1 1
st
slab: Gaussian; 2nd slab: Gaussian
complementary; 3rd slab: Hyperbolic tangent C(4) *“m
-d-n” stands for m input nodes, d nodes in the hidden layer and n output nodes.
“m-d-p-n” stands for m input nodes, d nodes in the first hidden layer, p nodes in the second hidden layer and n output nodes.
“m-d-p-k-n” stands for m input nodes, d hidden nodes in the first slab (total hidden neurons subset) of the hidden layer, p hidden nodes in the second slab, k hidden nodes in the third slab and n output nodes.
Our data series consist of 33 annual observations, 25 of which were included in the
training set and 8 in the testing set. The forecasting horizon was set to one step ahead.
Performance was evaluated using well known and widely used error measures (see next
sub-section), specifically the Normalized Root Mean Squared Error (NRMSE), the
Correlation Coefficient (CC), the Mean Relative Error (MRE), the Mean Absolute Error
(MAE) and the Mean Square Error (MSE). All these measures were evaluated on the
testing set of data, that is, a set of pattern values that did not participate during the
course of learning.
An important aspect examined in the present analysis is the determination of the
significance ordering of the variables involved, that is, the selection of the variables that
A Neural Network Measurement of Relative Military Security 53
of input sensitivity analysis, described extensively in Refenes et al. (1995) and Azoff
(1994), based on which one can sum up the absolute values of the weights fanning from
each input variable into all nodes in the successive hidden layer, thus estimating the
overall connection strength of this variable. The input variables that have the highest
connection strength can then be considered as most significant, in the sense of affecting
the course of forecasting in a more pronounced way compared to others. Presenting the
analytical technical background behind these notions is beyond the scope of this work,
since the reader may refer to the sources stated above for further information.
2.3.1 System design and implementation
The given time series x={x(t): 1 t N} is divided into two sets: a training set
xtrain={x(t): 1 t T}, and a test set xtest={x(t): T < t N}, where N is the length of the
data series. The training phase presents the xtrain set to the network repeatedly until a
certain level of convergence is achieved based on some error criterion. The learning
algorithm adjusts the weights in each repetition in order to minimize the diversion of the
desired value from the predicted one.
The number of input neurons and the selection of the variables involved have been
based on prior research on the topic, as stated in section 2, which has led to the choice of
the input set which exhibits the highest performance in terms of prediction accuracy. We
used several alternative configuration schemes, as regards the number of hidden layers
and the nodes within each layer, in order, first to achieve best performance and second,
to facilitate comparison between different network architectures (Table 2). Every input
variable is associated with one neuron in the input layer.
Determining the number of hidden layers and neurons in each layer can often be a
very difficult task and possibly one of the major factors influencing the performance of
the network. Too few neurons in a hidden layer may produce bias due to the constraint
of the function space, which results to poor performance as the network embodies a very
small portion of information presented. Too many neurons on the other hand may cause
overfitting of data on one hand and increase considerably the amount of computational
time needed for the network to process data on the other, something that will not
neurons within one hidden layer, while in some cases a two-hidden-layer scheme was
also developed in order to investigate whether performance is improved.
The number of iterations (epochs) presenting the whole pattern set during the
learning phase is also very important. We have let this number vary during our
simulations, since different network topologies, initial conditions and input sets, require
different convergence and generalization times. The number of epochs our networks
needed for convergence was 10,000, while the learning and momentum coefficients
(Rumelhart and McLelland 1986; Azoff 1994) were kept constant at the positive values
of 0.3 and 0.1 respectively. One should be very cautious though when using a large
number of epochs, as the network may overfit the data thus failing to generalize. The
problems of bias and data overfitting can be overcome by evaluating the performance of
each network using a testing set of unseen patterns (testing phase). This set does not
participate during the learning process (e.g. Azoff, 1994). If the network has actually
learned the structure of the input series rather than memorizing it then it can perform
well when the testing set is presented. Otherwise, if bias or overfitting is really the case,
performance will be extremely poor on these “new” data values. Architecture selection
is generally based on success during the testing phase, provided that the learning ability
was satisfactory.
2.3.2 Performance evaluation
The CC measures the ability of the predicted samples to follow the upward or
downward jumps of the original series. A CC value near 1 in absolute terms is
interpreted as a perfect follow up of the original series by the forecasted one. A negative
CC sign indicates that the forecasting series follows the same ups or downs of the
original series with a negative mirroring, that is with a 180o rotation about the time-axis.
When the original series moves up, the forecasting moves down at the same time-period
and vice versa.
The NRMSE indicates whether prediction is better than a simple mean forecaster. If
NRMSE=0 then predictions are perfect; NRMSE=1 indicates that prediction is no better
A Neural Network Measurement of Relative Military Security 55
MRE shows the accuracy of predictions in percentage terms expressing it in a stricter
way, since it focuses on the sample being predicted, not depending on the scale in which
the data values are expressed or on the units of measurement used. Thus, we are able to
estimate prediction error as a fraction of the actual value, this making the MRE the more
objective error measure among the three used.
MSE is reported in order to have the error condition met by the Back Propagation
algorithm, while the MAE shows the divergence between actual and predicted samples
in absolute measures. The above prediction error measures are given by the following
equations:
NRMSE(n) = RMSE(n) RMSE(n)
1
n i 1 xact(i) xact,n
n 2
(18) where,
21
act pred(i)-x (i) x
n 1
RM SE(n)
n i (19)
CCx (i) x x (i) x
x (i) x x (i) x
act act,n pred pred,n
i 1 n act act,n 2 i 1 n pred pred,n 2 i 1 n
(20)
ni 1 act act pred (i) x (i) x (i) x n 1 =
M RE (21)
n i 1 actpred(i) x (i)
x n 1 MAE (22)
n i 1 2 actpred(i) x (i))
x ( n 1
MSE (23)
n pred, n act, ,x
x the mean value of actual and predicted samples of length n
and n is the total number of patterns.
2.4 POLICY SIMULATIONS
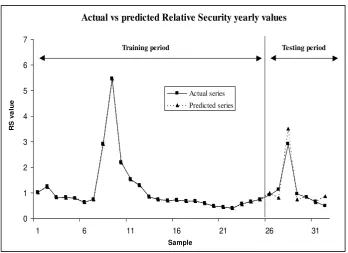
The RS coefficient seems to be quite successful in predicting the impact on the
relative security of Cyprus with reference to Greece, in the context of an arms race
between the two allies on one hand and Turkey on the other, using the input variables
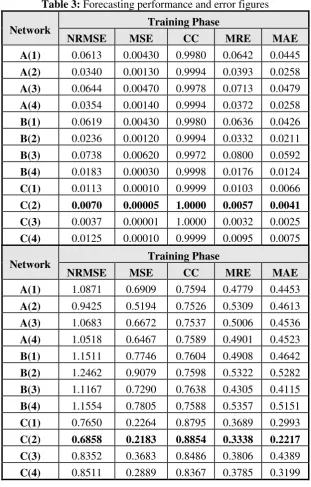
described earlier. As indicated in Table 3, the error figures during the training phase
reveal a very satisfactory performance.
In general, performance after training was very successful as indicated by the
Correlation Coefficient (CC), while the Normalized Root Mean Squared Error
(NRMSE) indicates that predictions were by far better than the simple mean forecaster
(NRMSE equal to 1). The deviation between actual and predicted samples, as indicated
on the basis of the Mean Relative Error (MRE), the Mean Absolute Error (MAE) and
the Mean Square Error (MSE) is negligible. As a result, the ability of the networks to
generalize the knowledge embodied through the learning process during the testing
phase is considerably high, as assessed on the basis of the corresponding errors for the
out-of-sample data. More specifically, the forecasting performance during the testing
phase is quite successful in CC terms, which in certain networks, like C(2), C(3) and
C(4) reached an approximate 84-89% follow up of the original series.
Regarding prediction accuracy, the MSE, MRE and MAE error indicators exhibit
low values in all networks, while the NRMSE figures indicate a slightly inferior
behavior compared to a simple mean predictor in most of the cases, with the exception
of A(2) and all networks constituting the C category. The network that yields the most
accurate predictions regarding all error measures used is C(2) (Figure 2), while the
predictions of the rest C-category networks are also quite satisfactory. Finally,
concerning the rest two network categories, only one network, namely A(2) presented a
A Neural Network Measurement of Relative Military Security 57
Table 3: Forecasting performance and error figures
Network Training Phase
NRMSE MSE CC MRE MAE
A(1) 0.0613 0.00430 0.9980 0.0642 0.0445
A(2) 0.0340 0.00130 0.9994 0.0393 0.0258
A(3) 0.0644 0.00470 0.9978 0.0713 0.0479
A(4) 0.0354 0.00140 0.9994 0.0372 0.0258
B(1) 0.0619 0.00430 0.9980 0.0636 0.0426
B(2) 0.0236 0.00120 0.9994 0.0332 0.0211
B(3) 0.0738 0.00620 0.9972 0.0800 0.0592
B(4) 0.0183 0.00030 0.9998 0.0176 0.0124
C(1) 0.0113 0.00010 0.9999 0.0103 0.0066
C(2) 0.0070 0.00005 1.0000 0.0057 0.0041
C(3) 0.0037 0.00001 1.0000 0.0032 0.0025
C(4) 0.0125 0.00010 0.9999 0.0095 0.0075
Network Training Phase
NRMSE MSE CC MRE MAE
A(1) 1.0871 0.6909 0.7594 0.4779 0.4453
A(2) 0.9425 0.5194 0.7526 0.5309 0.4613
A(3) 1.0683 0.6672 0.7537 0.5006 0.4536
A(4) 1.0518 0.6467 0.7589 0.4901 0.4523
B(1) 1.1511 0.7746 0.7604 0.4908 0.4642
B(2) 1.2462 0.9079 0.7598 0.5322 0.5282
B(3) 1.1167 0.7290 0.7638 0.4305 0.4115
B(4) 1.1554 0.7805 0.7588 0.5357 0.5151
C(1) 0.7650 0.2264 0.8795 0.3689 0.2993
C(2) 0.6858 0.2183 0.8854 0.3338 0.2217
C(3) 0.8352 0.3683 0.8486 0.3806 0.4389
C(4) 0.8511 0.2889 0.8367 0.3785 0.3199
Before we move to examining how the relative security of the two allies may be affected
in the context of alternative arms race scenarios, we turn to investigate the leading
determinants of the relative security between Cyprus and Greece, facing the possibility
Actual vs predicted Relative Security yearly values
0 1 2 3 4 5 6 7
1 6 11 16 21 26 31
Sample
R
S
v
a
lue
Actual series
Predicted series
Training period Testing period
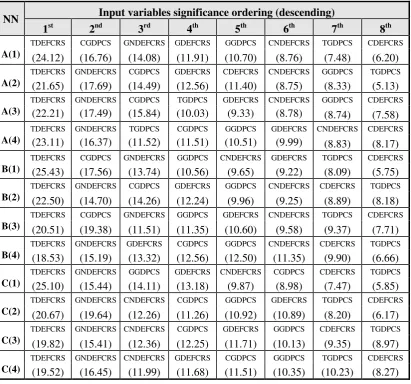
following the learning phase, with the summation of weights corresponding to each
input node (variable) presented in Table 4 in descending order.
Figure 2. Actual versus predicted values of the Relative Security (RS) coefficient using an 8-3-3-3-1 MAMLP neural network architecture.
The findings of our experiments seem to be very much in line with earlier research
on this topic (Andreou and Zombanakis 2000). Indeed, all experiments agree that the
share of defence in the GDP of Turkey is clearly the top determinant of the
Greek-Cypriot relative security. In most cases the Greek and Greek-Cypriot GDP shares of
non-defence expenditure are the next two most important determinants of the relative
security between the two allies. This finding underlines the importance of the trade-off
between defence and non-defence spending and the extent to which the sacrifice of the
[image:23.595.120.469.203.456.2]A Neural Network Measurement of Relative Military Security 59
conclusion which seems to agree with most of the literature (e.g. Hartley and Hooper
[image:24.595.108.520.196.580.2]1990; Gleditsch et al. 1996).
Table 4: Input significance analysis (percentage in parentheses)
Having identified the leading determinants of the relative security of the two allies
with reference to Turkey, we may now proceed to study the simulation results of the
networks forecasts of our relative security measure in the context of various arms race
scenarios. The forecasting horizon included in the testing phase of the networks reaches
the year 2002 and the results obtained confirm the findings of the literature on arms
races and the various strategy payoffs (e.g. Wolfson 1985). The advantage of our NN Input variables significance ordering (descending)
1st 2nd 3rd 4th 5th 6th 7th 8th
A(1)
TDEFCRS CGDPCS GNDEFCRS GDEFCRS GGDPCS CNDEFCRS TGDPCS CDEFCRS
(24.12) (16.76) (14.08) (11.91) (10.70) (8.76) (7.48) (6.20)
A(2)
TDEFCRS GNDEFCRS CGDPCS GDEFCRS CDEFCRS CNDEFCRS GGDPCS TGDPCS
(21.65) (17.69) (14.49) (12.56) (11.40) (8.75) (8.33) (5.13)
A(3) TDEFCRS (22.21) GNDEFCRS (17.49) CGDPCS (15.84) TGDPCS (10.03) GDEFCRS (9.33) CNDEFCRS (8.78)
GGDPCS CDEFCRS
(8.74) (7.58)
A(4) TDEFCRS (23.11) GNDEFCRS (16.37) TGDPCS (11.52) CGDPCS (11.51) GGDPCS (10.51) GDEFCRS (9.99)
CNDEFCRS CDEFCRS
(8.83) (8.17)
B(1)
TDEFCRS CGDPCS GNDEFCRS GGDPCS CNDEFCRS GDEFCRS TGDPCS CDEFCRS
(25.43) (17.56) (13.74) (10.56) (9.65) (9.22) (8.09) (5.75)
B(2)
TDEFCRS GNDEFCRS CGDPCS GDEFCRS GGDPCS CNDEFCRS CDEFCRS TGDPCS
(22.50) (14.70) (14.26) (12.24) (9.96) (9.25) (8.89) (8.18)
B(3)
TDEFCRS CGDPCS GNDEFCRS GGDPCS GDEFCRS CNDEFCRS TGDPCS CDEFCRS
(20.51) (19.38) (11.51) (11.35) (10.60) (9.58) (9.37) (7.71)
B(4)
TDEFCRS GNDEFCRS GDEFCRS CGDPCS GGDPCS CNDEFCRS CDEFCRS TGDPCS
(18.53) (15.19) (13.32) (12.56) (12.50) (11.35) (9.90) (6.66)
C(1)
TDEFCRS GNDEFCRS GGDPCS GDEFCRS CNDEFCRS CGDPCS CDEFCRS TGDPCS
(25.10) (15.44) (14.11) (13.18) (9.87) (8.98) (7.47) (5.85)
C(2)
TDEFCRS GNDEFCRS CNDEFCRS CGDPCS GGDPCS GDEFCRS TGDPCS CDEFCRS
(20.67) (19.64) (12.26) (11.26) (10.92) (10.89) (8.20) (6.17)
C(3)
TDEFCRS GNDEFCRS CNDEFCRS CGDPCS GDEFCRS GGDPCS CDEFCRS TGDPCS
(19.82) (15.41) (12.36) (12.25) (11.71) (10.13) (9.35) (8.97)
C(4)
TDEFCRS GNDEFCRS CNDEFCRS GDEFCRS CGDPCS GGDPCS TGDPCS CDEFCRS
method, however, lies with the possibility offered to substitute measurable payoffs for
hypothetical, arbitrary values, thus obtaining a more meaningful cardinal measurement
of the results of an arms race in the context of the Integrated Defence Space Doctrine.
The scenarios selected are the usual ones involved in a typical arms race examined
via game theory, or in the context of the “prisoner’s dilemma” (e.g. Majeski 1984). We
assign, therefore, increasing or decreasing future values to the GDP shares of defence
expenditure of Greece and Cyprus on one hand and Turkey on another10, thus referring
to the following four scenarios, with the terms “reduction” and “escalation” suggesting a
respective decrease or increase of the GDP share of defence expenditure of the country
or countries involved: (i) Both sides escalate, (ii) Greece and Cyprus escalate and
Turkey reduces, (iii) Turkey escalates and Greece and Cyprus reduce, and (iv) Both
sides reduce.
Prediction of the future course of the RS coefficient in the context of the scenarios
described above was performed using the C(2) network which achieved the highest
forecasting performance during all earlier simulations.
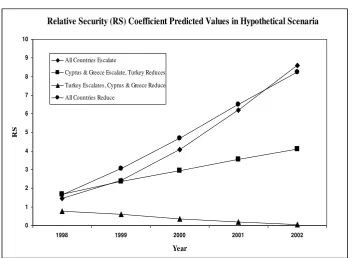
As the prediction results in Table 5 indicate, RS behaves as expected, according to
the theoretical basis stated earlier. The best outlook is provided in the case in which
both sides choose to reduce tension by contracting their defence expenditure, as this is
described by the GDP ratio of military expenditure, a finding to be expected bearing in
mind the peace dividend for both sides as described in the literature (Balfousias and
Stavrinos 1996; Ozmucur 1996). In this case, the Greece-Cyprus relative security
coefficient RS for the five years forecasted assumes an average value of 4.82, the
highest of all scenarios. The second best option, however, seems to be the case in which
both sides resort to an arms race, this providing for an average 5 year RS forecasted
value of 4.55. The advocates of the “si vis pacem para bellum”11
doctrine, however, will
be delighted to observe that the year 2002 value of the RS coefficient in this scenario is
practically equal to the corresponding value of the case in which both sides select the
10
The choice of the defence expenditure as a share of the GDP rather than the level of the military expenditure itself is widely used in the literature and aims at introducing, to a certain extent at least, the question of sustainability of the defence burden by relating it to the total output of an economy.
A Neural Network Measurement of Relative Military Security 61
reduced defence spending policy. This finding is very interesting, since it underlines the
[image:26.595.183.443.205.599.2]importance of the arms race on the security of the alliance members.
Table 5: Case scenarios predictions on the Relative Security (RS) coefficient
Scenario Year Predicted RS
All countries escalate
1998 1.4469
1999 2.4368
2000 4.0670
2001 6.1940
2002 8.5902
Cyprus and Greece escalate, Turkey reduces
1998 1.6812
1999 2.3682
2000 2.9593
2001 3.5439
2002 4.1159
Turkey Escalates, Cyprus and Greece Reduce
1998 0.7649
1999 0.6195
2000 0.3689
2001 0.1808
2002 0.0675
All countries reduce
1998 1.6406
1999 3.0701
2000 4.6800
2001 6.4924
2002 8.2233
The cases in which one of the two parties emphasizes military spending, while the
other reduces, also appear to be very interesting. Indeed, the average RS value for the
five-year period forecasted is 2.93 in the case in which Greece and Cyprus increase their
GDP share of defence expenditure, while Turkey reduces it. This conclusion is very
Relative Security (RS) Coefficient Predicted Values in Hypothetical Scenaria
0 1 2 3 4 5 6 7 8 9 10
1998 1999 2000 2001 2002
Year
RS
All Countries Escalate
Cyprus & Greece Escalate, Turkey Reduces Turkey Escalates, Cyprus & Greece Reduce All Countries Reduce
1995), as well as elementary reasoning, given that the RS reflects the relative security of
the Greek-Cypriot side.
It is also interesting to point out that the RS figures in all scenarios increase
together with the time horizon, with the exception of those derived in the fourth
scenario, namely the one in which Turkey escalates while Greece and Cyprus limit their
defence expenditure. In this case the average of the RS figures, which decline with time
up to 2002, does not exceed 0.4, a very low value for the security of the two allies, as
expected. The graphical description of the results referring to all four scenaria as
discussed above is shown in Figure 3.
Figure 3. Predicted values of the Relative Security (RS) coefficient for hypothetical scenaria, using an 8-3-3-3-1 MAMLP neural network architecture.
2.5 CONCLUSIONS
The aim of this paper has been to contribute to the cardinal measurement of an arms
[image:27.595.111.465.327.585.2]A Neural Network Measurement of Relative Military Security 63
adversary. The analysis refers to the co-operation between Greece and Cyprus in the
area of national security, something that has already been materialized in the context of
the so-called Integrated Defence Space Doctrine. Our efforts have focused on
supplementing the available literature on arms races by suggesting the introduction of a
payoff relative security coefficient, emphasizing the dominant role of human resources
in this case and measuring the impact on the military security of the two allies as a result
of an arms race against a third party, namely Turkey.
The main conclusion drawn after a variety of scenarios have been tried is that the
short and medium term relative security of Cyprus and Greece is maximized when both
sides involved in the arms race reduce their defence expenditures, while the arms race
scenario appears as a second-best choice. When it comes to the long-run, however, it is
interesting to see that the Greece-Cyprus relative security index assumes its maximum
value in the context of an arms race between Greece and Cyprus on one hand and
Turkey on the other. This finding supports the view of those who believe that despite the
peace dividend (Balfousias and Stavrinos 1996), Greece has no choice but to follow up
the ambitious 25-year Turkish armaments programme. Finally, the results of the
“Turkey escalates-Cyprus and Greece reduce” scenario are discouraging due to their
lowest relative security values and, consequently, their poor contribution to peace
promotion, something that must be taken to consideration by the one - sided
disarmament policy followers.
2.6 REFERENCES
Andreou, A.S. and Zombanakis, G.A. (2000) Financial Versus Human Resources in the
Greek-Turkish Arms Race. A Forecasting Investigation Using Artificial Neural
Networks. Defence and Peace Economics, 4, 403-426.
Ayanian R. (1994) The Real Exchange Rate Enigma: A Safe Haven Solution From the
Cold War Era. Defence and Peace Economics5, 51-65.
Azoff, E.M. (1994) Neural Network Time Series Forecasting of Financial Markets.
Balfoussias, A. and Stavrinos, V. (1996) The Greek Military Sector and Macroeconomic
Effects of Military Spending in Greece, in N.P. Gleditsch, O. Bjerkholt, A. Cappelen,
R.P.Smith and J.P. Dunne (eds.) The Peace Dividend, North Holland.
Chiang, A. (1984) Fundamental Methods of Mathematical Economics. Mc Graw-Hill,
Tokyo.
Gleditsch, N.P., Bjerkholt, O., Cappelen, A., Smith, R.P. and Dunne, J.P. (eds.) (1996)
The Peace Dividend. North Holland.
Hartley, K. and Hooper, N. (1990) The Economics of Defense, Disarmament and Peace:
An Annotated Bibliography. Aldershot & Brookfield, VT: Elgar.
Hartley, K. and Sandler, T. (1995) The Economics of Defence. Cambridge University
Press, U.K.
Intriligator, M. (1982) Research on Conflict Theory. Journal of Conflict Resolution 26, 307-327.
Isard, W. and Anderton, C.H. (1985) Arms Race Models: A Survey and Synthesis.
Conflict Management and Peace Science8, 27-98.
Isard, W. and Anderton, C.H. (1988) A Survey of Arms Race Models, in Isard W. (ed.)
Arms Races, Arms Control and Conflict Analysis, Cambridge University Press, N.Y.
Kollias, C. (1997) Defence Spending and Growth in Turkey 1954-1993: A Causal
Analysis. Defence and Peace Economics8, 189-204.
Kollias, C. and Makrydakis, S. (1997) Is There A Greek-Turkish Arms Race? Evidence
from Cointegration and Causality Tests. Defence and Peace Economics 8, 355-379.
Majeski, S.J. (1984) Arms Races as Iterated Prisoner’s Dilemma Games. Mathematical
Social Sciences7, 253-266.
Ozmucur, S. (1996) The Peace Dividend in Turkey, in N.P. Gleditsch, O. Bjerkholt, A.
Cappelen, R.P. Smith and J.P. Dunne (eds.) The Peace Dividend. North Holland.
Refenes, A.N., Kollias, C. and Zarpanis, A. (1995) External Security Determinants of
Greek Military Expenditure: An Empirical Investigation Using Neural Networks.
Defence and Peace Economics6, 27-41.
Richardson, L.F. (1960) Arms and Insecurity: A Mathematical Study of the Causes and
A Neural Network Measurement of Relative Military Security 65
Rumelhart, D.E. and McLelland, J. (1986) Parallel Distributed Processing. Cambridge,
MA, MIT Press.
Stavrinos, V.G. and Zombanakis, G.A. (1998) The Vicious Cycle of the Foreign
Military Debt. European Research Studies1(1), 5-26.
Wagner, R.H. (1983) The Theory of Games and the Problem of International
Cooperation. American Political Science Review77, 330-346.
Wolfson, M. (1985) Notes on Economic Warfare. Conflict Management and Peace