Efficiency of Pena’s P2 Distance in
Construction of Human Development
Indices
Nayak, Purusottam and Mishra, SK
North Eastern Hill University
25 May 2012
Online at
https://mpra.ub.uni-muenchen.de/39022/
P. Nayak S.K. Mishra Department of Economics
North-Eastern Hill University, Shillong (India)
Abstract
The paper is an attempt to evaluate the efficiency of Pena’s DP-2 method over a host of methods used to make composite indices. To undertake this exercise, variables and data used and methodology adopted in Human Development Report 2011 are employed along with nine other methodologies employed by other scholars. Although there is no agreed principle of judging an index to be best among alternative indices, it may be suggested that the composite index which is most informative among all other indices may be considered as the most acceptable one. The present study reveals that Pena-DP2 index and Penmax index have close similarity. Computationally, Pena’s method of construction of index is much simpler, but the interpretation of Penmax index is more straightforward. On the other hand, Maxmin index is norm-based and has a justification on Wald’s principle of decision-making. The Maxmin index also is the most egalitarian index against the Principal Component based index, which is known to be most elitist. On ‘sum of absolute correlation’ and ‘sum of squared correlation’, too, the Maxmin index is superior to other indices. It appears, therefore, that the Maxmin composite index which is obtained by maximization of minimum of correlation between the composite index and the constituent variables is a better than others. Further, if we go by the argument of Neumann and Morgenstern none of the composite indices is a cardinal measure in the strict sense of measurement.
I. Introduction
Many scholars and development agencies have made several attempts in the past to create
a broader measure of development and human well-being by combining indicators that shed light
on both means and ends of social progress. All these attempts have been made because of the
pioneering work of United Nations (1954) in which specific recommendations were made
against the use of GNP per capita as a measure of standard of living. Beginning in the mid 1960s
through the 1970s a number of studies concentrated on the construction and use of
socioeconomic indicators to measure development [Adelman and Morris, 1967; UNRISD, 1966
& 1972 and OECD, 1973 & 1976 as quoted by Stanton (2007:13); United Nations Economic and
basic needs approach became the core of the debate on development policies (Hicks and
Streeten, 1979; Streeten et al., 1981). However, no theoretical proposition emerged to define the
concept of development or social welfare in spite of all these exercises.
UNDP in 1990 came forward to publish its first Human Development Report (HDR) in
which construction of Human Development Index (HDI) was proposed. Since then many
criticisms have been raised against its construction and robustness. As a result some
improvements have been made in its construction by UNDP in its subsequent reports in 1991,
1994, 1999 and 2010 as well as by others (Cahill and Sanchez 1998; Noorbakhsh, 1998;
Prescott-Allen Robert, 2001; Chakravarty, 2003; Cummins et al., 2003; Social Watch, 2005;
Economists Intelligence Unit, 2004; Department of Economic Statistics, Sweden, 2004 as quoted
by Bandura (2008); Chatterjee, 2005; Herrero et al., 2007; Nathan et al., 2008). If we examine in
detail, none of the above mentioned proposed methods are free of criticisms. An alternative
method proposed by Pena way back in 1977, which was published in Spanish and could not
attract attention of researchers for a long time, is currently gaining a remarkable popularity for
determining weights and construction of synthetic indicators of quality of life (QoL). The
publication of Somarriba and Pena (2009) made Pena’s work accessible to the English-knowing
researchers. The Pena’s method (so called P2 Distance or DP2 method) is claimed to possess
almost all the desirable properties such as non-negativity, commutativity, triangular inequality,
existence, determination, monotony, uniqueness, transitivity, invariance to change of origin
and/or scale of the units in which the variables are defined, invariance to a change in the general
conditions and exhaustiveness and reference base, etc. It is also claimed that this indicator solves
a large number of problems such as the aggregation of variables expressed in different measures,
arbitrary weights and duplicity of information (Pena, 1977; Zarazosa, 1996; Somarriba and Pena,
2009; Montero et al., 2010; Martína and Fernández, 2011). So claimed, the synthetic indicators
constructed by Principal Component Analysis (PCA), Data Envelopment Analysis (DEA) or
other alternatives using non-Euclidean norms are deficient in one or the other desirable
properties in comparison to the Pena’s method (Mishra, 2009). Because of the deficiencies in
other available methods the work of Pena created a lot of impacts on other researchers and since
Is Pena’s method truly a superior one as compared to other methods? The present paper is
an attempt in this regard to answer this question. For this purpose, the paper has been organized
into seven sections: (I). Introduction; (II). Pena’s DP2 Method; (III). Review of Literature; (IV).
Data and Methodology; (V). Main Findings, (VI). An Assessment of Pena’s Method; and (VII).
Conclusion.
II.Pena’s DP2 Method
Although Pena’s DP2 method was published in 1977 it did not attract attention of
researchers since it was not published in a widely read language, namely, English. It came to the
notice when Somarriba and Pena (2009) published a paper to measure quality of life of the
people of the European Union by using DP2 method. In their paper, before introducing Pena’s
method, they first criticized both PCA and DEA for not being valid methods for obtaining
synthetic indicators. According to them PCA as a method does not allow making cardinal
inter-spatial and inter-temporary comparisons but only ordinal comparisons as opposed to the DEA
and DP2 methods. The weights of partial indicators lack socio-economic interpretation. The
method has a tendency to pick up the subset of highly correlated variables to make the first
component and assign marginal weights to relatively poor correlated subsets of variables.
Although DEA facilitates spatial and temporary comparisons and guarantee impartiality in the
weights but the program could assign a zero or very low weight to a specific factor. It has the
disadvantage of yielding multiple virtual solutions and the existence of restrictions causes
problems of non-feasibility. It further allows some degree of arbitrariness in the model while
identifying output and input variables. Pena’s P2 Distance which overcomes all these
deficiencies is introduced as follows:
2
, 1,...,1 1
2 1 ; 1, 2,..., ... 1
m ij
i j j
j j
d
DP R i n
where: i1, 2,...,n are cases (e.g. countries, districts, etc); mis the number of constituent
variables,X, such that xijX i; 1, 2,..., ;n j1, 2,..., ;m dij xij xj ;i1, 2,..., ;n j1, 2,..., ;m
is the reference case pertaining to min
; 1 ; ; 2 1 ,..., 1
, j
R
j j j is the coefficient of determination in the regression of xjover xj1,,xj2,...,x1.
In equation (1),
dij /j
is merely a change in the origin and the scale. Also, one may use zero as the reference ( ) point and [maxi (xij)-mini (xij)] instead of jas a scaling factor, without
any adverse effect on the formula. The real crux, however, lay in the weights
2
1 ,..., 1 ,1Rj j . It
may be noted that the first variable obtains an absolute weight of unity
2
11R . The subsequent
variable j2obtains a weight
2
1 , 21R and in general, the th
j variable obtains a weight
of
1 2
.1 ,..., 1 ,
Rj j Due to this, it is obvious that the weights assigned to a variable will depend on
its position in the order (Montero, 2010; Mishra, 2012-a), which makes DP2-based composite
(synthetic) indices indeterminate and arbitrary.
To resolve the said indeterminacy, the following iterative procedure has been suggested
(Montero, 2010):
Step-1: Initialize the weight vector, wj 1 j 1, 2,..., .m Define 0.00001, say for accuracy.
Step-2: Define ij (dij/j) j 1, 2,..., ;m i1, 2,...,n
Step-3: Obtain
1
; 1, 2,...,
m ij
i j
j j
d
DF w i n
Step-4: Compute the Karl Pearson’s coefficient of correlation r DF( ,j)between DF and
,
j
j 1, 2,...m
Step-4: Arrange | (r DF,j) | in a descending order (and re-index the associated variables, j,
accordingly.
Step-5: Compute
1
; 1, 2,..., ;
m ij
i j
j j
d
Z w i n
2, 1, 2,...,1
(1 )
j j j j
w R for j2,3,...,mand w11.
Step-6: If 2
1( )
n
i i i DF Z
then: replace DFby Z (that is, DF Z ); go to step-4. Else: stop.Alternatively, to resolve the said indeterminacy, Mishra (2012-b) used combinatorial
III.Review of Literature
To the best of our knowledge about 30 papers have been published so far citing the work
of Pena (1977) published in Spanish or the work of Somarriba and Pena (2009) published in
English or both. Using three methods of composite synthetic indicators (PCA, DEA and P2
Distance), Somarriba and Pena (2009) constructed and compared quality of life indices using
European Union data. Their findings corroborated their criticisms leveled against other methods.
Of the three methods analyzed, the authors claimed that Pena’s method was found to be the
optimal one in obtaining synthetic indicators of well-being. However, they did not clearly define
the criteria of optimality. Based on Pena’s indicator, Europe was found to display a strong
polarization between on the one hand, Nordic countries and Austria, and Eastern European and
the new accession countries, on the other. The distance between the averages of both groups was
9.71 units in relation to the reference base. The rest of the countries were between those
extremes.
Of those 30 publications, Pena’s method was applied directly for measurement of quality
of life (QoL) or social welfare in eleven publications and in other papers it was simply referred.
Probably the first work to cite Pena is Zarzosa (1996) whose paper was published in Spanish and
was not accessible to a larger number of researchers. In 2003 another paper authored by Royuela,
Suriñach and Reyes dealt with measurement of QoL following the idea of multidimensionality.
The authors applied an option based on the distance indicator approach and devised a
methodology that allowed explicitly temporal comparisons and did not depend on the attributes’
ranking (as the Ivanovic-Pena distance does) and built a scale for measuring QoL. They also
included the possibility of choosing both - the structure of the composite final measure and the
weights of each component in the structure. Juana and Jose (2007) proposed a new procedure of
obtaining a synthetic indicator (PCA-based Synthetic Poverty Index) to measure intensity of
poverty for all the countries of the European Union using data of households and individuals
from a longitudinal survey carried out by EUROSTAT for the period from 1994 to 2000. While
making a review of synthetic indicators they simply made a reference to the work of Pena
Hashimoto, Sugita and Haneda (2009), using panel data from Japan’s 47 prefectures for
the period from 1975 to 2002, measured QoL by applying Data Envelopment
Analysis/Malmquist Index (DEA/MI) and identified significant movement in the country’s
overall QoL using a ‘cumulative’ frontier shift index. They found that Japan’s QoL rose during
the so-called ‘bubble economy years’ (second half of the 1980s), and then dropped in the
succeeding ‘lost-decade’ (1990s). Besides, they identified those prefectures considered most
responsible for the shift(s) in QoL. However, they did not use DP2 method for their analysis but
only a reference was made to the same.
Although Velázquez (2009) did not use DP2 method for any analysis in his paper but
made a reference to the work of Pena while writing a descriptive paper on the current status and
new approaches to the measurement of poverty. He simply reviewed the evolution and future
perspectives of poverty analysis including concepts and measurements while paying special
attention to the studies carried out in Spain.
Using a larger number of variables and applying DP2 method García and Rodriguez
(2010) measured social welfare for the least developed countries and ranked them. The details
regarding the result could not be presented in this section because English translation of the
paper (written in Spanish) was not available.
Montero, Larraz and Chasco (2010) while proposing an alternative approach to build an
Environmental Quality Index (EQI) introduced some methodological and practical novelties.
From the point of view of the selection of variables, first they considered noise as a relevant
environmental variable and added ‘subjective’ data available at the census tracts level to the
group of ‘objective’ environmental variables for which data were only available at environmental
monitoring stations. Combination of data led to a Mixed Environmental Quality Index (MEQI)
which is more complete and adequate in a socioeconomic context. In order to build the final
synthetic index, instead of using more commonly used method of PCA, they used DP2 method
because of its so-called superiority over other methods. According to them DP2 is an iterative
procedure that weights partial indicators depending on their correlation with a global index. Its
most attractive feature is that it uses all the relevant information contained in the partial
multicollinearity). Since this method has been used to compute QoL and other social indicators
in the past by Zarzosa (1996) and Royuela et al. (2003) they proposed its use in the construction
of environmental index for its good statistical properties; i.e. multidimensionality, comparability
and comprehensibility.
Cuenca, Rodríguez and Navarro (2010 measured social welfare of fifteen countries of
Central America and the Caribbean using DP2 method on the basis of sixteen social indicators.
In their paper they vouched in favor of the synthetic indicator like DP2 having multidimensional
characteristics with a series of mathematical properties to be able to provide a good
measurement. Using DP2 method the authors concluded that despite the advances made in most
countries, there still remained notable differences in the region in the value of certain social
indicators, with very unequal progress in some areas basic to social welfare, such as illiteracy,
access to potable water, or infant malnutrition.
The State of the Art of Research on Families and Family Policies in Europe is the report
of the first Work package of the FAMILYPLATFORM funded by the European Commission 7th
Framework Programme. The work of the FAMILYPLATFORM is to chart and review the major
trends of comparative family research within the EU. The research review provides an overview
of studies on changing family structures, developmental processes, current social and economic
conditions of European families, gender and generational relations within families, and on family
policies in the EU member states from a comparative perspective. Kuronen (2010) in this regard
mentioned the work of Pena while summarizing results of eight Existential Field Reports and
two additional Expert Reports which dealt with an extensive systematic literature review on
European comparative research published since the mid-1990s using scientific and statistical
databases, reports from previous and ongoing EC funded research projects, and other relevant
publications.
González, Cárcaba and Ventura (2011a) made an attempt to quantify the relative
importance of three different geographic levels of analysis in assessing QoL of Spanish
population. They evaluated the extent to which the QoL of an average person living in a given
municipality is explained by the province and region in which the municipality is located. To do
19 variables which were weighted using Value Efficiency Analysis (VEA). Then they made a
variance decomposition of the VEA scores to assess the importance of three levels of
geopolitical administration. However they did not use DP2 method for their analysis but only a
reference to Pena’s work was made while mentioning different methods available for
measurement of QoL. Their results showed that the municipal level is the most important of
these, accounting for 52 per cent of the variance in QoL. Regions explained 38 per cent while
provinces only accounted for a moderate 10 per cent. Therefore, they concluded that political
action at the regional and municipal level had a larger impact on QoL indicators. A similar type
of study was again conducted by González, Cárcaba and Ventura (2011b) where both DEA and
VEA methods were applied to measure QoL for Spanish Municipalities but did not use DP2
method.
González, Carcaba, Ventura and Garcia (2011a) undertook a study to measure quality of
life for 235 largest Municipalities in Spain using both DEA and VEA techniques. They observed
that population ageing and economic status were closely related. They also hypothesized that as
people grow older and reach a high economic status, they buy better living conditions migrating
to municipalities near the VEA frontier. Another repetitive study was undertaken by them
(2011b) in which they measured QoL for the largest 643 Spanish municipalities using VEA with
19 indicators without any use of DP2 method.
Dominguez, Blancas, Gerrero and Gonzalez (2011; in Spanish) made a critical review of
various methods of measurement of composite indicators including that of Pena. While doing so
they identified the advantages and disadvantages associated with each of these indicators. They
also paid particular attention to the issues of reducing the subjectivity associated with synthetic
indicator, the ease of interpretation of results, operational complexity, etc. Finally they offered a
document that could be used by researchers to choose a particular indicator that best suited their
studies out of many available indicators.
Dong and Jensen (2011) using data from 2009 Phase III Agricultural Resource
Management Survey (ARMS), Hogs Production Practices and Costs and Returns Report and
applying DEA technique developed a composite food safety control indicator by aggregating
safety practices across 1198 farms from 19 States. They showed how some relevant variables
might influence farm food safety control, thus providing empirical evidence for the design of
food safety-enhancing agricultural policy measures. However, they did not adopt DP2 method
for their analysis.
Rodríguez and Salinas (2011) using DP2 method constructed an index to measure
maternal and child health in ten least developed countries of Asia which are beset by profound
social and economic inequalities and poverty. Through this index they could integrate variables
of maternal and child health that allowed territorial ordering of the LDCs in terms of these partial
indicators. They concluded the presence of strongly polarized territorial disparities in maternal
and child health care in those countries.
Tenorio and Ramos (2011) in a research paper (in Spanish) advocated construction of a
multidimensional index of QoL with seven deemed essential dimensions such as health, equality,
education, labor market conditions, economic conditions, environmental conditions, security and
transportation. Considering these dimensions, they constructed indices using PCA and DEA
techniques to show how income inequality among the major regions of Brazil was translated
effectively into disparities in the QoL.
Wolbring (2011) just referred Pena’s method while reviewing measurement of QoL, be it
for the hearing impaired or not. He presented the views of members of the World Federation of
the Deaf on potential beyond species typical abilities enabling therapeutic assistive devices (i.e.
related to hearing). Survey respondents showed support for the development and uptake of the
beyond normal hearing enabling devices. He also analyzed what guidance code of ethics of
hearing enabling professions give in regards to the beyond normal hearing enabling devices.
Mishra (2012-a) using data from human development report of UNDP (2004)
demonstrated that DP2 method of construction of a synthetic indicator is very sensitive to the
order in which the constituent variables (whose linear aggregation yields the synthetic indicator)
are arranged. Since ‘m’ number of constituent variables may be arranged in m-factorial ways,
even a moderately large ‘m’ can give rise to a very large number of synthetic indicators from
analyst has too little information as to the order in which a sizeable number of constituent
variables must be arranged so as to obtain the best representative synthetic indicator, DP2
method can give only an arbitrary synthetic indicator whose representativeness is indeterminate
and uncertain. In another paper Mishra (2012-b) drew the same conclusion but while making
analysis he used discrete global optimization method based on Particle Swarms to obtain a
heuristically optimal order in which the constituent variables could be arranged so as to yield
DP2 synthetic indicator that maximizes the minimal absolute (or squared) correlation with its
constituent variables. Similarly in another paper Mishra (2012-c) used mixed
combinatorial-cum-real particle swarm (MCCRPS) method to obtain a heuristically optimal order in which the
constituent variables could be arranged so as to yield some generalized maximum entropy
synthetic indicators that represent the constituent variables in the best information-theoretic
sense. Mishra claimed that it might help resolve the arbitrariness and indeterminacy of the DP2
method. In yet another paper, Mishra (2012-d) used MCCRPS method to obtain
entropy-maximizing DP2-based composite indices of globalization of different countries.
Assi, Lucchini and Spagnolo (2012) applied a powerful clustering procedure (the
Two-Step Cluster Analysis or BIRCH algorithm) to a set of non-monetary indicators of well-being
and QoL taken from the first four waves of the European Social Survey. By employing this
technique, they identified nine clusters of people characterized by different forms of well-being
and QoL, while preserving as much as possible the multidimensional information contained in
the preselected indicators. They also analyzed the distribution of the clusters among European
countries, finding significant differences among the groups of Nordic countries, Continental
European countries, Mediterranean European countries and Eastern European countries in the
chances of belonging to the nine forms of wellbeing and QoL previously identified. However,
they did not use Pena’s method for their analysis.
In order to determine provincial disparities in social welfare levels in Spain, Espina and
Somarriba (2012) used DP2 method to estimate provincial synthetic welfare indicator. Their
findings revealed that degree of disparity in welfare levels amongst Spanish provinces was
extremely moderate. In terms of geographical distribution, they found how provinces located in
study revealed that increased GDP undoubtedly enhanced provincial welfare in Spain but its
explanatory power regarding provincial disparities was extremely low.
Although Henning and Zarnekow (2012) did not use DP2 method for their analysis,
however, they mentioned Pena’s work as a method for construction of a synthetic indicator.
Their work presented empirical evidence from cross-sectional and panel data models that social
capital is a determinant of local government performance. To make such analysis they applied
DEA to estimate local government performance in rural communities in Poland for the years
2002-2005. Further, they calculated the Malmquist index to measure the temporal change in
government performance.
Rodríguez, Salinas and Ubiña (2012) presented a new proposal for measuring progress
towards Millennium Development Goal-6 to combat HIV, AIDS and malaria in the context of
sub-Saharan Africa. To construct the index, they used a large number of variables and adopted
DP2 method. Their index incorporated variables that permitted the countries of sub-Saharan
Africa to be ordered at territorial scale in terms of the value of the partial indicators. Results
revealed notable differences across countries of sub-Saharan Africa concerning fulfillment of the
MDG 6.
Rodríguez (2012) constructed a new composite index of child health by DP2 method
using variables defined in the Goals of the Millennium Declaration for thirty-one LDCs of Africa
grouped into 5 geographical divisions of the continent, namely, Central Africa, East Africa, West
Africa, Horn of Africa and Southern Africa. The results exhibited the existence of territorial
disparities with regard to child health in 2008.
Okulicz-Kozaryn (2012) investigated the effect of income on life satisfaction (livability
theory) in a regression framework using variables such as unemployment, marital status, age,
education and community size at the sub-national level across West European countries. Living
conditions measured by regional income was observed to increase life satisfaction beyond
personal income and national income. There existed larger life satisfaction inequality between
mattered more for life satisfaction in the poor provinces than in the rich provinces. However, he
did not use DP2 method for his analysis.
Poveda (2012) too did not use DP2 method but made reference to work of Pena while
analyzing the effectiveness of the control of violence at the level of Colombian departments
between 1993 and 2007. Instead he adopted DEA approach to draw necessary conclusions.
Findings of his study revealed that majority of departments showed improvement in their scores
of effectiveness. A second stage of the regression model revealed that departments with a higher
GDP and higher education and employment were more effective in the control of violence,
whereas departments with higher political violence, unemployment rates, unsatisfied basic needs,
a displaced population, and hectares cultivated with cocoa showed lower effectiveness in the
control of violence.
Applying DEA technique, Tsuneyoshi, Hashimoto and Haneda (2012) measured changes
in stability of nationusing panel data for 97 countries during 1981–2004. This analysis included
a unified country (Germany) and split countries (former Soviet Union, Czechoslovakia, and
Yugoslavia). Results revealed shifts in stability before/after the unification or split. The stability
gap between the most stable countries and other countries expanded after the end of the cold war,
until 2004. The stability of split countries fell typically by 50 per cent or more.
Zorondo-Rodrıguez, et al. (2012) also did not use DP2 method but conducted an
insightful study on QoL after surveying 114 individuals from Kodagu district of Karnataka in
India. According to them a method measuring QoL could be a useful one if it made a good
balance between indicators guided by theories (top-down approach) and indicators defined by
local people (bottom-up approach). Accordingly they analyzed the correspondence between HDI
as an indicator adopted by governments to assess QoL and the elements defined by local people
as important in their QoL, called by them as local means. The findings revealed that HDR did
not capture the means defined by people as indicators of QoL. Their findings suggested an
important gap between current indicators of QoL considered by the makers of public policies and
the means of QoL defined by people. The study provided insights for a set of plausible local
indicators useful to achieve a balance between top-down and bottom-up approaches for the local
The above review of literature reveals that the works of Pena (1977) and Somarriba &
Pena (2009) have gained a remarkable popularity by way of a number of citations and
application of their method for constructing composite indices, especially the quality of life
indices. Therefore, there is a need for relooking at the method proposed by Pena for its suitability
for constructing the synthetic indicators.
IV.Data and Methodology
For the purpose of the study we intend to use data of HDR of UNDP (2011). The
variables to be considered for construction of various indicators are life expectancy at birth in
years for health dimension (LEX), both mean and expected years of schooling for knowledge
dimension (EDN) and finally gross national income per capita at constant prices (2005 PPP US
$) for the dimension of standard of living (PCY). The formulae and goal posts for each variable
mentioned in the 2011 Report would be used for constructing HDI and other indices of human
development. As regards construction of Pena’s distance there would be no change in the choice
of variables but the formula of Pena as mentioned in Section II would be employed.
As it has been amply elaborated in Mishra (2012-d), composite indices as the weighted
linear aggregation of indicator variables can be constructed in a number of ways, but whenever
the weights (w) are derived intrinsically (from the data pertaining to the indicators or the
constituent variables) a criterion function is used which is optimized. Even the (equal) weights
used in the construction of HDI in 2011 report of UNDP may be interpreted as optimizing the
Hölder’s mean with a zero exponent. It may be noted that all arithmetic, geometric and harmonic
means are the Hölder’s means with exponents 1, 0 and -1 respectively. When weights are
obtained such that Minkowski’s Lp norm (p=1, 2 and ) is maximized, we obtain absolute
(norm-1), Euclidean (norm-2 or principal component) and maxmin composite indices. In general,
if Z Xw,where Z X, andware the composite index, the matrix of mconstituent variables in
ncases and weights, the norm-1 based composite indices maximize
1| ( , ) |
m
j j r Z x
, norm-2based indices maximize 2 1/ 2
1| ( , ) |
m
j j r Z x
1/ ( ) 1| ( , ) |
p
m p
j j r Z x
. It may be noted that r Z x( , j) is the Karl Pearson’s coefficient ofcorrelation between Zand xjX.
Another composite index may be obtained by maximization of (Shannon’s) entropy in the
weights,
mj1[ ln( )]bj bj Bln( )B , where 1 ( , ) ; ( , ) / , 1, 2,..., ,m
j j j
j
B
r Z x b r Z x B j m is maximized.Oftentimes it has been found that the composite indices so obtained have a very high correlation
with the norm-1 based composite indices (Mishra, 2011).
In case the composite indices are based on DP2 criterion, the weights (and, therefore, the
resulting indices) depend on the order in which the constituent variables enter into the formula.
For determinacy, therefore, one has to impose a criterion. Such a criterion could be the
magnitude of correlation coefficient of the composite index with its constituent variables (as
used by Montero, 2010) or alternatively the maximization of minimal correlation,
max[min( | ( ,r Z xj) | )]. In this paper we call it Penmax index.
Alternatively, composite indices may be derived such that they maximizeS Z( ), where
(.)
S is the relative entropy of(.). Entropy itself may be defined in a plethora of manners (see
Esteban and Morales, 1995 that discusses 23 measures of entropy). We have used three popular
measures of entropy: Shannon, Tsallis and Sharma-Mittal (Beck, 2008).
Construction of all the composite indices proposed here (except the norm-2 composite
indices) need direct optimization. In particular, some DP2-based indices require combinatorial
and mixed-real-combinatorial optimization. To accomplish this, we have used the Particle swarm
method with suitable modifications and incorporation of the Smallest Position Value (SPV)
mapping mechanism for obtaining combinatorial solutions (Tasgetiren et al., 2004; Parsopoulos
and Vrahatis, 2006; Mishra 2012-b).
In the present study we obtain 10 different composite indices of Human Development:
(1) HDI-11 (UNDP), (2) Norm-1, (3) Norm-2, (4) Entrop, (5) Maxmin, (6) Penmax, (7)
Shannon, (8) Tsallis, (9) Sharma-Mittal (Sharmit), and (10) Pena-DP2 (by Montero iteration).
for obtaining weights and the maximization of the criterion only assists into the choice of order
in which the constituent variables enter into the DP2 formula. Norm-1, Norm-2 and Maxmin are
based on maximization of a particular norm of the coefficient of correlation between the
composite index and the constituent variable. Entrop is based on maximization of entropy of the
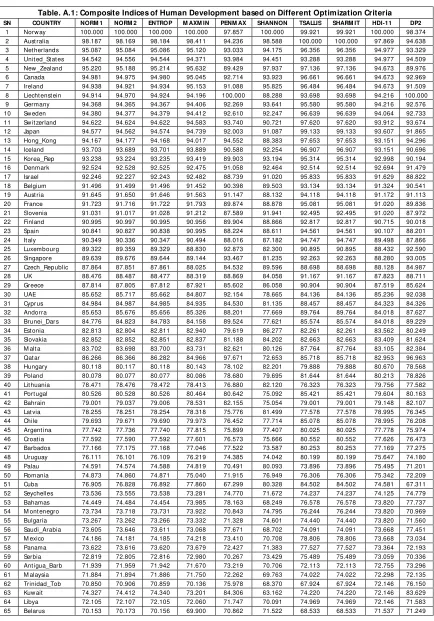
correlation itself. HDI-11 is from 2011 report of UNDP. All the ten indices are presented in
Table A.1 in the Appendix. All indices are normalized by the formula
[zi min( )] / [max( ) min( )] 100.Z Z Z
V.Main Findings
In Table-1 we present the correlation coefficients between the alternative indices of
human development and their constituent variables. It may be noted that PCY has the largest
correlation with Pena-DP2 followed by Penmax and HDI-11. All entropy-maximizing
DP2-based indices exhibit lesser correlation with PCY. On the other hand, all entropy-maximizing
DP2-based indices (except Shannon) have larger correlation with LEX. Shannon has the largest
correlation with EDN. On the criterion of SAR (sum of absolute correlation between the index
and the constituent variables) and SSR (sum of squared correlation between the index and the
constituent variables) and min(r), all DP2-based indices (except Pena-DP2) score poorly. All
entropy-maximizing DP2-based indices (except Shannon) yield almost identical composite
indices. It is also pertinent to report that all DP2-based indices have optimal order of entry of
[image:16.612.72.547.524.684.2]variables as LEX, EDN and PCY. In Pena-DP2, however, the order is PCY, EDN and LEX.
Table-1:
Correlations, Norms, Entropy M easures and Composability of Various Indices of Human Development
Index LEX EDN PCY SAR SSR M in(r) S(Z) q1 q2
HDI-11 0.90151 0.93826 0.94033 2.78010 2.57727 0.90151 - - -
Pena-DP2 0.88345 0.89245 0.97769 2.75359 2.53283 0.88345
Norm-1 0.92510 0.92657 0.93446 2.78613 2.58755 0.92510 - - -
Norm-2 0.92479 0.92642 0.93491 2.78612 2.58756 0.92479 - - -
Ent rop 0.92505 0.92655 0.93453 2.78613 2.58755 0.92505 - - -
M axmin 0.92859 0.92859 0.92859 2.78576 2.58682 0.92859 - - -
Penm ax 0.89080 0.88533 0.97758 2.75371 2.53300 0.88533 - - -
Shannon 0.87597 0.97511 0.89838 2.74946 2.52525 0.87597 0.94299 - -
Tsallis 0.97347 0.88859 0.88778 2.74984 2.52539 0.88778 0.94046 0.78121 -
In Table-2 we present correlation among the alternative composite indices of human
development. The norm-based indices (Norm-1, Norm-2, Entrop and Maxmin) are perfectly or
almost perfectly correlated. On the other hand, all entropy-maximizing DP2-based indices with
q1 different from unity are perfectly correlated. HDI-11 is more correlated with norm-based
indices than the DP2-based (except Pena-DP2) indices of human development. It appears,
therefore, that the two classes (norm-based and DP2-based) of indices highlight two different
aspects of human development. Pena-DP2, Penmax and Shannon strike a balance between the
two classes. Pena-DP2 and Penmax indices are very highly correlated.
Table-2:
Correlation M atrix among Different Types of Composite Indices of Human Development
NORM 1 NORM 2 ENTROP M AXM IN PENM AX SHANNON TSALLIS SHARM IT
NORM 1 1.00000 1.00000 1.00000 0.99987 0.98836 0.98684 0.98698 0.98698
NORM 2 1.00000 1.00000 1.00000 0.99985 0.98855 0.98678 0.98683 0.98683
ENTROP 1.00000 1.00000 1.00000 0.99986 0.98839 0.98683 0.98695 0.98695
M AXM IN 0.99987 0.99985 0.99986 1.00000 0.98581 0.98749 0.98867 0.98867
PENM AX 0.98836 0.98855 0.98839 0.98581 1.00000 0.96344 0.96236 0.96236
SHANNON 0.98684 0.98678 0.98683 0.98749 0.96344 1.00000 0.96154 0.96154
TSALLIS 0.98698 0.98683 0.98695 0.98867 0.96236 0.96154 1.00000 1.00000
SHARM IT 0.98698 0.98683 0.98695 0.98867 0.96236 0.96154 1.00000 1.00000
HDI-11 0.99784 0.99787 0.99784 0.99724 0.98894 0.99098 0.97593 0.97593
PENA-DP2 0.98832 0.98852 0.98836 0.98572 0.99976 0.96657 0.95949 0.95949
Note: We have r(Pena-DP2, HDI-11)= 0.99006
VI.An Assessment of Pena’s Method
There is no generally agreed upon ‘ideal’ against which one may judge as to which one of
the alternative indices is the best. On account of lack of sufficient reason, it may be suggested
that the composite index that is most informative among all the alternative indices may be
considered the most non-controversial and, therefore, generally acceptable. The Gini Coefficient
may be used for this purpose. Larger the Gini coefficient, larger is the information content that a
synthetic index could extract from the constituent variables. The Gini coefficient may be
obtained by the formula given below:
2
1 1
(1/ ) 1 (2 ) n n | i j |
i j
Table-3:
Gini Coefficient of the Alternative Indices of Human Development
Norm-1 Norm-2 Ent rop M axmin Penm ax Shannon Tsallis Sharmit HDI-11 Pena-DP2
0.52151 0.52126 0.52147 0.52493 0.48853 0.51500 0.51188 0.51188 0.51777 0.49419
As presented in Table-3, Penmax has the smallest Gini coefficient followed by
Pena-DP2. On the other hand, Maxmin has the largest Gini coefficient, followed by Norm-1, Entrop
and Norm-2. Z-entropy-based Pena indices (Shannon, Tsallis and Sharmit) are between the
norm-based indices and Penmax/Pena-DP2. It appears that entropy maximization tries to extract
maximum information from the constituent variables, but the Pena scheme of computing weights
pulls it down. It may be noted that Maxmin indices exploit the minimax criteria of Wald and
have edge over other criteria in the face of lack of information that may be helpful in
decision-making.
VII. Conclusion
From the present study we obtain some hints that Pena-DP2 index and Penmax index
have close similarity. Computationally, Pena-DP2 method of construction index is much simpler,
but the interpretation of Penmax index is more straightforward. On the other hand, Maxmin
index is norm-based and has a justification on Wald’s principle of decision-making. The Maxmin
index also is the most egalitarian index against the Principal Component based (Norm-2) index,
which is known to be most elitist. On SAR and SSR criteria, too, the Maxmin index is superior
to other indices. It appears, therefore, that the Maxmin composite index that is obtained by
maximization of [min( | ( ,r Z xj) | )] is a better index than others. Among the DP2-based indices,
Penmax vies with the Pena-DP2 index. It may be noted, however, that none of the composite
indices (including the Montero iteration based Pena-DP2) is a cardinal measure of human
development in the strict sense of measurement (Neumann and Morgenstern, 1953: pp. 16-24).
They can be used only for ranking the cases (countries, etc).
---
References
Adelman, I. and Morris, C. T. (1967) Society & Politics and Economic Development.Baltimore: Johns Hopkins University Press.
Assi, J., Lucchini, M. and Spagnolo, A. (2012) Mapping Patterns of Well-being and Quality of Life in Extended Europe, International Review of Economics, DOI 10.1007/s12232-012-0147-z. http://www.springerlink.com/content/m842mlt515418706/fulltext.pdf
Atkinson, A.B., Cantillon, B., Marlier, E. and and B. Nolan (2005) Taking Forward the EU Social Inclusion Process. Luxembourg Presidency of the Council of European Union.
Bandura (2008) A Survey of Composite Indices Measuring Country Performance: 2008 Update, A UNDP/ODS Working Paper, New York. http://composite-indicators.jrc.ec.europa.eu/ Document/February%202008_update.pdf
Beck, C. (2008) Generalized Information and Entropy Measures in Physics, Contemporary Physics, Vol. 50, No. 4, pp. 495–510.
Cahill, M.B. and Sanchez, N. (1998) Using Principal Components to Produce an Economic and Social Development Index: An Application to Latin America and the U.S. Paper presented in the Sixth International Atlantic Economic Conference, Boston, MA, October 8-11.
Chakravarty, S.R (2003) A Generalized Human Development Index, Review of Development Economics, Vol.7, No.1, pp. 99-104.
Chatterjee, S.K. (2005) Measurement of Human Development: An Alternative Approach.
Journal of Human Development and Capabilities, Vol.6, No.1, pp. 31-53.
Cuenca, E., Rodríguez, J.A. and Navarro, M. (2010) The Features of Development in the Pacific Countries of the African, Caribbean and Pacific Group. Social Indicators Research, Vol.99, No.3, pp. 469-485.
Cummins, R.A., Eckersley, R. Pallant, J., Van Vugt J. and Misajon, R. (2003) Developing A National Index of Subjective Wellbeing: The Australian Unity Wellbeing Index, Social Indicators Research, Vol.64, pp. 159-190.
Department of Economic Statistics (2004) Background Facts on Economic Statistics 2004:15
Comparing Welfare of Nations, Sweden: Stockholm.
http://www.scb.se/Statistik/OV/OV9999/2004A01/OV9999_2004A01_BR_X100ST0415.pdf
Dominguez, S.M., Blancas, P.F.J., Gerrero, C.F.M. and Gonzalez, L.M. (2011) A Critical Review to Construct Composite Indicators, Revista De Metodos Cuantitativos Para La Economia Y La Empresa, Vol.11, pp. 41-70.
Economists Intelligence Unit (2004) The Economist Intelligence Unit’s Quality-of-life Index,
The World in 2005. http://www.economist.com/media/pdf/QUALITY_OF_LIFE.pdf
Espina, P.Z. and Somarriba, N.A. (2012) An Assessment of Social Welfare in Spain: Territorial Analysis Using a Synthetic Welfare Indicator, Social Indicators Research. DOI 10.1007/s11205-012-0005-0 http://www.springerlink.com/content/m63m97v200810t74/fulltext.pdf
Esteban, M.D. and Morales, D. (1995) A Summary of Entropy Statistics, Kybernetika, Vol. 31, No. 4, pp. 337-346. Available at http://www.cse.msu.edu/~cse902/S03/entropy_measures.pdf (visited: 29.03.2012).
Cuenca, E. and Rodríguez, J.A. (2010) Measurement of Disparities between Indicators Associated with the Welfare in Least Developed Countries (LDCs) of Asia. Revista de Economia Mundial, Vol.25, pp. 83-108. http://redalyc.uaemex.mx/redalyc/pdf/866/86617254004.pdf
González, E., Cárcaba, A. and Ventura, J. (2011a) The Importance of the Geographic Level of Analysis in the Assessment of the Quality of Life: The Case of Spain, Social Indicators Research, Vol.102, pp. 209-228.
González, E., Cárcaba, A. and Ventura, J. (2011b) Quality of Life Ranking of Spanish Municipalities, Revista de Economía Aplicada, Vol.19, No.56, pp. 123-148.
González, E., Carcaba, A., Ventura, J., and Garcia, J. (2011a) Measuring Quality of Life in Spanish Municipalities, Local Government Studies, Vol.37, No.2, pp. 171-197.
González, E., Carcaba, A., Ventura, J., and Garcia, J. (2011b) Value Efficiency Assessment of Quality of Life in Spanish Municipalities, http://personales.ya.com/aeca/pub/on_line/ comunicaciones_xvcongresoaeca/cd/25f.pdf
Hashimoto, A., Sugita, T. and Haneda, S. (2009) Evaluating Shifts in Japan’s Quality-of-life, Socio-Economic Planning Sciences, Vol.43, No.4, pp. 263–273.
Henning, C. and Zarnekow, N. (2012) Putnam's Social Capital and Government Performance: Empirical Evidence from Rural Communities in Poland, Paper submitted to Public Choice Meeting, Florida, USA. http://www.springerlink.com/content/k4143tk635pjn1w5/fulltext.pdf
Herrero, C., Martinez, R. and Villar, A. (2007) A Multiplicative Human Development Index http://www.econ.unavarra.es/~espinosa/Site/Documentos/Herrero/MHDI_(HMV)_-_Apr07%5 B 1%5D.pdf
Hicks, N. and Streeten, P. (1979) Indicators of Development: The Search for a Basic Needs Yardstick, World Development, Vol.7, No.6, pp. 567-580.
Juana, D.D. and Jose, J.N.V. (2007) A Proposal of a Synthetic Indicator to Measure Poverty Intensity with an Application to EU-15 Countries. Working Paper Series 81. Society for the Study of Economic Inequality, ECINE, University of Alcala, Madrid: Spain.
Kuronen, M. (ed.) (2010) Research on Families and Family Policies in Europe State of the Art,
Mishra, S.K. (2012-a) A Note on the Indeterminacy and Arbitrariness of Pena’s Method of Construction of Synthetic Indicators, SSRN: http://ssrn.com/abstract=2026293
Mishra, S.K. (2012-b) A Note on Construction of Heuristically Optimal Pena’s Synthetic
Indicators by the Particle Swarm Method of Global Optimization. SSRN:
http://papers.ssrn.com/sol3/papers.cfm?abstract_id=2028395
Mishra S.K. (2012-c) A Maximum Entropy Perspective of Pena’s Synthetic Indicators. http://mpra.ub.uni-muenchen.de/37797
Mishra, S.K. (2012-d) A Comparative Study of Trends in Globalization Using Different Synthetic Indicators. SSRN: [doi: 10.2139/ssrn.2038127].
Mishra, S.K. (2011) A Comparative Study of Various Inclusive Indices and the Index Constructed by the Principal Component Analysis", IUP Journal of Computational Mathematics, Vol. 4, No. 2, pp. 7-26.
Mishra, S.K. (2009) On Construction of Robust Composite Indices by Linear Aggregation,
ICFAI University Journal of Computational Mathematics, Vol.2, No.3, pp. 24-44.
Montero, J.M., Chasco, C. & Larraz, B. (2010) Building An Environmental Quality Index for A Big City: A Spatial Interpolation Approach Combined with A Distance Indicator, Journal of Geographical Systems,Vol.12, No.4, pp.435-459.
Morris, D. Morris (1979) Measuring the Condition of the World’s Poor: The Physical Quality of Life Index, Elmsford, NY: Pergamon Press (for the Overseas Development Council).
Nathan, H.S.K, Mishra, S. and Reddy, B.S. (2008) An Alternative Approach to Measure HDI. http://www.igidr.ac.in/pdf/publication/WP-2008-001.pdf
Neumann, J. von and Morgenstern, O. (1953) Theory of Games and Economic Behavior. London: OUP.
Noorbakhsh, F. (1998) A Modified Human Development Index, World Development, Vol.26, No.3, pp. 517-528.
Okulicz-Kozaryn, A. (2012) Income and Well-being across European Provinces, Social Indicators Research, Vol.106, No.2, pp. 371-392.
Organization for Economic Cooperation and Development (OECD) (1976) Measuring Social Well-Being: A Progress Report on the Development of Social Indicators. Paris: France.
Parsopoulos, K.E. and Vrahatis, M.N. (2006) Studying the Performance of Unified Particle Swarm Optimization on the Single Machine Total Weighted Tardiness Problem. In: Sattar, A., Kang , B.H. (eds) AI 2006, LNAI 4304, Springer-Verlag: pp. 1027–1031.
Poveda, A.C. (2012) Estimating Effectiveness of the Control of Violence and Socioeconomic Development in Colombia: An Application of Dynamic Data Envelopment Analysis and Data Panel Approach, Social Indicators Research, Vol.105, No.3, pp. 343–366.
Prescott-Allen, Robert (2001) The Wellbeing of Nations: A Country-by-Country Index of Quality of Life and the Environment. Washington: Island Press.
Rodríguez, J.A. (2012) An Index of Child Health in the Least Developed Countries (LDCs) of Africa, Social Indicators Research, Vol.105, No.1, pp. 309-322.
Rodríguez, J.A. (2008) The Features of Development in Central America and the Caribbean. http://www.usc.es/congresos/xix-eep/descargas/papers/3E2.pdf
Rodríguez, J.A. and Salinas, J A. (2011). An Index of Maternal and Child Health in the Least Developed Countries of Asia, Gaceta Sanitaria. [in press]; doi:10.1016/j.gaceta.2011.05.021.
Rodríguez, J.A., Salinas, J.A. and Ubiña, A.J. (2012). An Index of Progress towards the MDG 6 in Sub-Saharan Africa: Combat HIV, AIDS and Malaria, Child Indicators Research, Vol.5, No.1, pp. 199-213.
Royuela, V., Suriñach, J. and Reyes, M. (2003) Measuring Quality of Life in Small Areas over Different Periods of Time, Social Indicators Research, Vol.64, No.1, pp. 51–74.
Somarriba, N. and Pena, B. (2009) Synthetic Indicators of Quality of Life in Europe, Social Indicators Research, Vol.94, No.1, pp. 115–133.
Social Watch (2005) Annual Report 2005: Roars and Whispers Gender and Poverty: Promises vs. Action. Montevideo, pp. 143-145.
Stanton, E.A. (2007) The Human Development Index: A History. Working Paper Series No.127, Political Economy Research Institute. Amherst: University of Massachusetts.
Streeten, P., Burki, J. S., Haq, M.U., Hicks, N. and Stewart, F. (1981) First Things First: Meeting Basic Human Needs in Developing Countries, New York: OUP.
Tasgetiren, F., Sevkli, M., Lian, Y.C., and Gencyilmaz, G. (2004) Particle Swarm Optimization Algorithm for Single Machine Weighted Tardiness Problem, Proceedings of IEEE Congress on Evolutionary Computation. pp. 1412–1419.
Tenorio, J.G.R. and Ramos, F. de S. (2011) Uma Análise Multidimensional Da Qualidade De Vida Nos Estados Brasileiros - 2001-2007. http://187.110.227.7/content/aplicacao/eventos/forum bnb2011/docs/2011_uma_analise_mult.pdf
Tsuneyoshi, T., Hashimoto, A. and Haneda, S. (2012) Quantitative Evaluation of Nation Stability, Journal of Policy Modeling, Vol.34, No.1, pp.132-154.
United Nations Development Programme (1990, 1991, 1994, 1999, 2004, 2010) Human Development Report 2003. New York: OUP.
United Nations Economic and Social Council (1975) Developing Countries and Level of Development. New York: United Nations.
Velázquez, J.J.N. (2009) Estado actual y nuevas aproximaciones a la medición de la pobreza
Estudios De Economia Aplicada, Vol.27, No.2, pp.325-344.
Wolbring, G. (2011) Hearing beyond the Normal Enabled by Therapeutic Devices: The Role of the Recipient and the Hearing Profession, Neuroethics, DOI 10.1007/s12152-011-9120-x Springerlink.com. http://www.springerlink.com/content/d33v333q2768155x/fulltext.pdf
Zarzosa, P. (1996) Aproximacio´n a la medicio´n del bienestar social. Secretariado de Publicaciones e intercambio científico, Universidad de Valladolid.
Zorondo-Rodrıguez, F., Gomez-Baggethun, E., Demps, K., Ariza-Montobbio, P., Claude Garcıa, C. and Reyes-Garcıa, V. (2012) What Defines Quality of Life? The Gap between Public Policies and Locally Defined Indicators among Residents of Kodagu, Karnataka (India), Social Indicators Research. DOI: 10.1007/s11205-012-9993-z http://www.springerlink.com/content/ k4143tk635pjn1w5/fulltext.pdf
Appendices
Table. A.1: Composite Indices of Human Development based on Different Optimization Criteria
SN COUNTRY NORM 1 NORM 2 ENTROP M AXM IN PENM AX SHANNON TSALLIS SHARM IT HDI-11 DP2
135 Ghana 38.782 38.760 38.778 39.061 36.025 42.079 42.582 42.582 38.813 35.843 136 Equat _Guinea 36.714 36.883 36.742 34.587 54.436 34.080 22.893 22.893 38.204 54.934 137 Congo 34.523 34.570 34.531 33.944 38.897 37.290 31.001 31.001 37.595 39.115 138 Lao_Pe-D_Rep 37.866 37.864 37.865 37.861 38.853 33.730 44.970 44.970 36.225 37.839 139 Cambodia 35.362 35.362 35.362 35.354 35.509 36.192 38.654 38.654 36.073 35.123 140 Sw aziland 31.293 31.389 31.308 30.106 39.711 38.828 18.538 18.538 35.921 40.895 141 Bhut an 39.243 39.295 39.252 38.538 46.903 29.369 44.266 44.266 35.921 45.581 142 Solom on_Islan 36.226 36.212 36.224 36.363 36.086 32.317 44.588 44.588 34.094 34.988 143 Kenya 31.773 31.779 31.774 31.708 31.290 38.829 29.838 29.838 33.942 31.715 144 Sao-Tom_Pr ¡ 34.170 34.168 34.170 34.168 34.791 32.494 39.588 39.588 33.942 34.047 145 Pakist an 34.561 34.581 34.565 34.278 38.092 29.420 40.076 40.076 33.181 37.065 146 Bangladesh 35.567 35.544 35.563 35.830 34.533 31.257 45.452 45.452 32.572 33.292 147 Timor_Lest e 32.226 32.269 32.233 31.659 38.045 27.451 34.947 34.947 31.811 37.209 148 Angola 26.839 26.950 26.857 25.446 38.394 27.598 17.803 17.803 30.441 38.731 149 M yanmar 31.405 31.400 31.404 31.437 32.112 28.389 38.382 38.382 29.985 31.123 150 Camer oon 25.519 25.573 25.528 24.847 30.256 31.952 18.797 18.797 29.833 30.880 151 M adagascar 32.704 32.650 32.695 33.356 27.566 34.005 41.963 41.963 29.528 26.787 152 Tanzania 25.782 25.796 25.785 25.603 27.357 28.124 26.889 26.889 27.397 27.129 153 Papua_N_Guin 28.538 28.572 28.544 28.076 33.800 23.020 33.059 33.059 27.397 32.740 154 Yem en 29.887 29.911 29.892 29.546 34.516 22.379 37.032 37.032 26.788 33.135 155 Senegal 25.558 25.588 25.564 25.169 29.513 24.350 27.530 27.530 26.332 28.938 156 Nigeria 22.394 22.458 22.404 21.587 28.857 26.031 16.839 16.839 26.332 29.141 157 Nepal 30.487 30.460 30.482 30.789 29.574 24.866 42.107 42.107 26.180 28.053 158 Hait i 26.146 26.141 26.146 26.193 26.468 25.533 31.686 31.686 25.571 25.709 159 M aurit ania 24.427 24.467 24.434 23.907 29.600 22.525 25.807 25.807 25.419 28.996 160 Lesot ho 20.203 20.265 20.214 19.438 25.527 28.413 11.552 11.552 24.962 26.363 161 Uganda 21.494 21.516 21.497 21.221 23.365 26.916 19.572 19.572 24.353 23.539 162 Togo 21.957 21.949 21.955 22.052 20.942 27.002 23.735 23.735 22.679 20.843 163 Com oros 22.883 22.886 22.883 22.819 24.379 21.387 28.299 28.299 22.374 23.519 164 Zambia 17.397 17.446 17.405 16.782 21.750 24.946 10.848 10.848 21.918 22.360 165 Djibout i 22.026 22.089 22.037 21.201 30.274 17.311 22.942 22.942 21.918 29.446 166 Rw anda 19.445 19.472 19.450 19.108 22.521 21.765 19.498 19.498 21.766 22.289 167 Benin 19.785 19.821 19.791 19.311 24.349 20.000 20.210 20.210 21.461 23.926 168 Gambia 20.154 20.182 20.158 19.789 24.234 18.308 23.205 23.205 20.396 23.473 169 Sudan 21.797 21.841 21.805 21.205 28.703 14.384 27.050 27.050 18.569 27.364 170 C“ t e_d_Ivoir e 16.211 16.260 16.219 15.569 22.617 14.497 16.834 16.834 17.352 21.984 171 M alaw i 15.433 15.446 15.435 15.274 16.866 19.617 15.931 15.931 17.352 16.708 172 Afghanist an 12.662 12.735 12.674 11.750 20.368 16.096 6.901 6.901 17.047 20.538 173 Zimbabw e 14.913 14.884 14.907 15.292 10.369 27.760 13.607 13.607 13.699 11.025 174 Et hiopia 14.303 14.328 14.308 13.964 18.958 9.531 20.290 20.290 11.720 17.696 175 M ali 9.167 9.230 9.178 8.366 16.860 8.771 7.698 7.698 11.111 16.393 176 Guinea_Bissau 6.585 6.653 6.596 5.734 14.191 9.213 2.412 2.412 10.198 14.120 177 Erit rea 13.670 13.651 13.666 13.863 13.748 10.625 23.300 23.300 9.589 12.374 178 Guinea 8.734 8.776 8.742 8.191 14.634 7.006 10.761 10.761 8.828 13.819 179 Cent r _Afr_Rp 5.095 5.143 5.103 4.487 10.536 9.095 2.205 2.205 8.676 10.472 180 Sierra_Leone 4.069 4.125 4.079 3.375 10.321 7.678 0.744 0.744 7.610 10.243 181 Burki_Faso 9.400 9.456 9.410 8.662 17.493 4.316 12.218 12.218 6.849 16.363 182 Liberia 11.662 11.611 11.654 12.311 6.225 18.649 17.718 17.718 6.545 5.877 183 Chad 4.775 4.853 4.788 3.784 14.328 3.426 2.576 2.576 6.393 13.782 184 M ozambique 3.946 4.010 3.957 3.114 12.182 3.000 2.960 2.960 5.479 11.578 185 Burundi 3.891 3.894 3.891 3.839 4.505 10.039 4.570 4.570 4.566 4.361 186 Niger 3.675 3.710 3.681 3.203 9.571 0.000 8.228 8.228 1.370 8.372 187 Congo_Dem_Rp 0.000 0.000 0.000 0.000 0.000 7.925 0.000 0.000 0.000 0.000