http://dx.doi.org/10.4236/msa.2014.511077
How to cite this paper: Sakaino, M., Hatake, S., Sun, Y., Morimoto, F. and Kirimoto, K. (2014) LiB Electrode Ageing Observed from PVdF Binder. Materials Sciences and Applications, 5, 767-782. http://dx.doi.org/10.4236/msa.2014.511077
LiB Electrode Ageing Observed from
PVdF Binder
Masamichi Sakaino1,2*, Syogo Hatake1, Yong Sun1, Fumio Morimoto3, Kenta Kirimoto4 1Department of Applied Science for Integrated System Engineering, Kyushu Institute of Technology,
Kitakyushu, Japan
2Department of Vehicle Production Engineering, Nissan Motor Co., Ltd., Atsugi-City, Japan 3Research Institute, Kyushu Kyoritsu University, Kitakyushu, Japan
4Department of Electrical and Electronic Engineering, Kitakyushu National College of Technology,
Kitakyushu, Japan
Email: *[email protected]
Received 23 June 2014; revised 25 July 2014; accepted 4 August 2014
Copyright © 2014 by authors and Scientific Research Publishing Inc.
This work is licensed under the Creative Commons Attribution International License (CC BY). http://creativecommons.org/licenses/by/4.0/
Abstract
Ageing behaviors of the positive electrode of lithium ion battery are characterized by measuring mechanical properties of the electrode reeds, such as resonance frequency and internal friction, as a function of temperature. In the measurements of the electrode reeds with a sandwich structure of active material film and current collector of Al foil, two thermally-activated relaxation proces- ses can be observed on the polyvinylidene difluoride binder in the active material film. Namely, a surface-related relaxation at ~150 K and a relaxation corresponding to the β-phase transition at ~240 K in the polymer binder can be observed at high signal/noise ratio. The resonance frequency decreases and the internal friction increases after charge/discharge cycling. The changes in acti-vation energies of the relaxation processes also indicate that the measurement of mechanical properties of the positive electrode is an effective method for characterizing ageing behaviors of the positive electrode as a whole.
Keywords
LiB Positive Electrode, Mechanical Properties, Internal Friction, Resonance Frequency
1. Introduction
pacity fading or increase of resistance is mandatory to keep a long lifetime of LiBs. However, it is difficult to give an exhaustive picture of all the ageing reactions because of a large variety of LiBs. There are two types of ageing situation, charge/discharge cycling (cycling ageing) and storage (calendar ageing) [5]. The former ageing results in the effects in volume variations and concentration gradients, while the latter ageing results in the reac-tions of the active electrode materials [3] [6].
Recently, some studies have been focused on ageing effects on the cathode materials because the materials affect significantly performance parameters and lifetime of LiBs [7] [8]. The changes in the cathode due to the ageing processes are recognized as: (a) ageing of active materials, (b) degradations of binder and conducting agents, (c) corrosion of current collector, (d) oxidation of electrolyte composition and film formation on the sur-face of active materials, and (e) interaction of ageing products with negative electrode. These effects do not oc-cur separately and therefore cannot be analyzed independently each other. In general, the ageing processes of the cathode materials can originate from changes in structure and chemical decomposition as well as film formation at the interface between active materials and electrolyte [9] [10].
Electrochemical impedance spectroscopy has been employed as a fast, non-destructive and reliable technique to elucidate ageing behaviors of LiB cells [11] [12]. In particular, it is effective in characterizing reaction pro- cesses occurring in the cells, such as changes of particle-to-particle contacting resistance [13] and charge- trans-fer resistance [14] [15] in active materials and electrolyte as well as through their interface. It is also sensitive to increase in cell impedance due to various reactions such as oxidation of conductive particles, binder decomposi-tion, loss of contact to conductive particles, micro-cracking, structural disordering in active materials, and film formation on the surface of active materials. However, this technique cannot analyze directly the ageing beha-viors of electrode or electrolyte, separately. Moreover, structural and compositional analysis techniques such as x-ray diffraction, Raman scattering, IR absorption and TEM observation are used to local characterization of electrodes or separator, but cannot characterize the ageing behaviors of positive or negative electrode as a whole. In order to realize a balance between lifetimes of electrode, electrolyte and separator, it is necessary to provide a technique to separately measure ageing behaviors of these LiB parts.
Since elastic properties of materials depend sensitively on internal friction due to lattice distortion and its thermodynamic behaviors, elastic parameters can be anticipated as effective indicators for characterization of ageing behaviors of the LiB electrode as a whole.
In this study, we measured both resonance frequency and internal friction of positive-electrode reed samples as a function of temperature. The results indicated that the charge/discharge cycling causes decrease in the re-sonance frequency and increase in the internal friction of the positive electrode. Our results also indicated that mechanical parameter is an effective measure to characterize the ageing behaviors of the LiB electrodes. Finally, we discussed mechanisms of the internal friction on the positive electrode through comparison with the mea-surement results of the negative electrode.
2. Experimental
Two kinds of LiBs, not filled and filled with electrolyte, having dimensions of 230 × 200 × 7 mm3, were ob-tained from Nissan Motor Co., Ltd. The positive electrode of the un-filled battery was cut to the reed samples having dimensions of 5.0 × 0.19 × l mm3, where l is 27, 29, 31 and 39 mm. Here, the length l corresponds to re-sonance frequency of 75.8, 64.7, 53.3 and 38.6 Hz at room temperature, respectively. On the other hand, the filled battery was prepared by charge/discharge for 150 cycles at 20% depth-of-discharge (DOD), and was open- ed in inert gas atmosphere. The positive electrode of the filled battery after the charge/discharge cycling was al-so cut to the reed samples with the same dimensions.
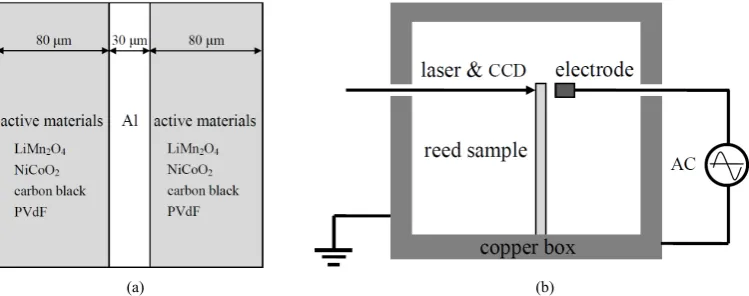
The positive electrode of the battery is composed of a sandwich structure of the active material film and cur-rent collector (aluminum foil) as shown in Figure 1(a). The active material was coated on either side of the Al foil at the same thickness of 80 μm where the Al foil is 30 μm thick. The active material film is composed of li-thium manganese oxide (LiMn2O4) and lithium nickel cobalt aluminum oxide (LiNiCoAlO2). These active ma-terials were coated using polyvinylidene difluoride (PVdF, -CH2CF2-) binder. In order to enhance conductivity of the PVdF binder, carbon black particles (3 - 500 nm in diameter) and graphite nanoplatelets were added into the binder as conducting fillers. Prior to the measurements of elastic parameters, the positive electrodes were characterized by compositional and structural analyses using transmission scanning electron microscope (TEM, JEM ARM200F) and electron probe micro analyzer (FE-EPMA, JXA-8530F).
sample was set in a copper box equipped in a vacuum chamber under the residual gas pressure below 3 × 10⁻⁴ Pa. One end of the reed sample was fixed on the copper box to assure an electrical ground lead and to control its temperature. An alternating voltage with variable frequency and amplitude was applied to the free end of the sample to vibrate it at its resonance frequency.
The displacement of the free end of the reed sample during free decay vibration was measured using a la-ser/CCD camera system with 10 nm accuracy as a function of time. Temperature of the sample set in the copper box was changed from 100 K to 400 K with a rate of 0.2 Kmin−1 and in a stepwise with 5.0 K step.
The amplitude A of the free end of the sample during the free decay vibration decreases exponentially with time t, A A exp( t)= 0 −α due to an internal friction in the sample. Here, α is the decay constant. Internal fric-tion Q−1 is determined as Q−1=α πf where f is the resonance frequency of the reed sample.
3. Results and Discussion
3.1. Experimental ResultsFigure 2 shows the element mapping results on the surface of the active materials. The mapping patterns for Co and Ni elements are same, suggesting the Co and Ni elements form a compound. The mapping pattern of Mn appears to be reversed from that of Co or Ni. This result suggests that Mn forms another compound avoiding Co and Ni. Also, the overlap in the mapping patterns of O with that of Mn, Co and Ni suggests the existence of manganese and cobalt/nickel oxides in the active materials. The mapping patterns of C and F elements are dif-ferent from that of Mn, Co and Ni. F may come from the PVdF binder and C from both the PVdF and the carbon black in the binder.
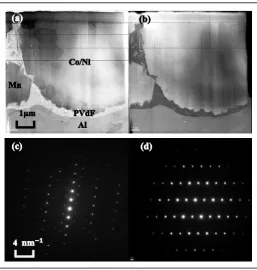
The results of TEM observation and electron beam diffraction of the active materials of the positive electrode are shown in Figure 3. TEM images in both bright field and dark field mode are shown in Figure 3(a) and Fig-ure 3(b). There are four types of areas in the images, Mn, Co/Ni, PVdF and Al areas. It is confirmed in the TEM observation that the PVdF binder was filled into the space between Mn and Co/Ni particles and Al foil. A large number of hollow voids with large surface area are observed in the PVdF binder area as seen in Figure 3(a) and Figure 3(b). The electron beam diffraction patterns from the Mn and Co/Ni areas are shown in Figure 3(c) and Figure 3(d). The Mn and Co/Ni particles are confirmed to have crystallographic structures of LiMn2O4 and Li-NiCoAlO2 based on these electron beam diffraction patterns.
The element distributions on the area in Figure 3, mapped by energy dispersive x-ray spectroscopy (EDX) are shown in Figure 4. The result of element mapping using EDX indicates that the particles of manganese oxide as well as cobalt/nickel oxide are coated by the PVdF binder and are deposited on the surface of the Al foil. The results for the element distribution in the positive electrode are consistent to that measured by EPMA as shown in Figure 2.
We also confirmed the presence of lithium atom in the active material by electron energy loss spectroscopy (EELS) on selected area electron diffraction (SAED) mode, and the result obtained is shown in Figure 5. The lithium atom is detected at the LiMn2O4 area only.
[image:3.595.127.502.546.694.2]
(a) (b)
Figure 2. Element mappings on the surface of the active materials of the positive electrode.
Figure 3. EM images: (a) in bright field mode, (b) in dark field mode as well as electron beam diffraction patterns, (c) in Mn area, and (d) in Co/Ni area at the active materials/Al foil interface of the positive elec-trode.
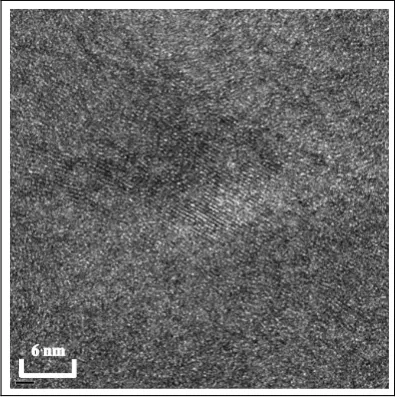
High-resolution transmission electron microscopy (HRTEM) image of the PVdF binder is shown in Figure 6. The carbon black crystals can be observed in the PVdF binder, and a graphite-like crystal particle with spacing of 0.335 nm can be seen around the center area in the figure.
[image:4.595.184.442.322.593.2]Figure 4. Element mappings at the active materials/Al foil interface by using EDX spectroscopy.
Figure 5. EELS spectrum on selected area electron diffraction mode in the manganese oxide area at the active materials/Al foil interface of the positive electrode.
[image:5.595.214.412.497.696.2]The resonance frequencies of the positive-electrode reed samples with lengths of 27, 29, 31 and 39 mm are plotted as a function of temperature in Figure 7. The resonance frequency decreases with increasing temperature. A sharp decrease of the frequencies appears at ~150 K and ~240 K for all reed samples. In general, the sharp decrease in the temperature-dependent resonance frequency results in a peak on the temperature-dependent in-ternal friction.
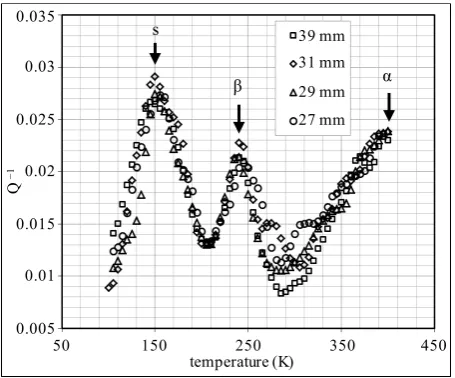
[image:6.595.197.430.254.445.2]The internal frictions of the positive electrode samples are plotted in Figure 8 as a function of temperature. The internal friction Q−1 changes strongly with temperature in the range of 100 - 400 K. At high temperature side, the increase in Q−1 may be related to a α-relaxation process occurring in the PVdF binder at 413 K [16]. Two Q−1 peaks at low temperature side at ~150 K and ~240 K correspond to sharp decreases in the tempera-ture-dependent resonance frequencies of the samples. The peaks are symmetric and sharp. It may be due to a surface-related relaxation (s-relaxation) process for the peak at ~150 K as well as a β-relaxation process in the PVdF binder for the peak at ~240 K, respectively [17]. These relaxations are thermally activated processes be-cause the internal friction peaks shift to higher temperatures with increasing resonance frequency.
Figure 7. Resonance frequencies of the positive-electrode reed samples with lengths of 27, 29, 31 and 39 mm as a function of temperature.
Figure 8. Internal frictions of the positive-electrode reed sam-ples with lengths of 27, 29, 31 and 39 mm as a function of temperature.
120
100
80
60
40
20
50 150 250 350 450 temperature (K)
fr
eq
uen
cy
(H
z)
39 mm 31 mm 29 mm 27 mm
0.035
0.03
0.025
0.02
0.015
0.01
0.005
50 150 250 350 450 temperature (K)
39 mm 31 mm 29 mm 27 mm
Q
−1
α β
[image:6.595.201.429.495.684.2]To obtain the physical parameters of these thermally activated processes we tried to explain the internal fric-tion by means of the Debye model. The contribufric-tion of a relaxafric-tion process to the internal fricfric-tion is given by
(
)
1 2 2
Q− =ϕωτ 1+ω τ , where φ is a constant corresponding to the relaxation strength that not depends on tem-perature, f =ω 2π the resonance frequency of the reed sample and τ the relaxation time of the thermally ac-tivated process. Here, the τ generally follows an Arrhenius law, 1 1
(
)
0 exp E kTa
τ− =τ− − where
0
τ is a con-stant and Ea the activation energy of the thermally activated process. When the resonance frequency of the reed sample is equal to τ−1, ωτ =1, through changing temperature, the internal friction Q−1 becomes maxi-mum. The Arrhenius plots of the relaxation rate, τ−1, for two thermally activated processes at ~150 K and ~240 K are shown in Figure 9 as a function of inverse temperature. We obtain two activation energies of 208 meV for the process at ~240 K and 104 meV for the process at ~150 K from slopes of the Arrhenius plots in this figure. The results are consistent with the symmetry of two Q−1 peaks in Figure 8 that these processes result from simple Debye relaxation with single Ea and τ.
The internal friction of the positive electrode would be occurred in the LiMn2O4 and LiNiCoAlO2 microcrys-tals, the PVdF binder, the carbon black and the Al foil. In order to clarify the origins of the internal friction, it is significant to characterize the effects of charge/discharge process on the internal friction. We have measured the internal friction of the positive electrode after the charge/discharge of 150 cycles. The charge/discharge cycling, the voltage profile is shown in Figure 10. The charging was carried out at a constant current (CC) of 3 A, 2 A, 1 A and 0.5 A, respectively, for a limit cell voltage of 4.15 V and a maximum charging time of 3.5 hr, as marked by “C” ranges in the figure. On the other hand, the discharging was executed through a resistance of 1.1 Ω at room temperature for 20% DOD, corresponding to a minimum cell voltage of 3.84 V, as marked by “D” ranges in the figure.
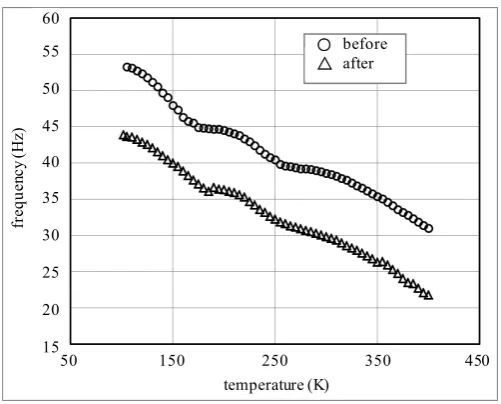
After the charge/discharge of 150 cycles the battery was opened and its positive electrode was washed using N-methyl-2-pyrrolidone solvent in an inert gas atmosphere in order to make the electrolyte clean. The positive electrode which had been washed was cut to reed samples with lengths of 27, 29, 31 and 39 mm, respectively. The resonance frequencies of the reed sample with length of 39 mm before and after the charge/discharge cycl-ing are plotted in Figure 11 as a function of temperature. The resonance frequency decreases with increasing temperature, and drops markedly at temperatures of ~150 K and ~240 K. For example, the resonance frequen-cies decrease 17% at 150 K and 19% at 240 K after the charge/discharge cycling.
[image:7.595.200.426.495.682.2]The internal friction of the positive electrode is also sensitive to the charge/discharge process. The internal frictions of the reed sample with length of 39 mm before and after the charge/discharge of 150 cycles are shown in Figure 12 as a function of temperature. Changes on the internal friction after the charge/discharge cycling, the increase of the Q−1 value and the shift of the Q−1 peaks, can be seen in the figure. Intensities of the Q−1 peaks at 150 K and 240 K increase 40% and 16% after the charge/discharge cycling. The increase in the Q−1
Figure 10. The voltage profile of the LiB cell during the charge/ discharge cycling. The “C” range corresponds to the charge process at constant currents of 3, 2, 1 and 0.5 A, and the “D” range corres-ponds to the discharge process for decreasing cell voltage from
4.15 V to 3.84 V through a resistance of 1.1 Ω.
Figure 11. Resonance frequencies of the positive-electrode reed samples with length of 39 mm before and after the charge/discharge of 150 cycles as a function of temperature.
value indicates that stronger Debye absorption appears in the sample after the charge/discharge cycling. It sug-gests a structure change occurred on molecular level of the active materials. It is well known that the active ma-terials absorb the electrolyte at first charge/discharge cycle of the LiB.
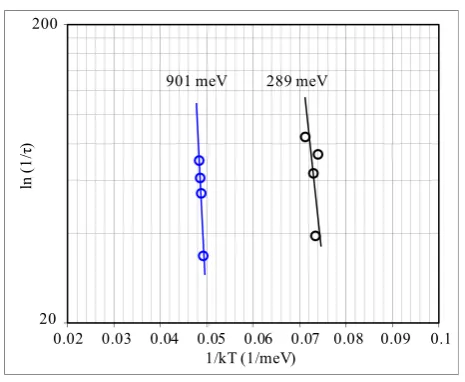
Shifts of the Q−1 peaks suggest a change in activation energies of the thermally activated relaxation processes. The Arrhenius plots of the relaxation rate, τ−1, for the processes at ~150 K and ~240 K after the charge/discharge of 150 cycles are shown in Figure 13 as a function of inverse temperature. The activation energy is 901 meV for the process at ~240 K and 289 meV for the process at ~150 K, respectively. These acti-vation energies become large after the charge/discharge cycling.
60 55
50
45
40
35
30
25
20
15
50 150 250 350 450 temperature (K)
fr
eq
uen
cy
(H
z)
before after
[image:8.595.188.439.376.578.2]Figure 12. Internal frictions of the positive-electrode reed sam-ples with length of 39 mm before and after the charge/discharge of 150 cycles as a function of temperature.
Figure 13. Arrhenius plots of the relaxation rate, τ−1, for two relaxation processes occurred at ~150 K and ~240 K in the reed samples after the charge/discharge cycling. Activation energies of 289 meV and 901 meV are observed in the processes at ~150 K and ~240 K.
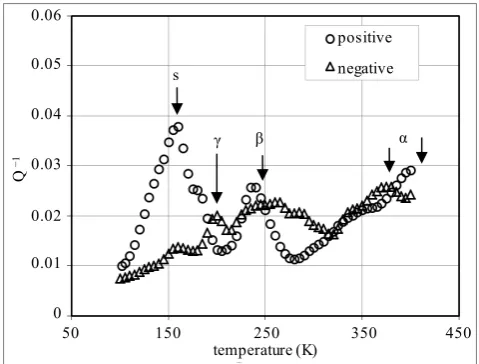
In order to clarify these relaxation processes which may occur in the active materials, the binder or the Al foil, the internal friction of the negative electrode of the same cell after the charge/discharge of 150 cycles was also measured. The negative electrode has a sandwich structure of the active material film and current collector (copper foil), similar to that of the positive electrode as shown in Figure 1(a). Their thicknesses were 60μm for the active material films and 20 μm for the Cu foil. The active materials of the negative electrode are mainly composed of graphite nanoplatelets, carbon black and PVdF binder. The internal frictions of both negative and positive electrode reeds with the same length of 31 mm are plotted in Figure 14 as a function of temperature. Unlike the results of the positive electrode samples, two new peaks at ~190 K and ~370 K are also observed in addition to the peaks at ~150 K and ~240 K. The peak at ~150 K is weak and that at ~240 K is broad. It may be related to a γ-relaxation process for the peak at ~190 K and an α-relaxation process at ~370 K in the PVdF binder.
We are now in the position to discuss the ageing behaviors and the mechanisms of internal friction appeared in the positive electrode on the basis of the above experimental results.
0.04
0.035
0.03
0.025
0.02
0.015
0.01
0.005
50 150 250 350 450 temperature (K)
Q
−1
before after
○ △
200
0.02 0.03 0.04 0.05 0.06 0.07 0.08 0.09 0.1 1/kT (1/meV)
ln
(1
/
τ
)
20
[image:9.595.197.430.317.508.2]Figure 14. Internal frictions of both positive and negative elec-trode reeds with length of 31 mm as a function of temperature.
3.2. Discussion on Internal Frictions
3.2.1. Internal Friction on PVdF Binder
The PVdF is a semi-crystalline polymer having α, β, γ and δ crystalline phases [18]-[22]. The α crystalline structure contains trans-gauche-trans-gauche chain conformations in a monoclinic lattice, and is obtained by melt crystallization at temperatures below 433 K [23] [24]. The β crystalline phase can be produced through mechanically drawing αphase materials [23] [25]. The γ crystalline phase can be obtained by crystallization from melt at high pressure or by crystallization from certain solutions such as dimethylacetamide (CH3CON(CH3)2) and dimethylsufoxide ((CH3)2SO) [18] [21] [25]. The δ crystalline phase is usually obtained by poling α phase under high electric field [18] [19].
In internal friction studies of the PVdF polymer, a number of relaxation processes corresponding to the α, β
and γ phase transitions have been observed. The α-relaxation is related to thermal movement processes of the PVdF molecule near the crystalline melting point [16] [17] [26]-[32]. The β-relaxation is due to micro-Brownian motions of the linear chain segments close to the glass transition temperature [16] [17] [28]-[32]. Also, the
γ-relaxation is due to thermally-activated local molecular oscillations in the amorphous phase of the PVdF po-lymer [16] [17] [28].
Low-temperature internal friction on the PVdF polymer has been reported by Callens et al. [16] [17]. They measured the internal friction spectra of the PVdF polymer by using a torsion pendulum technique. Nine peaks were observed on temperature-dependent internal friction spectra of the PVdF polymer at temperatures of ~140, ~190, ~220, ~236, ~270, ~330, ~350, ~386 and ~413 K in the range of 70 - 450 K. The internal friction process at ~140 K corresponds to a surface-related relaxation process because its relaxation rate is several times as large for PVdF fiber sample as for PVdF bulk sample. In this study as observed in Figure 3, there are a large number of hollow voids in the PVdF binder. The surface of the hollow voids and the interface between the active mate-rials and the PVdF binder can be involved to the surface-related relaxation process. The peak at ~190 K corres-ponds to the γ-relaxation which can be understood in terms of the cranckshaft or local-mode molecular models based upon molecular motions of small, isolated chain segments within amorphous phase in the PVdF material. The peak at ~220 K is due to the β-relaxation, a glass transition corresponding to the amorphous phase, relating to changes in the chain length distribution. The peaks at ~236 and ~270 K are also related to the β-relaxation and can be explained through the hindering of the molecular motion by the crystallites. The β-related relaxations in the temperature range from 220 K to 320 K depend on vibration mode (longitudinal or shear), molecular struc-tures (molecular weight, molecular weight distribution) and crystallinity [26]. The upper glass transitions, cor-responding to the β-relaxations in the amorphous-crystalline interphase, appear in the temperature range of 300 - 330 K. Other relaxations above 330 K are related to the α-relaxation processes corresponding to the phase- melting phenomena. The position of the melting temperature of each crystalline phase of the PVdF polymer has been studied [33]. We also must point out that the melting of γ-conformation occurs at temperatures higher than
50 150 250 350 450 temperature (K)
0.06
0.05
0.04
0.03
0.02
0.01
0
Q
−1
positive negative s
α β
that of the α and β-conformation. Therefore, the PVdF polymer presents several internal friction peaks linked to the presence of several conformations and crystallites of different sizes on the melting.
As shown in Figure 8 and Figure 14, there are different temperature dependences of the internal friction on the PVdF binders of both positive and negative electrodes. These results indicate that there are different mole-cular structures, the concentration of the amorphous phase as well as the hollow voids in the PVdF binders of the positive and negative electrodes.
3.2.2. Internal Friction on LiMn2O4 Microcrystal
LiMn2O4 has spinel crystal structure with cubic symmetry at temperatures above 300 K [34] [35]. Below this temperature it becomes orthorhombic. This phase transition at room temperature has been demonstrated by sev-eral measurement methods such as differential scanning calorimetry (DSC) [36], electric resistance [36], infra-red spectroscopy (IR) [37], and x-ray [38] and neutron [39] diffractions. The inelastic spectroscopy studies on the Young’s modulus and the elastic energy loss function also showed that the cubic/orthorhombic transition of a sintered porous poly-crystalized LiMn2O4 sample, corresponding to a charge (Mn3+ and Mn4+) ordering varia-tion, can be detected in the temperature range of 290 - 305 K [40]. A thermally-activated relaxation peak cen-tered at 100 K has also been observed by means of inelastic spectroscopy [41]. This relaxation process can be ascribed to the stress-induced charge jump from Mn3+ to Mn4+.
Inelastic behaviors of the polycrystalline LiMn2O4 sample synthesized by a solid-state reaction have been characterized using a vibrating-reed technique [42]. A phase transition due to an ordering of Mn3+ and Mn4+ ions were observed at a temperature of 290 K. In general, the elastic behaviors of the LiMn2O4 materials depend strongly on crystal structure, volumes of amorphous phase and defects. Therefore, the internal friction peak is always asymmetric and much broad over a wide temperature range, 100 - 200 K [42].
The active materials of the positive electrode used in this study are composed of the LiMn2O4 and LiCoNiAlO2, carbon black, graphite nanoplatelets and the PVdF polymer. Hardness of the LiMn2O4 crystal and the PVdF po-lymer is 11 GPa and 0.15 GPa, respectively [43] [44]. Under the same stress during vibration of the reed sample, the strain appeared in the PVdF polymer is much larger than that in the LiMn2O4 crystal, carbon black and gra-phite nanoplatelets. Therefore, the internal friction can be observed in the PVDF polymer more easily due to larger strain [45].
The nature of internal friction revealed in this study are not match to the results reported about the LiMn2O4 crystal, we can conclude that the internal friction peaks at ~150, ~240 and ~410 K are related to the PVdF po-lymer.
3.2.3. Internal Friction on Graphite and Diamond-Like Carbon
Temperature dependence of the internal friction of bulk graphite material has been measured in the temperature range of 150 - 680 K [46]. Two internal friction peaks were observed at 385 and 620 K and their backgrounds has small temperature dependence only. The peak at 385 K is proved to originate from the sweeping motion of in-plane dislocations and is a relaxation-type peak. Other peak at 620 K is a transformation peak, resulting from the transformation of asphalt which is used as binder in preparation of bulk graphite.
Temperature dependences of the internal friction of nanocrystalline diamond-like carbon films in the range of 0.4 - 300 K showed that there is a peak at approximately 1.7 K and the internal friction increases monotonically with increasing temperature to 300 K [47]. The internal friction of amorphous diamond-like carbon films has also been measured at temperatures between 0.3 K and 300 K [48]. The internal friction increases with increas-ing temperature but no any peaks were observed in this temperature range despite the ratio of sp3 to sp2 compo-nent in the films was changed in a wide range.
3.2.4. Internal Friction on Complex of Carbon with PVdF Binder
Internal friction properties of a PVdF-graphite nanoplatelet composite have been reported [49]. The graphite nanoplatelets with average thickness of 50 nm and diameter of 10 μm were introduced to the PVdF polymer in various concentrations. The β-relaxation process appeared in the PVdF polymer at ~240 K was observed in the temperature range of 260 - 310 K, and no any other relaxation related to the graphite nanoplatelet was detected. The β-relaxation in the composite is a thermally activated process with activation energy of 2.56 eV.
nucleation agent during crystallization and slightly increase the crystallinity of PVdF/MWCNT bulk films. In addition to the β-relaxation of the PVdF polymer at ~233 K, the internal friction peaks related to the MWCNTs were not observed at temperatures from 170 K to 300 K. The transition temperature of the β-phase in the nano-composites does not change with MWCNT concentration.
In Section 3.2.3, we have discussed the internal friction of carbon-related materials such as graphite, and the nanocrystalline and amorphous diamond-like carbon. Not internal friction peaks on these carbon related mate-rials in the temperature range of 100 - 300 K have been reported. Therefore, we can conclude based on the above results that the internal friction peaks at ~150, ~240 and ~413 K as shown in Figure 8, Figure 12 and Figure 14 are due to relaxation processes occurred in the PVdF binder in the positive electrode.
3.2.5. Internal Friction on Al Metal and Its Alloys
The internal frictions of pure Al metal and its alloys in wide temperature range have been reported by several groups [51]-[58]. Mechanisms of the internal friction in Al metal and its alloys are complex, depending of com-position and physical condition such as structural deformation and annealing history. In the temperature range of 100 - 400 K, the internal friction of Al metal may be mainly due to movement of point defects [54] [56], the in-teraction between dislocation with point defect [51] and impurity [55]. Therefore, the internal friction on the Al foil of the LiB in this study does not change after the charge/discharge cycling. Also, the internal friction on the Al foil is smaller than that from the active materials because the 30 μm Al foil is much thinner than that of the active materials, 160 μm. Therefore, we can conclude that the internal friction peaks at ~150 K and ~240 K as shown in Figure 8, Figure 12 and Figure 14 do not origin from the Al current detector of the positive electrode.
3.3. Ageing Behaviors of the Positive Electrode
The results in Figure 11and Figure 12show that the resonance frequency decreases 17% and 19% and the Q−1 value increases 40% and 16% at temperatures of 150 and 240 K after the charge/discharge of 150 cycles. Cor-responding to the relaxation processes at ~150 and ~240 K, the activation energy increases 333% for the s-relaxation and 178% for the β-relaxation process, respectively. We have also measured the resistivity of the active materials of the positive electrode before and after the charge/discharge cycling. They are 650 Ωcm and 7.8 × 10⁴ Ωcm before and after the cycling, namely, the resistivity of the active material of the positive electrode increases about 120 times after the cycling. One can notice from the above results that mechanical parameters of the resonance frequency and the internal friction as well as the activation energies of the internal friction relaxa-tion processes are significant as valid parameters for characterizing the ageing behaviors of the positive elec-trode. The change in the activation energy due to the charge/discharge cycling may be related to a deposition of electrochemical reaction products on the surface of the active materials, which increase the contacting resistance between the active material particles coated by the PVdF binder. The changes in both structure and density of the PVdF polymer as well as the introduction of the impurities from the electrolyte and the active materials dur-ing the charge/discharge cycldur-ing also make difficult to the crystallization or the phase transition of the PVdF polymer. These effects appeared during the charge/discharge cycling increase the activation energy of the inter-nal friction processes in the positive electrode.
4. Conclusions
behaviors of positive electrode of the LiBs.
The mechanical parameters can be anticipated as effective indicators for characterizing ageing behaviors of the LiB electrode as a whole. By using this measurement technique, it becomes possible to enhance the cost-performance of the LiBs by matching each life times of positive and negative electrodes, separator and electrolyte. In addition, we must point out that there is not significant change on the capacity of the LiB after the charge/discharge of 150 cycles. This fact suggests that the increase of the internal fraction does not link directly to the decrease in the capacity of the LiB.
Acknowledgements
We are grateful to Professor Akira Namiki for fruitful discussions and valuable comments. The authors would also like to thank Mr. Jun Umemoto, Mr. Yusuke Hattori, Mr. Shyuji Yasuda and Mr. Shingo Furuta, Depart-ment of Applied Science for Integrated System Engineering, Kyushu Institute of Technology, for their help to get experimental data. This work is also partially supported by project No. 15-B01, Program of Research for the Promotion of Technological Seeds, Japan Science and Technology Agency (JST), as well as partially by Grant-in-Aid for Exploratory Research No: 23651115, Japan Society for the Promotion of Science (JSPS).
References
[1] Scrosati, B. and Garche, J. (2010) Lithium Batteries: Status, Prospects and Future. Journal of Power Sources, 195,
2419-2430. http://dx.doi.org/10.1016/j.jpowsour.2009.11.048
[2] Broussely, M., Biensan, Ph., Bonhomme, F., Blanchard, Ph., Herreyre, S., Nechev, K. and Staniewicz, R.J. (2005)
Main Aging Mechanisms in Li Ion Batteries. Journal of Power Sources, 146, 90-96.
http://dx.doi.org/10.1016/j.jpowsour.2005.03.172
[3] Barre, A., Deguilhem, B., Grolleau, S., Gerard, M., Suard, F. and Riu, D. (2005) A Review on Lithium-Ion Battery
Ageing Mechanisms and Estimations for Automotive Applications. Journal of Power Sources, 241, 680-689.
http://dx.doi.org/10.1016/j.jpowsour.2013.05.040
[4] Vetter, J., Novak, P., Wagner, M.R., Veit, C., Moller, K.C., Besenhard, J.O., Winter, M., Mehrens, M.W., Vogler, C.
and Hammouche, A. (2005) Ageing Mechanisms in Lithium-Ion Batteries. Journal of Power Sources, 147, 269-281.
http://dx.doi.org/10.1016/j.jpowsour.2005.01.006
[5] Meissner, E. and Richter, G. (2005) The Challenge to The Automotive Battery Industry: The Battery Has to Become an
Increasingly Integrated Component within The Vehicle Electric Power System. Journal of Power Sources, 144, 438-
460. http://dx.doi.org/10.1016/j.jpowsour.2004.10.031
[6] Sarre, G., Blanchard, P. and Broussely, M. (2004) Aging of Lithium-Ion Batteries. Journal of Power Sources, 127, 65-
71. http://dx.doi.org/10.1016/j.jpowsour.2003.09.008
[7] Spotnitz, R. (2003) Simulation of Capacity Fade in Lithium-Ion Batteries. Journal of Power Sources, 113, 72-80.
http://dx.doi.org/10.1016/S0378-7753(02)00490-1
[8] Arora, P., White, R.E. and Doyle, M. (1998) Capacity Fade Mechanisms and Side Reactions in Lithium-Ion Batteries.
Journal of the Electrochemical Society, 145, 3647-3667. http://dx.doi.org/10.1149/1.1838857
[9] Broussely, M., Herreyre, S., Biensan, P., Kasztejna, P., Nechev, K. and Staniewicz, R.J. (2001) Aging Mechanism in
Li Ion Cells and Calendar Life Predictions. Journal of Power Sources, 97-98, 13-21.
http://dx.doi.org/10.1016/S0378-7753(01)00722-4
[10] Markosky, B., Rodkin, A., Cohen, Y.S., Palchik, O., Levi, E., Aurbach, D., Kim, H.J. and Schmidt, M. (2003) The
Study of Capacity Fading Processes of Li-Ion Batteries: Major Factors That Play a Role. Journal of Power Sources, 119-121, 504-510. http://dx.doi.org/10.1016/S0378-7753(03)00274-X
[11] Raijmakersa, L.H.J., Danilova, D.L., van Lammerenb, J.P.M., Lammersb, M.J.G. and Notten, P.H.L. (2014) Sensorless
Battery Temperature Measurements Based on Electrochemical Impedance Spectroscopy.Journal of Power Sources,
247, 539-544. http://dx.doi.org/10.1016/j.jpowsour.2013.09.005
[12] Troltzsch, U., Kanoun, O. and Trankler, H.R. (2006) Characterizing Aging Effects of Lithium Ion Batteries by
Imped-ance Spectroscopy. Electrochimica Acta, 51, 1664-1672. http://dx.doi.org/10.1016/j.electacta.2005.02.148
[13] Song, J.Y., Lee, H.H., Wang, Y.Y. and Wan, C.C. (2002) Two- and Three-Electrode Impedance Spectroscopy of Lithium-
Ion Batteries. Journal of Power Sources, 111, 255-267. http://dx.doi.org/10.1016/S0378-7753(02)00310-5
[14] Levi, M.D., Salitra, G., Markovsky, B., Teller, H., Aurbach, D., Heider, U. and Heider, L. (1999) Solid-State
Electro-chemical Kinetics of Li-Ion Intercalation into Li1−xCoO2: Simultaneous Application of Electroanalytical Techniques
[15] Rodrigues, S., Munichandraiah, N. and Shukla, A.K. (1999) AC Impedance and State-of-Charge Analysis of a Sealed
Lithium-Ion Rechargeable Battery. Journal of Solid State Electrochemistry, 3, 397-405.
http://dx.doi.org/10.1007/s100080050173
[16] Callens, A., Batist, R.D. and Eersels, L. (1976) Relaxational Behaviour of Polyvinylidene Fluoride. Il Nuovo Cimento
B, 33, 434-446.
[17] Callens, A., Eersels, L. and Batist, R.D. (1978) Low Temperature Internal Friction on γ-Irradiated Polyvinylidene
Flu-oride (PVDF).Journal of Materials Science, 13, 1887-1900.
[18] Gregorio, J.R. and Capitao, R.C. (2000) Morphology and Phase Transition of High Melt Temperature Crystallized
Poly(vinylidene fluoride).Journal of Materials Science, 35, 299-306. http://dx.doi.org/10.1023/A:1004737000016
[19] Kim, B.S., Lee, J.Y. and Porter, R.S. (1998) The Crystalline Phase Transformation of Poly(vinylidene fluoride)/
Poly(vinyl fluoride) Blend Films. Polymer Engineering Science, 38, 1359-1365. http://dx.doi.org/10.1002/pen.10306
[20] Samara, G.A. (1992) Pressure Dependence of the β Molecular Relaxation Process and Dielectric Properties of
Polyvi-nylidene Fluoride.Journal of Polymer Science Part B: Polymer Physics, 30, 669-679.
http://dx.doi.org/10.1002/polb.1992.090300703
[21] Sajkiewicz, P. (1999) Crystallization Behaviour of Poly(vinylidene fluoride). European Polymer Journal, 35, 1581-
1590. http://dx.doi.org/10.1016/S0014-3057(98)00242-0
[22] Hsu, T.C. and Geil, P.H. (1989) Deformation and Transformation Mechanisms of Poly(vinylidene fluoride) (PVF2).
Journal of Materials Science, 24, 1219-1232. http://dx.doi.org/10.1007/BF02397050
[23] Gregorio, J.R. and Ueno, E.M. (1999) Effect of Crystalline Phase, Orientation and Temperature on the Dielectric
Properties of Poly(vinylidene fluoride) (PVDF). Journal of Materials Science, 34, 4489-4500.
http://dx.doi.org/10.1023/A:1004689205706
[24] Sajkiewicz, P. (1994) Effects of an Electrostatic Field on Crystallization of Poly(vinylidene fluoride). Journal of
Po-lymer Science Part B: PoPo-lymer Physics, 32, 313-323. http://dx.doi.org/10.1002/polb.1994.090320213
[25] Sajkiewicz, P., Wasiak, A. and Goclowski, Z. (1999) Phase Transitions during Stretching of Poly(vinylidene fluoride).
European Polymer Journal, 35, 423-429. http://dx.doi.org/10.1016/S0014-3057(98)00136-0
[26] Guney, H.Y. (2005) Elastic Properties and Mechanical Relaxation Behaviors of PVDF (Poly(vinylidene fluoride)) at
Temperatures between −20˚C and 100˚C and at 2 MHz Ultrasonic Frequency. Journal of Polymer Science Part B:
Po-lymer Physics, 43, 2862-2873. http://dx.doi.org/10.1002/polb.20591
[27] Vinogradov, A.M. and Holloway, F. (2000) Dynamic Mechanical Testing of the Creep and Relaxation Properties of
Polyvinylidene Fluoride. Polymer Testing, 19, 131-142. http://dx.doi.org/10.1016/S0142-9418(98)00079-8
[28] Linares, A. and Acosta, J.L. (1996) Dynamic Mechanical Properties of Binary and Ternary Blends Based on PVDF.
Polymer Bulletin, 36, 241-247. http://dx.doi.org/10.1007/BF00294913
[29] Mohajir, B.E. and Heymans, N. (2001) Changes in Structural and Mechanical Behavior of PVDF with Processing and
Thermomechanical Treatments. 1. Change in Structure. Polymer, 42, 5661-5667.
http://dx.doi.org/10.1016/S0032-3861(01)00064-7
[30] Sencadas, V., Mendez, S.L., Serra, R.S., Balado, A.A. and Ribelles, J.L.G. (2012) Relaxation Dynamics of Poly(viny-
lidene fluoride) Studied by Dynamical Mechanical Measurements and Dielectric Spectroscopy. The European Physical
Journal E, 35, 41. http://dx.doi.org/10.1140/epje/i2012-12041-x
[31] Mano, J.F., Sencadas, V., Costa, A.M. and Lanceros-Mendez, S. (2004) Dynamic Mechanical Analysis and Creep
Be-haviour of β-PVDF Films. Materials Science and Engineering: A, 370, 336-340.
http://dx.doi.org/10.1016/j.msea.2002.12.002
[32] Ozkazanc, E., Guney, H.Y., Oskay, T. and Tarcan, E. (2008) The Effect of Uniaxial Orientation on the Dielectric
Re-laxation Behavior of α-PVDF. Journal of Applied Polymer Science, 109, 3878-3886.
http://dx.doi.org/10.1002/app.28617
[33] Gregorio, R. and Cestari Jr., M. (1994) Effect of Crystallization Temperature on the Crystalline Phase Content and
Morphology of Poly(vinylidene fluoride). Journal of Polymer Science Part B: Polymer Physics, 32, 859-870.
http://dx.doi.org/10.1002/polb.1994.090320509
[34] Rodriguez-Carvajal, J., Rousse, G., Masquelier, C. and Hervieu, M. (1998) Electronic Crystallization in a Lithium
Battery Material: Columnar Ordering of Electrons and Holes in the Spinel LiMn2O4. Physical Review Letters, 81,
4660-4663. http://dx.doi.org/10.1103/PhysRevLett.81.4660
[35] Yamada, A. and Tanaka, M. (1995) Jahn-Teller Structural Phase Transition around 280 K in LiMn2O4. Materials
Re-search Bulletin, 30, 715-721. http://dx.doi.org/10.1016/0025-5408(95)00048-8
[36] Rousse, G., Masquelier, C., Rodriguez-Carvajal, J. and Hervieu, M. (1999) Cubic ↔ Orthorhombic Transition in the
[37] Paolone, A., Roy, P., Rousse, G., Masquelier, C. and Rodriguez-Carvajal, J. (1999) Infrared Spectroscopy
Investiga-tion of the Charge Ordering TransiInvestiga-tion in LiMn2O4. Solid State Communications, 111, 453-458.
http://dx.doi.org/10.1016/S0038-1098(99)00208-2
[38] Rousse, G., Masquelier, C., Rodriguez-Carvajal, J., Elkaim, E., Lauriat, J.P. and Martinez, J.L. (1999) X-Ray Study of
the Spinel LiMn2O4 at Low Temperatures. Chemistry of Materials, 11, 3629-3635.
http://dx.doi.org/10.1021/cm9910963
[39] Strobel, P., Cras, F.L., Seguin, L., Anne, M. and Tarascon, J.M. (1998) Oxygen Nonstoichiometry in Li-Mn-O Spinel
Oxides: A Powder Neutron Diffraction Study. Journal of Solid State Chemistry, 135, 132-139.
http://dx.doi.org/0.1006/jssc.1997.7611
[40] Paolone, A., Cantelli, R., Rousse, G., Masquelier, C. and Ferretti, M. (2003) Anelastic Spectroscopy Study of the
Charge Order Transition of LiMn2O4. International Journal of Modern Physics B, 17, 799-804.
http://dx.doi.org/10.1142/S0217979203016637
[41] Paolone, A., Cantelli, R., Rousse, G. and Masquelier, C. (2003) The Charge Order Transition and Elastic/Anelastic
Properties of LiMn2O4. Journal of Physics: Condensed Matter, 15, 457-465.
http://dx.doi.org/10.1088/0953-8984/15/3/310
[42] Sugiyama, J., Tamura, T. and Yamauchi, H. (1995) Elastic/Anelastic Behavior during the Phase Transition in Spinel
LiMn2O4. Journal of Physics: Condensed Matter, 7, 9755-9764. http://dx.doi.org/10.1088/0953-8984/7/50/010
[43] Liu, Y., Sun, Y., Zeng, F., Liu, J. and Ge, J. (2013) Effect of POSS Nanofiller on Structure, Thermal and Mechanical
Properties of PVDF Matrix. Journal of Nanoparticle Research, 15, 2116.
http://dx.doi.org/10.1007/s11051-013-2116-1
[44] Amanieu, H., Rosato, D., Sebastiani, M., Massimi, F. and Lupascu, D.C. (2014) Mechanical Property Measurements of
Heterogeneous Materials by Selective Nanoindentation: Application to LiMn2O4 Cathode. Materials Science and
En-gineering: A, 593, 92-102. http://dx.doi.org/10.1016/j.msea.2013.11.044
[45] Wang, Q.Z., Lu, D.M., Cui, C.X., Yan, N.J. and Wang, Q. (2013) Fabrication and Internal Friction Behaviors of Novel
Porous CuAlMn Shape Memory Alloy Filled with Polystyrene. Materials Letters, 92, 82-85.
http://dx.doi.org/10.1016/j.matlet.2012.10.071
[46] Wei, J.N., Huang, T.C., Zhao, L., Yu, J.M., Xie, W.J. and Li, G.M. (2008) Internal Friction Characterization of
Gra-phite. Journal of Materials Science, 43, 5470-5473. http://dx.doi.org/10.1007/s10853-008-2824-6
[47] Metcalf, T.H., Liu, X., Houston, B.H., Baldwin, J.W., Butler, J.E. and Feygelson, T. (2005) Low Temperature Internal
Friction in Nanocrystalline Diamond Films. Applied Physics Letters, 86, Article ID: 081910.
http://dx.doi.org/10.1063/1.1868065
[48] Liu, X., Metcalf, T.H., Mosaner, P. and Miotello, A. (2005) Microstructure Dependence of Low-Temperature Elastic
Properties in Amorphous Diamond like Carbon Films. Physical Review B, 71, Article ID: 155419.
http://dx.doi.org/10.1103/PhysRevB.71.155419
[49] Li, Y.C., Tjong, S.C. and Li, R.K.Y. (2010) Electrical Conductivity and Dielectric Response of Poly(vinylidene
fluo-ride)—Graphite Nanoplatelet Composites. Synthetic Metals, 160, 1912-1919.
http://dx.doi.org/10.1016/j.synthmet.2010.07.009
[50] Huang, W., Edenzon, K., Fernandez, L., Razmpour, S., Woodburn, J. and Cebe, P. (2010) Nanocomposites of Poly(viny-
lidene fluoride) with Multiwalled Carbon Nanotubes. Journal of Applied Polymer Science, 115, 3238-3248.
http://dx.doi.org/10.1002/app.31393
[51] Hasiguti, R.R., Igata, N. and Kamoshita, G. (1962) Internal Friction Peaks in Cold-Worked Metals. Acta Metallurgica,
10, 442-447. http://dx.doi.org/10.1016/0001-6160(62)90023-8
[52] Lax, E. and Filson, D.H. (1959) Second Low-Temperature Peak in the Internal Friction of Aluminum. Physical Review,
114, 1273-1273. http://dx.doi.org/10.1103/PhysRev.114.1273
[53] Bruner, L.J. (1960) Low-Temperature Internal Friction in Face-Centered Cubic and Body-Centered Cubic Metals.
Physical Review, 118, 399-410. http://dx.doi.org/10.1103/PhysRev.118.399
[54] Baxter, W.J. and Wilks, J. (1963) The Effect of Annealing on the Bordoni Peak in Aluminum. Acta Metallurgica, 11,
978-982. http://dx.doi.org/10.1016/0001-6160(63)90067-1
[55] Chevalier, J.L., Peguin, P., Perez, J. and Gobin, P. (1972) Frottementintérieur de l’aluminiumtrèsfaiblementécroui.
Journal of Physics D: Applied Physics, 5, 777-781. http://dx.doi.org/10.1088/0022-3727/5/4/319
[56] Mongy, M., Salama, K. and Beckman, O. (1963) Dislocation Relaxation in Aluminum. Solid State Communications, 1,
234-236. http://dx.doi.org/10.1016/0038-1098(63)90015-2
[57] Wei, J.N., Gong, C.L., Cheng, H.F., Zhou, Z.C., Li, Z.B., Shui, J.P. and Han, F.S. (2002) Low-Frequency Damping
Behavior of Foamed Commercially Pure Aluminum. Materials Science and Engineering: A, 332, 375-381.
[58] Golyandin, S.N., Sapozhnikov, K.V., Emel’yanov, Y.A., Sinani, A.B., Kustov, S.B. and Robinson, W.H. (1998) Influ-ence of Temperature and Strain on the Amplitude-Dependent Internal Friction of High-Purity Aluminum. Physics of