Munich Personal RePEc Archive
The Impact of Immigrant Concentration
in Schools on Grade Retention in Spain:
a Difference-in-Differences Approach
Pedraja Chaparro, Francisco and Santín González, Daniel
and Simancas Rodríguez, Rosa
University of Extremadura, Complutense University of Madrid,
University of Extremadura
2013
Online at
https://mpra.ub.uni-muenchen.de/46888/
The Impact of Immigrant Concentration in Schools on Grade
Retention in Spain: a Difference-in-Differences Approach
Francisco Pedraja Chaparro
University of Extremadura ([email protected])
Daniel Santín González
Complutense University of Madrid ([email protected])
Rosa Simancas Rodríguez
University of Extremadura ([email protected])
Abstract
Since the late 1990s, Spain has played host to a sizeable flow of immigrants who have been absorbed into the compulsory stage of the education system. In this paper, our aim is to assess the impact of that exogenous increase in the number of immigrant students from 2003 to 2009 on grade retention using Spanish data from PISA 2003 and 2009. For this purpose, we use the difference-in-differences method (DiD), capable of detecting whether the immigrant concentration has had a significant effect on student performance. Within this framework, the
control group will be the schools without sampled immigrants from 2003 to 2009 and the
treatment group will be schools with immigrant students that experienced a significant increase of immigrants throughout this period. As the percentage of immigrants is different across schools, the DiD methodology is adapted to deal with a dose treatment. What we are looking for then is not simply the average effect of there being or not being foreign students at the school, but the effect of their concentration. In this way, the effect of immigrants joining schools can be isolated and estimated through a DiD dose estimator controlling by other educational variables that also influence school performance. Our results evidenced that their arrival does not on average decrease school promotion rates with respect to 2003 and is even beneficial to native students. Although the concentration of immigrant students at the same school does have a negative impact on immigrant students generating more grade retention, native students are unaffected until concentrations of immigrant students are higher.
Keywords: difference in differences, immigration, education, PISA
1. Introduction
There has been a remarkable increase in the foreign population in Spain over the last 15 years, with a constantly growing inflow that accounts for almost one third of the total immigrants received by the OECD (Cebrián et al., 2010). This was the result of the expansion of the Spanish economy, motivated largely by the construction sector boom. These immigration rates have slowed down since 2009 and even declined slightly in absolute terms between 2010 and 2012, possibly due to the economic crisis. Throughout this period there has been a significant change in the composition of the immigrant population according to their countries of origin. In the early days most immigrants came mainly from Latin America, whereas the percentage of the immigrant population from other European countries, mainly European Union non-members, increased notably towards the end of this period (Puente and Sánchez, 2010).
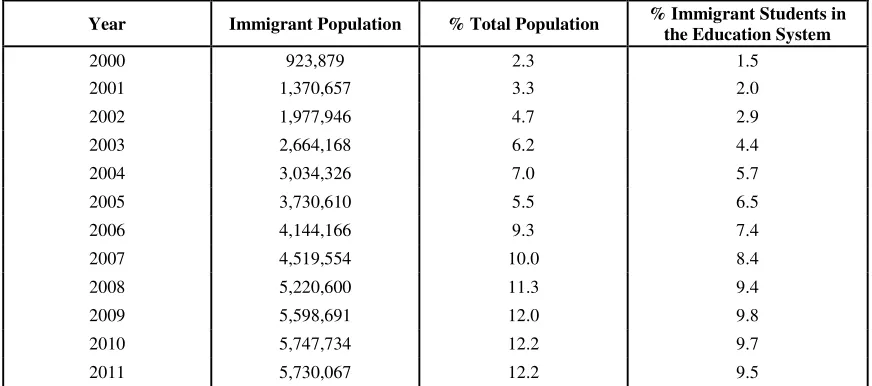
[image:3.595.80.516.438.631.2]A direct consequence of this phenomenon is the higher proportion of immigrant students in the Spanish education system, rising from 1.5% in 2000 to 9.5% in 2011 with a 9.81% peak in 2009. Table 1 shows immigration figures in Spain from 2000 to 2011 and the evolution of the proportion of immigrant students in the Spanish education system.
Table 1: Data about immigrant population in Spain
Year Immigrant Population % Total Population % Immigrant Students in the Education System
2000 923,879 2.3 1.5
2001 1,370,657 3.3 2.0
2002 1,977,946 4.7 2.9
2003 2,664,168 6.2 4.4
2004 3,034,326 7.0 5.7
2005 3,730,610 5.5 6.5
2006 4,144,166 9.3 7.4
2007 4,519,554 10.0 8.4
2008 5,220,600 11.3 9.4
2009 5,598,691 12.0 9.8
2010 5,747,734 12.2 9.7
2011 5,730,067 12.2 9.5
Source: Author’s calculations using data from the municipal register (National Institute of Statistics)
between themselves and their native classmates (Frick and Wagner, 2001; Ammermueller, 2007). In some other countries like Belgium and Canada, however, where native students continue to outperform their immigrant peers, the performance gap has narrowed despite the rising the percentage of immigrants (Entorf and Minoiu, 2005; OECD, 2011). Additionally, there are evidences that high rates of immigrant pupils affect negatively the achievement of natives, although the size of this effect is relatively small (Brunello, 2013).
In Spain, recent papers have studied this phenomenon using different approaches: Calero and Waisgrais (2009) and Calero et al., (2009) compare the educational performance of immigrant students and their peers using multilevel regression techniques, concluding that the determinants of educational achievement affect native and immigrant students differently. Zinovyeva et al., (2009) perform Oaxaca-Blinder decomposition in order to analyze the educational gap between natives and immigrants and find that around half of this gap can be attributed to socioeconomic and family factors. Finally, Salinas and Santín (2012) employ a switching regression model to calculate the impact of immigration on the educational outcomes controlling for school type. They show that immigrant students have a higher probability of attending public schools and that the negative effect on native students produced by the concentration of immigrants is bigger in public schools than in private government-dependent schools.
Another relevant issue in Spain is the high rates of grade retention (around 30% of students), which is a warning sign of school failure and a good predictor of school dropouts. Several studies support the hypothesis that repeating a grade is often the main predictor of school failure (Roderick, 1994; Jimerson et al., 2002; Benito, 2007). This has led us to study the effect of immigration from another perspective. We consider whether or not the increase in immigrant students recent years has had repercussions on grade retention rates particularly for native students.
This paper uses an impact evaluation approach to study how the increase of the proportion of immigrant students in some schools can affect grade retention rates. For this purpose, we estimate the impact of the exogenous increase of immigrant students1 in Spain from 2003 to 2009 using a difference-in-differences approach (DiD). Using this technique, we can determine whether the concentration of immigrants has a significant effect on student performance by comparing the percentages of students studying in the proper grade by age.
1
The research reported here makes two contributions. Firstly, we apply the DiD method to analyze the possible relationship between the increase of foreign students and grade retention rates. The idea behind this approach is that the treatment types could differ in some situations, depending in this case on the concentration of immigrants. On this ground, the treatment will be referred to as a dose treatment. Secondly, we do not apply this methodology to longitudinal data as is common practice in the previous literature, but construct a pseudo-panel from data of consecutive cross sections OECD PISA reports for Spain.
The paper is structured as follows. Section 2 presents and justifies the applied methodology. In Section 3, we describe the dataset used and the selected variables included in the empirical analysis. Section 4 reports the results. We conclude in section 5 by discussing the implications of our findings for public policy.
2. Methodology
Researchers have developed complex econometric methods to distinguish causation from accidental associations or correlations in order to assess the impact of certain public policies or reforms and quantify their effects (Schlotter et al., 2011). The aim of impact evaluation is to compare how the same individual would have fared with and without an intervention (usually known as “the treatment”). When the treatment was not designed to be randomly applied to the population, the main challenge of a quasi-experimental impact evaluation approach is to find a good counterfactual -namely, the situation that a participating subject would have experienced if he or she had not been exposed to the program (Khandker et al., 2010).
The rate of non-repeater students (who are in the correct grade) from 2003 to 2009 at the control schools will vary due to a number of possibly unknown factors. The variation of this rate at the treatment schools will be due to the same factors plus the variation in the component we are trying to evaluate, i.e. the arrival of immigrants. In order to estimate the impact of the exogenous increase in the number of immigrants, we use the DiD technique by means of which we can isolate the effect of immigrant arrival from the unknown factors. Although this technique requires panel data, it can also be estimated using cross-sectional databases, provided that they can be guaranteed to be consistently representative (Khandker et al., 2010) and the samples are selected according to the same procedure throughout (Meyer, 1995). In this case, the pseudo-panel offered by consecutive PISA reports (OECD, 2004; OECD, 2010) satisfies these requirements.
The DiD method calculates the average difference in outcomes separately for treatment and non-treatment groups over the period. Then, after taking an additional difference between the average changes in outcomes for these two groups, it is possible to identify the difference-in-differences impact, i.e. the estimated impact of the assessed issue. For our empirical educational model, let and denote the mean percentages of students in the proper grade for their age at treated and control schools, respectively, and t a dummy variable that can take two values: 2003 and 2009. The classical DiD technique estimates the average impact as follows:
= ( − ) − ( − ) (1)
Note that if the treatment group differs from the control group in terms of observed and unobserved characteristics in addition to treatment, we need to assume that the differences between the two groups are time-invariant in order to obtain an unbiased difference-in-differences estimator. The DiD estimator can be solved using a regression. On the basis of the discussion in Ravallion (2008), the estimating equation would be:
= + + + + (2)
where T is the treatment variable, t is the time dummy variable and the coefficient of the interaction of T, and t,β represents the estimated impact of the treatment on outcome Y:
Based on the above equations, the DiD model is developed as follows:
( − ) = ( + + + + ) − ( + + ) = +
( − ) = ( + + ) − ( + ) =
= ( − ) − − =
+ − =
(3)
Thus, the coefficient of the interaction β indicates whether or not the increase in immigrant students has a significant impact on the dependent variable and how much impact it has. In addition to the interaction term, the variables time (t) and treatment (T) are also included in order to detect any isolated effects due to the time or to group membership.
As mentioned at the beginning of this section, we are not only interested in measuring the average effect of immigrant students on educational performance, but also the impact of their concentration. For this reason, we include what we call a dose treatment in our research, and these doses are the percentages of immigrants at each school belonging to the treated group, represented by the variable Immig2. Although dose treatments usually consider finite numbers of treatment levels (i.e. a discrete variable such as different cash transfer sums), this approach can also be applied to continuous treatments (Abadie, 2005), as in this case. The explanatory variable Immig is added to a saturated model combined with time, treatment and the interaction of both variables. The regression equation for this model is:
= + + + + + + + + (4)
However, the above regression cannot be estimated because of its perfect multicollinearity. Since we are only interested in the term that contains the treatment dose ( ), the equation we finally estimate is as follows:
= + + + + + (5)
2
This idea is closely related to the approach developed by Abadie and Dermisi (2008).
= = =
2003 year if 0
Running the DiD model, we get:
( − ) = ( + + + + + ) − ( + + ) = + +
( − ) = ( + + ) − ( + ) =
= ( − = 1) − − = 0 = + (6)
Therefore, the DiD estimator is now the result of adding two terms: the interaction coefficient and the effect that contains the percentage of immigrants .
We can summarize our strategy as follows. In the first period, we have two groups: schools with and without immigrants. Across the two periods, we assume that immigrant students join the education system and enroll in the schools. This is equivalent to increasing the
dose of immigrants in the education system and we are interested in analyzing the impact of this increase on grade retention. At the end of this period, we again have schools with no immigrant population (the control group) and schools with a higher mean percentage of immigrants (the treated group), although this mean is not uniformly distributed across schools. This implies that the dose received by each treated school is different.
It is noteworthy that a basic assumption behind this technique is that the remaining covariates (X), which could affect both the treated and the control groups, must be unchanged over time. If this is not a valid assumption, the regression analysis should control those covariates in order to ensure a correct estimation as follows:
= + + + + + #$ + (7)
Finally, the results section includes a simulation analysis of how the average promotion rates per school vary depending on the percentage of immigrant students enrolled in order to clarify our estimations.
3. Data and variables
3.1 The PISA report
The dataset used for the research comes from the PISA (Programme for International Student Assessment) survey, designed by the OECD in 1990s as a comparative, international, regular and continuous study on certain educational characteristics and skills of students worldwide (Turner, 2006). The PISA target population is composed of students who are aged between 15 and 16 years old at the time of the assessment, all of whom are born in the same year and who have completed at least six years of formal schooling. PISA measures their performance in math, reading and science. It also collects information about students’ personal background and schools environment, for which purpose two questionnaires are administered, one addressed to school principals and another to students3. These surveys have taken place every three years since the year 2000 focusing on one of the above three areas each time.
An important aspect that to be taken into account in an empirical analysis using PISA data is that the data are gathered by means of a two-stage sampling procedure. First, a sample of schools is selected in every country from the full list of schools containing the total student population. Then, a sample of 35 students is randomly selected within each school. As a result, statisticalanalyses have to consider sampling weights in order to ensure that sampled students adequately represent the analyzed total population (Rutkowski et al., 2010)4.
3.2 Sample, variables and the identification strategy
Although the DiD method usually uses panel data, repeated cross-sectional data from the same areas has also been used in the literature (Eissa and Liebman, 1996; Dynarski, 2002; Chaudhury and Parajuli, 2010). As PISA is a cross-sectional database, we use data from two different waves (2003 and 2009) in order to build a pseudo-panel. This pseudo-panel provides
3
Parents complete a third questionnaire. However, this information is only available for a limited number of countries and, unfortunately, Spain is not one of them..
4
information useful for interpreting average results concerning the 2002/03 and 2008/09 academic years. The chosen unit of analysis is the school and, therefore, the data is aggregated at school level in order to build the pseudo-panel. PISA samples are composed of different school types that can be divided into three groups according to their ownership: public (government managed and funded schools), private (privately managed and funded schools) and private government dependent (privately managed and government funded schools). In our research we focus on schools that are comparable in terms of public funding and also share the same admission criteria5, i.e. public and private government-dependent schools. The sample is composed of 336 schools (199 public schools and 137 private government-dependent schools) in 2003 and 806 schools (512 public schools and 294 private government-dependent schools) in 20096.
Regarding the variables, we use the percentage of students who are in their correct grade (without repeating any year) and the percentage of native students who are in their correct grade as dependent variables. Since PISA assesses 15-year-old students, we consider that 4th-grade ESO students (the so-called Enseñanza Secundaria Obligatoria, i.e. compulsory secondary education in the Spanish system, equivalent to 10th grade on the international scale) are in their correct year. We differentiate between these two dependent variables in order to distinguish how the concentration of immigrant students in schools affects grade retention and native grade retention, in particular.
In our analysis, the treated schools are schools that have immigrant students. As the distribution of immigrant students is not uniform across the education system, the concentration of these students differs from one school to another. With the aim of introducing this issue in our econometric models, we consider a dose treatment. In this way, we include the percentage of immigrants (Immig) in the base model (2), defined as the ratio between immigrant students and the total number of students sampled by school in order to capture the potential effects of a higher presence of immigrants in schools (5).
The school distribution by control and treated groups, and the different treatment doses are shown in Tables 2 and 3, respectively.
5 Note that immigrant students attending private schools are a minority that can afford an expensive education and do not generate any educational problem.
Table 2: School distribution by groups
2003 2009
Schools % Schools % Control Schools 154 45.8 168 20.8
Treated Schools 182 54.2 638 79.2
N 336 100 806 100
Source: Author’s calculations using data from PISA (OECD, 2004; OECD, 2010).
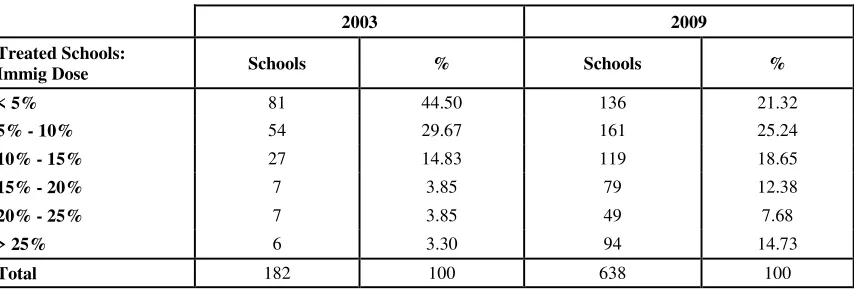
Table 3: Different treatment doses within treated schools
2003 2009
Treated Schools:
Immig Dose Schools % Schools %
< 5% 81 44.50 136 21.32
5% - 10% 54 29.67 161 25.24
10% - 15% 27 14.83 119 18.65
15% - 20% 7 3.85 79 12.38
20% - 25% 7 3.85 49 7.68
> 25% 6 3.30 94 14.73
Total 182 100 638 100
Source: Author’s calculations using data from PISA (OECD, 2004; OECD, 2010).
From Table 2 we conclude that the percentage of schools with immigrants grew significantly from 2003 (54.17% of total) to 2009 (79.17% of total). Additionally, Table 3 shows that around 11% of schools had an immigrant student population of more than 15% in 2003, whereas this percentage multiplied by more than three in 2009 reaching 34.79%.
Moreover, as we explained above, we select a set of control variables to be introduced in the model (names in brackets denote variable names in the results tables):
Index of parental occupational status (Parental Occupation): The HISEI variable represents the index of highest occupational status of parents according to the International Socio-Economic Index of Occupational Status (ISEI, Ganzeboom et al., 1992). We built a variable that represents the average value of this index for each school. We assume that the higher the average parental occupational status, the greater their income, whereby students enrolled at this school will have higher average socioeconomic status.
[image:11.595.87.514.235.380.2]Type of School (School Type): Dummy variable that takes value 1 if the school is a private government-dependent school and 0 for a public school.
Quality of school resources (School Resources): Continuous variable based on the school principal’s responses to seven questions available from PISA 2003 and PISA 2009 databases related to the availability of computers for educational purposes, educational software, calculators, books, audiovisual resources and laboratory equipment.
Village: Dummy variable that takes value 1 if the school is located in a town with a population of less than 15,000 and 0 otherwise.
Small town: Dummy variable that takes value 1 if the school is located in a town with a population between 15,000 and 100,000 and 0 otherwise.
City: Dummy variable that takes value 1 if the school is located in a town with a population between 100,000 and 1,000,000 and 0 otherwise (taken as the baseline category).
Large City: Dummy variable that takes value 1 if the school is located in a city with a population of more than one million and 0 otherwise.
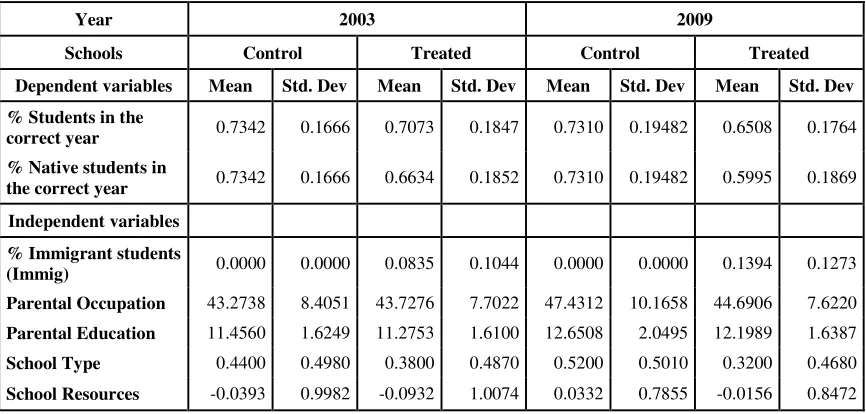
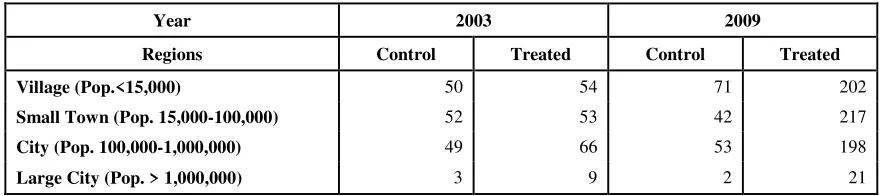
[image:12.595.82.515.532.739.2]Tables 4 and 5 report the main descriptive statistics for the variables considered in our analysis and the distribution of control and treatment schools within the different population sizes.
Table 4: Descriptive statistics
Year 2003 2009
Schools Control Treated Control Treated Dependent variables Mean Std. Dev Mean Std. Dev Mean Std. Dev Mean Std. Dev % Students in the
correct year 0.7342 0.1666 0.7073 0.1847 0.7310 0.19482 0.6508 0.1764 % Native students in
the correct year 0.7342 0.1666 0.6634 0.1852 0.7310 0.19482 0.5995 0.1869 Independent variables
% Immigrant students
(Immig) 0.0000 0.0000 0.0835 0.1044 0.0000 0.0000 0.1394 0.1273 Parental Occupation 43.2738 8.4051 43.7276 7.7022 47.4312 10.1658 44.6906 7.6220
Parental Education 11.4560 1.6249 11.2753 1.6100 12.6508 2.0495 12.1989 1.6387
School Type 0.4400 0.4980 0.3800 0.4870 0.5200 0.5010 0.3200 0.4680
School Resources -0.0393 0.9982 -0.0932 1.0074 0.0332 0.7855 -0.0156 0.8472
Table 5: Distribution of schools within the different population sizes
Year 2003 2009
Regions Control Treated Control Treated Village (Pop.<15,000) 50 54 71 202
Small Town (Pop. 15,000-100,000) 52 53 42 217
City (Pop. 100,000-1,000,000) 49 66 53 198
Large City (Pop. > 1,000,000) 3 9 2 21
Source: Author’s calculation using data from PISA (OECD, 2004; OECD, 2010).
4. Analysis of results
4.1 Results
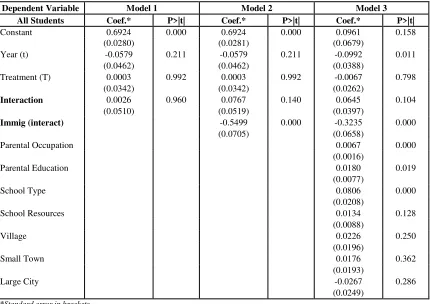
This section presents the results for the models described in the methodology. Specifically, we estimate three different models for each dependent variable: percentage of students in their correct grade (Students) and percentage of native students in their correct grade (NStudents). Model 1 is the basic difference-in-differences model estimation (2). Model 2 is equivalent to the basic model plus the treatment “dose” (5) captured through the percentage of immigrants at the school combined with the interaction term ( ). Finally, Model 3 estimates Equation 7 as an extension of Model 2, in which control variables are also introduced in order to single out the net effect of treatment. By including these variables, we can test whether or not they have a separate effect on the outcome.
Table 6: Difference-in-differences estimations for all students
Dependent Variable Model 1 Model 2 Model 3 All Students Coef.* P>|t| Coef.* P>|t| Coef.* P>|t|
Constant 0.6924 0.000 0.6924 0.000 0.0961 0.158
(0.0280) (0.0281) (0.0679)
Year (t) -0.0579 0.211 -0.0579 0.211 -0.0992 0.011
(0.0462) (0.0462) (0.0388)
Treatment (T) 0.0003 0.992 0.0003 0.992 -0.0067 0.798
(0.0342) (0.0342) (0.0262)
Interaction 0.0026 0.960 0.0767 0.140 0.0645 0.104
(0.0510) (0.0519) (0.0397)
Immig (interact) -0.5499 0.000 -0.3235 0.000
(0.0705) (0.0658)
Parental Occupation 0.0067 0.000
(0.0016)
Parental Education 0.0180 0.019
(0.0077)
School Type 0.0806 0.000
(0.0208)
School Resources 0.0134 0.128
(0.0088)
Village 0.0226 0.250
(0.0196)
Small Town 0.0176 0.362
(0.0193)
Large City -0.0267 0.286
(0.0249)
*Standard error in brackets
Source: Author’s calculations using data from PISA (OECD, 2004; OECD, 2010).
Model 3 parameters illustrated in Table 6 can be interpreted similarly. The only notable difference is that the effect of immigrant concentration persists and is significant, albeit to a lower extent, despite control based on the variables related to school type, school resources, school location and school average socioeconomic status, through indexes that represent the level of parental education and parental occupation. With respect to the control variables introduced in the model, variables representing the educational level and occupational status of parents and the type of school are statistically significant.
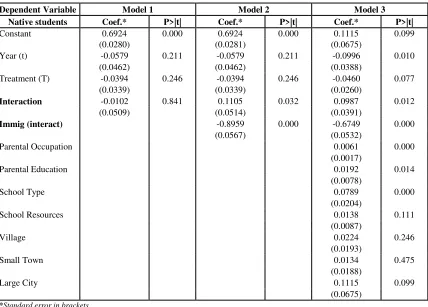
[image:15.595.86.514.296.603.2]Table 7 illustrates the three model estimation parameters for the percentage of native students in their correct grade only.
Table 7: Difference-in-differences estimations for native students
Dependent Variable Model 1 Model 2 Model 3 Native students Coef.* P>|t| Coef.* P>|t| Coef.* P>|t|
Constant 0.6924 0.000 0.6924 0.000 0.1115 0.099
(0.0280) (0.0281) (0.0675)
Year (t) -0.0579 0.211 -0.0579 0.211 -0.0996 0.010
(0.0462) (0.0462) (0.0388)
Treatment (T) -0.0394 0.246 -0.0394 0.246 -0.0460 0.077
(0.0339) (0.0339) (0.0260)
Interaction -0.0102 0.841 0.1105 0.032 0.0987 0.012
(0.0509) (0.0514) (0.0391)
Immig (interact) -0.8959 0.000 -0.6749 0.000
(0.0567) (0.0532)
Parental Occupation 0.0061 0.000
(0.0017)
Parental Education 0.0192 0.014
(0.0078)
School Type 0.0789 0.000
(0.0204)
School Resources 0.0138 0.111
(0.0087)
Village 0.0224 0.246
(0.0193)
Small Town 0.0134 0.475
(0.0188)
Large City 0.1115 0.099
(0.0675)
*Standard error in brackets
Source: Author’s calculations using data from PISA (OECD, 2004; OECD, 2010).
Nevertheless, this slight advantage is offset and, finally, even cancelled out by the dose
coefficient.
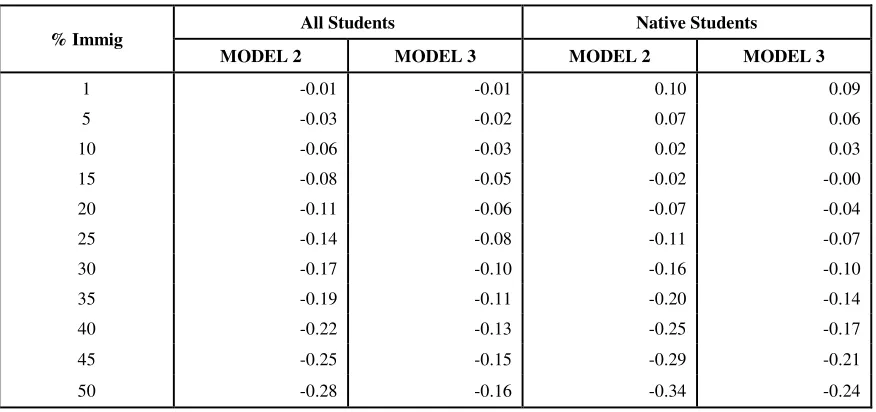
4.2 Simulation
To clarify the above results, Table 8 is a simulation of how the average promotion rates vary in schools based on the percentage of enrolled immigrant pupils7. Any percentage of enrolled immigrants has negative effects on the percentage of non-repeaters for all students, although these effects are significant when the proportion of immigrants in the classroom is above 10%. For example, schools with a 10% concentration of immigrant students have around three immigrant pupils per classroom (for a 30-student classroom), which results in a decrease of from one to two non-repeater pupils. In the case of native students, however, concentrations of immigrant students of under 15% have neither negative nor positive effects. Teachers appear to substitute potential native repeaters by these immigrant students when there are not many immigrant students in the class (fewer than four to five students), and the percentage of non-repeating native students decreases.
However, when immigrant concentrations climb to over 15% (more than five immigrants per class), we start to detect a significant negative impact on natives’ results compared with natives in the control group. In this case, the presence of six immigrant students per classroom (equivalent to an immigrant concentration of around 20%) leads to a reduction of from two to three individuals in the rate of non-repeating native students. This finding, which is similar to previous findings reported in the literature (Calero and Waisgrais, 2009), provides empirical evidence demonstrating that there is a clear negative peer effect related to a high concentration of immigrant students in some schools.
7 Simulations are based on the estimations from Models 2 and 3 contained in Table 7 only. It makes no sense to run a
Table 8: Simulation of results for different percentages of immigrant students
% Immig All Students Native Students
MODEL 2 MODEL 3 MODEL 2 MODEL 3
1 -0.01 -0.01 0.10 0.09
5 -0.03 -0.02 0.07 0.06
10 -0.06 -0.03 0.02 0.03
15 -0.08 -0.05 -0.02 -0.00
20 -0.11 -0.06 -0.07 -0.04
25 -0.14 -0.08 -0.11 -0.07
30 -0.17 -0.10 -0.16 -0.10
35 -0.19 -0.11 -0.20 -0.14
40 -0.22 -0.13 -0.25 -0.17
45 -0.25 -0.15 -0.29 -0.21
50 -0.28 -0.16 -0.34 -0.24
Source: Author’s calculations.
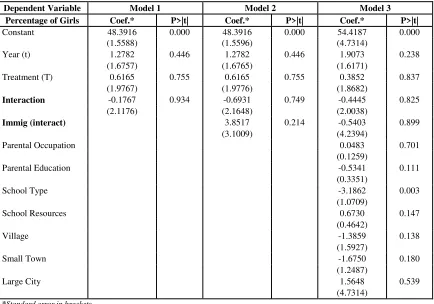
4.3 Placebo test
As mentioned in the methodology section, one assumption of the DiD method is that the trends of the treatment and control groups would be equal in the absence of the treatment, i.e. both groups are similar in all variables but the treatment. Because we cannot prove this assumption, we perform different placebo tests in order to check whether the identified effects are due to such treatment and endorse the correct selection of the control and treatment groups (Gertler et al., 2011).
In our research, we apply the placebo test using a “fake” dependent variable -average percentage of girls at school-, knowing that it should not be affected by the increase of immigrant students in classrooms. Table 9 summarizes the results which corroborate our hypothesis: the DiD estimator (coefficient associated with the interaction term) and the DiD
Table 9: Placebo test: Difference in differences models using percentage of girls at school
as a “fake” dependent variable
Dependent Variable Model 1 Model 2 Model 3 Percentage of Girls Coef.* P>|t| Coef.* P>|t| Coef.* P>|t|
Constant 48.3916 0.000 48.3916 0.000 54.4187 0.000
(1.5588) (1.5596) (4.7314)
Year (t) 1.2782 0.446 1.2782 0.446 1.9073 0.238
(1.6757) (1.6765) (1.6171)
Treatment (T) 0.6165 0.755 0.6165 0.755 0.3852 0.837
(1.9767) (1.9776) (1.8682)
Interaction -0.1767 0.934 -0.6931 0.749 -0.4445 0.825
(2.1176) (2.1648) (2.0038)
Immig (interact) 3.8517 0.214 -0.5403 0.899
(3.1009) (4.2394)
Parental Occupation 0.0483 0.701
(0.1259)
Parental Education -0.5341 0.111
(0.3351)
School Type -3.1862 0.003
(1.0709)
School Resources 0.6730 0.147
(0.4642)
Village -1.3859 0.138
(1.5927)
Small Town -1.6750 0.180
(1.2487)
Large City 1.5648 0.539
(4.7314)
*Standard error in brackets
Source: Author’s calculations using data from PISA (OECD, 2004; OECD, 2010).
5. CONCLUSIONS
During the last decade, there has been a constantly growing inflow of immigrants, leading to a remarkable increase in the foreign population in Spain. This has affected the percentage of immigrant students who have joined the Spanish education system and account for around 9.5% of the school population for the year 2011. At the same time, Spain is feeling the effect of other relevant issues like consistently very high grade retention rates of around 30%.
Given this background, the aim of this paper is to estimate the impact of the exogenous increase of immigrant students from 2003 to 2009 using a DiD approach, which would reveal whether immigrant concentration had a significant effect on the percentage of non-repeater students. We use the pseudo-panel provided by consecutive OECD PISA reports.
In our identification strategy, schools with foreign students enrolled constitute our
concentration of immigrants in classrooms in this paper. For this reason, we refer to a dose treatment (Abadie & Dermisi, 2008), where the dose is the percentage of immigrant students and, hence, the DiD estimator is the sum of the terms related to interaction and the percentage of
immigrants ( = + ).
Since we are interested in evaluating the effect of the immigration phenomenon on students and native students, in particular, we have two dependent variables: percentage of students who are in their correct grade and percentage of native students who are in their correct grade. For each dependent variable, we estimate three models: the basic DiD model (Model 1), an equivalent model introducing the treatment “dose” (Model 2) and an extension of the previous models that includes a set of control covariates (Model 3). Moreover, we develop a
placebo test to check the validity and the robustness of the approach.
Analyzing the effect on all students, we find that the interaction coefficient (β) (DiD basic impact estimator) appears not to be statistically significant; however, the term associated with the dose of immigrants (δ) (percentage of immigrant students) has a negative and statistically significant relationship with the percentage of students who are in their correct grade. The impact on native students is different, as the interaction coefficient (β) in the DiD dose estimator is statistically significant and positive, but this small advantage is offset and finally cancelled out by the dose term (δ) when the concentration of immigrants is above 15%.
In conclusion, immigrant students joining the Spanish education system does not, on average, decrease school promotion rates with respect to 2003. This situation is even beneficial to native students because foreign students are more greatly affected by grade retention. Taking into account the dose (percentage of immigrants enrolled per school), however, we find that the concentration of immigrant students has a negative impact on promotion rates. In other words, the average percentage of repeaters, and, in particular, the average percentage of native repeaters, has increased in 2009 with respect to 2003 as a consequence of higher immigrant concentrations in some schools. However, native students are only affected by higher concentrations of immigrant students (above 15%).
maximum percentage of immigrants per school in order to avoid high concentrations or provide more resources for specific language and skills training in order solve problems of adaptation to the new education system.
References
Abadie, A. (2005): “Semiparametric Difference-in-Differences estimators”. Review of Economic studies, 72 (1), 1-19.
Abadie, A., and Dermisi, S. (2008): “Is terrorism eroding agglomeration economies in Central Business Districts? Lessons from the office real estate market in downtown Chicago”.
Journal of Urban Economics, 64, 451-463.
Ammermuller, A. (2007): “Poor Background or Low Returns? Why Immigrant Students in Germany perform so Poorly in the Programme for International Student Assessment”.
Education Economics, 15, 215-230.
Benito, A. (2007): “La LOE ante el fracaso, la repetición y el abandono escolar”.
Revista Iberoamericana de Educación, 43 (7).
Brunello, G., and Rocco, L. (2013): “The effect of immigration on the school performance of natives: cross country evidence using PISA test scores”. Economic of Education Review, 32, 234-246.
Calero, J., Choi, A., and Waisgrais, S. (2009): “Determinantes del rendimiento educativo del alumnado de origen nacional e inmigrante”. Cuadernos Económicos del ICE, 78, 281-311.
Calero, J., and Waisgrais, S. (2009): “Rendimientos educativos de los alumnos inmigrantes: identificación de la incidencia de la condición de inmigrante y de los peer-effects”. XVI Meeting of Public Economic, Granada.
Cebrián, J. A., Bodega, M. I., Martín-Lou, M. A., and Guajardo, F. (2010): “La crisis económica internacional y sus repercusiones en España y en su población inmigrante”. Estudios Geográficos, 71(268), 67-101.
Chaudhury, N., and Parajuli, D. (2010): “Conditional cash transfers and female schooling: the impact of the female school stipend programme on public school enrolments in Punjab, Pakistan”. Applied Economics, 42(28), 3565-3583.
Dynarski, S. (2002): “The Behavioral and Distributional Implications of Aid for College”. The American Economic Review, 92 (2), 279-285.
Driesen, J. M. W. Geert (2000): “Ethnicity, Forms of Capital and Educational Achievement”. International Review of Education, 47(6), 513-538.
Eissa, N., and Liebmand, J. B. (1996): “Labor Supply Response to the Earned Income Tax Credit”. Quarterly Journal of Economics, 111, 605–637.
Frick, J. R., and Wagner, G. (2001): “Economic and Social Perspectives of Immigrant Children in Germany”, IZA Discussion Paper, n. 301, IZA, Bonn.
Ganzeboom, H. B. G., De Graaf, P., Treiman, J., and De Leeuw, J. (1992): “A standard international socio-economic index of occupational status”. Social Science Research, 21(1), 1-56.
Gertler, P. J., Martinez, S., Premand, P., Rawlings, L. B., and Vermeersch, C.M.J. (2011): Impact evaluation in practice. World Bank. Washington, D.C.
Jimerson, S. R., Anderson, G. E., and Whipple, A. D. (2002): “Winning the battle and losing the war: Examining the relation between grade retention and dropping out of high school”. Psychology in the Schools, 39(4), 441-457.
Khandker, S. R., Koolwal, G. B., and Samad, H. A. (2010): Handbook on impact evaluation: quantitative methods and practices. World Bank. Washington, D.C.
Meyer, B. D. (1995): “Natural and Quasi-Experiments in Economics”. Journal of Business & Economics Statistics, 13 (2), 151-161.
OECD (1999): Classifying educational programmes: Manual for ISCED-97 implementation in OECD countries. Paris: OECD.
OECD (2004): Learning for tomorrow’s world. First results from PISA 2003. Paris: OECD.
OECD (2005): PISA 2003 Data Analysis Manual. SPSS users. Paris: OECD
OECD (2009): PISA Data analysis manual. SPSS SECOND EDITION. Paris: OECD. OECD (2010): PISA 2009 Results: What Students Know and Can Do. Paris: OECD. OECD (2011): How are school systems adapting to increasing numbers of immigrant students?. PISA IN FOCUS. Paris: OECD.
Puente, S., and Sánchez, P. (2010): “Evolución reciente de la población en España y proyecciones a corte y largo plazo”. Boletín Económico, Banco de España, 2, 45-54.
Ravallion, M. (2008): “Evaluating Anti-poverty Programs”. In Handbook of Development Economics, vol. 4, ed. T. Paul Schultz and John Strauss, 3787–846. Amsterdam: North-Holland.
Roderick, M. (1994): “Grade retention and school dropout: Investigating the association”. American Educational Research Journal, 31 (4), 729-759.
Rutkowski, L., González, E., Joncas, M., and Von Davier, M. (2010): “International Large-Scale Assessment Data: Issues in Secondary Analysis and Reporting”. Educational Researcher, 39 (2), 142-151.
Salinas, J., and Santín, D. (2012): “Selección escolar y efectos de la inmigración sobre los resultados académicos españoles en PISA 2006”. Revista de Educación, 358, 382-405.
Schnepf, V. S. (2008): “Inequality of Learning amongst Immigrant Children in Industrialized Countries”. IZA Discussion Paper 3337.
Turner, R. (2006): “El Programa Internacional para la Evaluación de los Alumnos (PISA). Una perspectiva general”. Revista de Educación, Madrid, nº extra., 45-74.