Classification of Alzheimer's Disease from 3D Structural
MRI Data
Nabil Belmokhtar
SIMPA Laboratory, Department of Informatics,
Faculty of Science, University of Sciences and
Technology of Oran - Mohamed Boudiaf.
P.B. 1505 El M'naouer, 31000 Oran, Algeria.
Nacéra Benamrane
SIMPA Laboratory, Department of Informatics,
Faculty of Science, University of Sciences and
Technology of Oran - Mohamed Boudiaf.
P.B. 1505 El M'naouer, 31000 Oran, Algeria.
ABSTRACT
With nearly 100.000 cases in Algeria, Alzheimer's disease (AD) represents a major public health problem. Therefore, several different automated methods have been developed to assist clinicians in their diagnosis. We propose here a method based on binary support vector machines (SVM) to distinguish between patients with Alzheimer disease (AD), patients with mild cognitive impairment (MCI) and elderly control subjects (CS) from magnetic resonance imaging (MRI) data. In order to reduce the total computation time, we used the JADE (Java Agent DEvelopement Framework) multi-agent platform. The results obtained show the efficiency of our method and the significant advantages of the parallelization.
General Terms
Dementia Diagnosis, Neuroimaging, Supervised Learning, Multi-Agent Technology.
Keywords
Alzheimer's Disease Diagnosis, MRI, SVM Classification, Multi-Agent Systems, JADE.
1.
INTRODUCTION
Alzheimer's disease (AD) is a neurodegenerative disease of the brain tissue that causes progressive and irreversible loss of mental functions. According to current epidemiological data, the AD affects about 26 million people worldwide, including 100.000 in Algeria [1]. Anatomical magnetic resonance imaging (MRI) studies have indicated that gray matter (GM) volume decreases with age while cerebrospinal fluid (CSF) increases. To provide appropriate care for Alzheimer's patients, it’s very important to quantify the degree of atrophy in the cerebral cortex in the early stages of AD. In clinical practice, the medial temporal lobe atrophy (MTA) can be assessed visually. However, visual assessment is subjective and doesn't provide a true quantification of atrophy. For this purpose, various automated analysis methods have been developed [2] among which we can mention hippocampal volume measurement [3] and volume measurement of gray matter structures or cortical thickness measurement [4]. MTA is a sensitive marker for AD, but not specific. It has been reported in other dementias including Parkinson's disease dementia (PDD), dementia with Lewy bodies (DLB) and vascular dementia (VD). Whole-brain methods [5] [6] for characterizing brain atrophy may be therefore more appropriate for differentiating AD from other neurodegenerative dementias. In particular, voxel-based morphometry (VBM) [7] [8] has become more widespread in the study of groups of healthy elderly, mild cognitive impairment (MCI) and AD subjects. To be useful, such
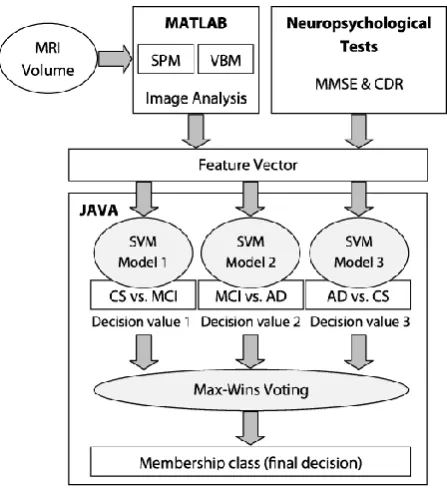
methods must provide an individual predictive diagnosis. Many classification methods have been developed that allow an individual class prediction. Among the most popular: linear discriminant analysis (LDA) [9], neural network (NN) [10] and support vector machines (SVM) [5] [6] [11] [12]. In this paper, our purpose is to develop an automated method, by combining multiple binary SVM-based classifiers, able to discriminate between patients with AD, patients with MCI and elderly control subjects (CS) by using a whole-brain VBM analysis applied to MRI images from the OASIS database. For that we use the feature vector extraction technique reported in [13]. In addition to these features, we also use two neuropsychological tests (Mini Mental State Exam (MMSE) and Clinical Dementia Rating (CDR)) to improve the prediction accuracy. In order to reduce the total processing time, we integrate the JADE (Java Agent DEvelopement Framework) multi-agent platform into our application. The architecture of the system is presented here.
2.
MATERIALS AND METHODS
2.1
Subjects
Forty-five subjects (aged 65 to 96 years) were selected from the open access series of imaging studies (OASIS) database (available at http://www.oasis-brains.org) [14], including fifteen subjects with AD, fifteen subjects with MCI and fifteen healthy aged control subjects (CS). A summary of subject demographics and dementia status is shown in table 1.
Table 1. Summary of subject demographics and dementia status
AD MCI CS
Number of
subjects 15 15 15
Age 78,8
(69-96)
76,26 (66-87)
75,86 (65-89) Education 2,66
(1-5)
2,46 (1-4)
2,93 (1-5) Socioeconomic
status
2,93 (1-5)
3,06 (1-4)
2,66 (1-4)
CDR (1 / 2) 14 / 1 0,5 0
MMSE 21,73
(15-28)
25,86 (20-30)
29,33 (28-30)
2.2
Structural MRI Scanning Protocol
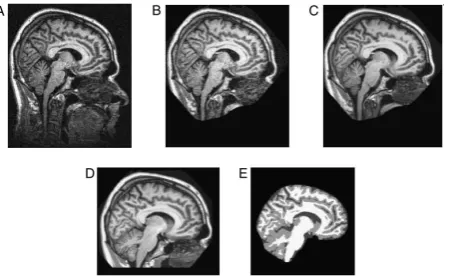
magnetization-prepared rapid gradient echo (MP-RAGE) sequence were acquired on a 1.5-T Vision scanner (Siemens, Erlangen, Germany) in a single imaging session. MRI acquisition details: repetition time TR=9.7 msec., echo time TE=4.0 msec., flip angle FA=10, inversion time TI=20 msec., delay time TD= 200 msec., 128 sagittal 1.25 mm slices without gaps and pixels resolution of 256x256 (1x1mm). An example of typical images is illustrated in figure 1.
Fig 1: Typical MRI data set. (A) Individual scan before defacing. (B) Same scan after defacing. Note that the defacing process leaves the cranial vault intact while identifying facial features are removed. (C) Averaged motion-corrected image. Note improved signal-to-noise ratio. (D) Atlas-registered gain-field-corrected image. (E)
Tissue classification image [14]
2.3
Voxel-based Morphometry (VBM)
Over the past several years, morphometry analysis has become an increasingly common tool for computational brain anatomy studies. It allows a comprehensive measurement of longitudinal (within the same brain, at different times) or cross‐sectional (across brains) structural changes, not only in specific structures but throughout the whole-brain. Voxel-based morphometry (VBM) is a fully automated method that detects differences in the local composition of brain tissue on a voxel-wise comparison of multiple brain images [7] [8] [15]. Such technique has been applied to detect grey matter volume loss in Alzheimer's disease [6] [16] [17]. VBM analysis includes two steps: spatial preprocessing (normalization, segmentation, modulation and smoothing) and statistical analysis (voxel-wise statistical tests). In our case, both steps were implemented in the SPM8 software package [18] (running on Matlab 7.7) in order to obtain the classification features.
2.4
Feature Extraction
This section describes the feature vector extraction processes, based on the voxel location clusters detected by VBM analysis. The first process [13] computes the mean and standard deviation (MSD) of the GM voxel values of each voxel location cluster. The datasets are available at the following address:
http://www.ehu.es/ccwintco/uploads/8/85/Alzheimer_OASIS_ VBM _data.zip. These vectors were used as inputs to our classifier. In addition to these features, we also tried two other features: MMSE and CDR. The combination of these neuropsychological tests and structural MRI data can significantly improve the prediction performance.
2.5
SVM Classification
The classification is performed using SVM-type classifier. The SVM is a powerful supervised learning tool that combines high accuracy with good generalization capability. Several studies [5] [6] [11] [12] have demonstrated the great potential of using SVM to detect Alzheimer's disease. However, training SVM with multi-classes on a large data set is still a bottle-neck. Such harsh conditions increase the processing time necessary to train the algorithm and to make a decision. Therefore, SVM are convenient for classification problem with small-size data sets. To overcome these limitations, the distribution of calculations over several machines or processing units is necessary. The methodology is based on the idea of decomposing a problem into independent sub-problems running in parallel (simultaneously) and then coordinating their solution to solve the original problem. This can be achieved by using artificial intelligent techniques, such as multi-agent systems (MAS). One of the advantages of this approach is the availability of free software development platforms such as JADE (Java Agent DEvelopement Framework) allowing the developer to focus on the framework design instead of the programmatic details.
2.6
JADE Multi-agent Platform
JADE is a Java-based software framework that simplifies the implementation of multi-agent systems according to the ACL standard [19]. It includes two basic parts: a FIPA-compliant agent platform and software package for the development of agents in Java. The choice of the Java programming language is justified by the fact that it allows a perfect object-oriented programming within distributed heterogeneous environments, plus some other features such as object serialization, reflection API and remote method invocation (RMI).
3.
SYSTEM ARCHITECTURE
The system developed allows in a short time to categorize patients into one of these three groups: AD, MCI or CS. For that it uses a multi-class predictor combining three binary SVM-based classifiers. The algorithm is divided into several steps that can be performed by distinct agents allowing parallel computation. To ensure parallelization and coordination between agents, a multi-agent system was developed using the JADE platform.
3.1
Prediction Algorithm
Fig 2: The prediction algorithm
3.2
Multi-agent Implementation
[image:3.595.55.279.85.333.2]As mentioned before, we used the JADE multi-agent platform. JADE provides a distributed runtime environment, the agent and behavior (a task executed by an agent) abstractions, peer to peer communication and discovery mechanisms. As shown in figure 3 our system is composed of:
Fig 3: The multi-agent system architecture
3.2.1
Graphical user interface (GUI)
It allows the user to interact with the system, to check the input data and to visualize the results. The data is then transmitted to the Manager to start the prediction process of the introduced feature vector.
3.2.2
Manager
As its name suggests, this agent manages the prediction process. Ones the decision values obtained from each SVM-Predict agent, it returns the membership class (AD, MCI or CS) and display results in the GUI.
3.2.3
SVM-Predict
This agent calculates the decision value from the binary SVM-based classifier. Our system consists of three SVM-Predict agents related to the total number of pairwise classifiers.
4.
RESULTS AND DISCUSSION
We used the 5-fold cross-validation test to evaluate the performance of each binary SVM. For subjects, in each of the three sub-databases (CS vs. MCI, MCI vs. AD and AD vs. CS), we first mix up all the training and test sets together. Then we randomly pick up 5 subjects as test data and the rest (25 subjects) as train data. We also estimated the classification accuracy rate defined as the ratio of the number of correctly classified instances to the total number of instances in the test set. On the other hand, we experimentally compared the performance between different SVM kernels and between feature extraction processes described in section 2.4. Tables 2, 3, 4 and 5 show the classification results of the three binary SVMs (CS/MCI, MCI/AD and AD/CS).
[image:3.595.56.273.454.647.2]For our feature extraction process, the best performance results were obtained with polynomial kernel of degree 3, but are not far away from the results of the linear SVM. Experiments show also that the best accuracy of the algorithm can reach 100\% by using our feature extraction method.
Table 2. Classification results with a linear kernel
SVM Agent 1 15 CS vs. 15 MCI
SVM Agent 2 15 MCI vs. 15 AD
SVM Agent 3 15 AD vs. 15 CS
T h e to ta l p ro ce ss in g ti me (ms ec. ) 5 -fo ld cro ss -v al id at io n (% ) T h e to ta l p ro ce ss in g ti me (ms ec. ) 5 -fo ld cro ss -v al id at io n (% ) T h e to ta l p ro ce ss in g ti me (ms ec. ) 5 -fo ld cro ss -v al id at io n (% )
187 93.33 187 100 188 100
Table 3. Classification results with a polynomial kernel of degree 3
SVM Agent 1 15 CS vs. 15 MCI
SVM Agent 2 15 MCI vs. 15 AD
SVM Agent 3 15 AD vs. 15 CS
T h e to ta l p ro ce ss in g ti me (ms ec. ) 5 -fo ld cro ss -v al id at io n (% ) T h e to ta l p ro ce ss in g ti me (ms ec. ) 5 -fo ld cro ss -v al id at io n (% ) T h e to ta l p ro ce ss in g ti me (ms ec. ) 5 -fo ld cro ss -v al id at io n (% )
187 100 218 100 187 100
Table 4. Classification results with a RBF kernel
SVM Agent 1 15 CS vs. 15 MCI
SVM Agent 2 15 MCI vs. 15 AD
SVM Agent 3 15 AD vs. 15 CS
T h e to ta l p ro ce ss in g ti me (ms ec. ) 5 -fo ld cro ss -v al id at io n (% ) T h e to ta l p ro ce ss in g ti me (ms ec. ) 5 -fo ld cro ss -v al id at io n (% ) T h e to ta l p ro ce ss in g ti me (ms ec. ) 5 -fo ld cro ss -v al id at io n (% )
[image:4.595.47.290.222.324.2]188 93.33 188 73.33 187 96.66
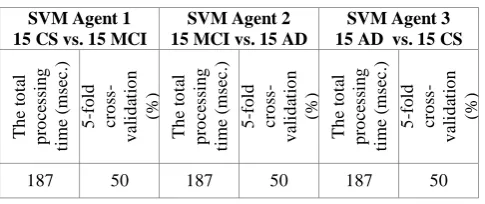
Table 5. Classification results with a sigmoid kernel
SVM Agent 1 15 CS vs. 15 MCI
SVM Agent 2 15 MCI vs. 15 AD
SVM Agent 3 15 AD vs. 15 CS
T h e to ta l p ro ce ss in g ti me (ms ec. ) 5 -fo ld cro ss -v al id at io n (% ) T h e to ta l p ro ce ss in g ti me (ms ec. ) 5 -fo ld cro ss -v al id at io n (% ) T h e to ta l p ro ce ss in g ti me (ms ec. ) 5 -fo ld cro ss -v al id at io n (% )
187 50 187 50 187 50
The table below shows that the best accuracy of the whole algorithm (100%) was achieved when using our feature extraction process for SVM with polynomial kernel of degree 3. On the other hand, the proposed method gives good speed-up in term of total time required for training, testing and evaluation.
Table 6. Accuracy results of the prediction algorithm
SVM kernel Global accuracy (%)
The total processing time (msec.)
Linear 84,9 178
Polynomial 100 125
RBF 62,26 109
Sigmoid 7,54 109
5.
CONCLUSION
In this paper, we presented an automated method for classification of AD, MCI and controls subjects from 3D structural MRI data sets. The classifier developed is based on SVM binary models using data analyzed by combining the VBM approach and neuropsychological tests to categorize the three groups of subjects. To reduce the total processing time, we used the JADE multi-agent platform. The results obtained were very satisfactory in terms of both accuracy and computational speed. It would be interesting to see how the results differ by using other feature selection methods and large MRI data sets. There are also some other possible extensions such as increasing the number of classes, increasing the number of agents involved in computational tasks and using another method for the final prediction step.
6.
REFERENCES
[1] M. Zenati, (22/09/2011) “Maladie d’Alzheimer”, Journal El-Moudjahid, N° 14313 Nouvelle Série, ISSN 1111-0287, page 11, http://www.elmoudjahid.com/
[2] R. Cuingnet, E. Gerardin, J. Tessieras, G. Auzias, S. Lehéricy, M-O. Habert, M. Chupin, H. Benali, O. Colliot & The Alzheimer's Disease Neuroimaging Initiative, (2011) “Automatic classification of patients with Alzheimer's disease from structural MRI: A comparison of ten methods using the ADNI database”, NeuroImage, 6 (2): 766-781.
[3] E. Ceyhan, C. Ceritoglu, M. F. Beg, L. Wang, J. C. Morris, J. G. Csernansky, M. I. Miller & J. T. Ratnanather, (2008) “Analysis of metric distances and volumes of hippocampi indicates different morphometric changes over time in dementia of alzheimer type and nondemented subjects”, Technical Report # KU-EC-08-3, arXiv:0806.1473v2.
[4] O. Querbes, F. Aubry, J. Pariente, J. A. Lotterie, J. F. Demonet, V. Duret, M. Puel, I. Berry, J. C. Fort & P. Celsis, (2009) “Early diagnosis of alzheimer’s disease using cortical thickness: impact of cognitive reserve”, Brain, 132(8):2036–2047.
[5] B. Magnin, L. Mesrob, S. Kinkingnehun, M. Pelegrini-Issac, M. Sarazin, B. Dubois, S. Lehericy & H. Benali, (2009) “Support vector machine-based classification of Alzheimer’s disease from whole-brain anatomical MRI”, Neuroradiology, 51(2):73-83.
[6] L. Mesrob, B. Magnin, O. Colliot, M. Sarazinb, V. Hahn-Barma, Bruno, P. Gallinari, S. Lehéricy, S. Kinkingnéhun & H. Benali. (2009) “Identification of Atrophy Patterns in Alzheimer’s Disease based on SVM Feature Selection and Anatomical Parcellation”, Annals of the BMVA Vol. 2009, No. 7, pp 1−9.
[7] J. Ashburner & K. J. Friston, (2000) “Voxel-Based Morphometry - The Methods. NeuroImage”, 11(6):805-821.
[8] A. Mechelli, C. J. Price, K. J. Friston & J. Ashburner, (2005) “Voxel-Based Morphometry of the Human Brain: Methods and Applications”, Current Medical Imaging Reviews, Vol. 1, No. 1, pp 105-113.
[9] B. M. French, M.R. W. Dawson & Allen R. Dobbs, (1997) “Classification and staging of dementia of the Alzheimer type: a comparison between neural networks and linear discriminant analysis”, Archives of. Neurology, 54(8):1001-1009.
[10] A. Savio, M. García-Sebastián, C. Hernández, M. Graña, & J. Villanúa, (2009) “Classification Results of Artificial Neural Networks for Alzheimer's Disease Detection”, Intelligent Data Engineering and Automated Learning- IDEAL, Emilio Corchado, Hujun Yin (Eds) LNCS 5788, pages 641-648.
[11] P. P. M. Oliveira Jr., R. Nitrini, G. Busatto, C. Buchpiguel, J.R. Sato & E. Amaro Jr., (2010) “Use of SVM Methods with Surface-Based Cortical and Volumetric Subcortical Measurements to Detect Alzheimer’s Disease”, Journal of Alzheimer’s Disease 19:1263–1272.
[12] A.Savio, M. Graña & J. Villanúa, (2011) “Deformation based features for Alzheimer's disease detection with linear SVM”, HAIS (2): 336-343.
GIC-UPV-EHU-RR-2010-10-14, Grupo de Inteligencia Computacional UPV/EHU.
[14] D. S. Marcus, T. H. Wang, J. Parker, J. G. Csernansky, J. C. Morris, & R. L. Buckner, (2007) “Open Access Series of Imaging Studies (OASIS): Cross-sectional MRI Data in Young, Middle aged, Nondemented, and Demented Older Adults”, Journal of Cognitive Neuroscience, 19(9):1498-1507, PMID: 17714011.
[15] J. L. Whitwell, (2009) “Voxel-Based Morphometry : An Automated Technique for Assessing Structural Changes in the Brain”, The Journal of Neuroscience, 29(31):9661–9664.
[16] G. B. Frisoni, C. Testa, A. Zorzan, F. Sabattoli, A. Beltramello, H. Soininen, & M. P. Laakso, (2002) “Detection of Grey Matter Loss in Mild Alzheimer's Disease with Voxel Based Morphometry”, Journal of Neurology, Neurosurgery & Psychiatry, 73(6):657-664. [17] G. F. Busatto, G. E. J. Garrido, O. P. Almeida, C. C.
Castro, C. H. P. Camargo, C. G. Cid, C. A. Buchpiguel,
S. Furuie & C. M. Bottino, (2003) “A Voxel-Based Morphometry Study of Temporal Lobe Gray Matter Reductions in Alzheimer's Disease”. Neurobiology of Aging, 24(2):221-231.
[18] J. Ashburner, G. Barnes, C-C. Chen… (2011) “SPM8 Manual (Statistical Parametric Mapping)”, Functional Imaging Laboratory, Wellcome Trust Centre for
Neuroimaging, London, UK,
http://www.fil.ion.ucl.ac.uk/spm/
[19] F. Bellifernine, G. Rimassa & A. Poggi, (1999) “JADE - A FIPA-compliant Agent Framwork”, PAAM99, http://jade.tilab.com/
[20] K-B. Duan & S. S. Keerthi, (2005) “Which Is the Best Multiclass SVM Method? An Empirical Study”, Lecture Notes in Computer Science, vol. 3541, pp. 278-285. [21] C.-W. Hsu & C.-J. Lin, (2002) “A comparison of