Text Extraction and Recognition from Image
using Neural Network
C. Misra
School of Computer Application KIIT University Bhubaneswar-751024, India
P.K Swain
School of Computer Application KIIT University Bhubaneswar-751024, India
J.K Mantri
Dept. of Computer Science & Application
North Odisha University, Baripada, India
ABSTRACT
Extraction and recognition of text from image is an important step in building efficient indexing and retrieval systems for multimedia databases. Our primary objective is to make an unconstrained image indexing and retrieval system using neural network. We adopt HSV based approaches for color reduction. This approach show impressive results. We extract a set of features from each ROI for that specific color plane and use them further in a feature-based classifier to determine if the ROI contains text or non-text blocks. The blocks identified as text are next given as input to an OCR. The OCR output in the form of ASCII characters forming words is stored in a database as keywords with reference for future retrieval.
Keywords
Text extraction, recognition, multimedia, indexing, image, retrieval.
1.
INTRODUCTION
The volume of multimedia database has increased exponentially due to the technology advancement in the area of computer processor and storage devices. Unfortunately these large multimedia repositories are not indexed and are accessible only by sequential scanning of entire multimedia archive. To navigate or browse a large multimedia database is cumbersome and time consuming. The popular web based search engines like Google, Yahoo and AltaVista provide users with a content-based search model in order to access the World Wide Web pages and multimedia. But in this typical text based search engine, images and videos are manually annotated by identifying limited number of keywords that describe their visual information and content. However, for image and video retrieval, it is not an effective solution. Therefore, need an efficient and true content based or pattern based browsing and navigation system, through which users will be able to access multimedia material of interest. As discussed earlier, in text based search engine, images and videos are manually annotated by identifying limited number of keywords that describe their visual information and content. Some images may be related differently by different people. Secondly, it is not always possible to identify all desired keywords by manual text descriptors. Thirdly, sequential examination of entire video content for large growing multimedia archives is required for identifying keywords. This manual indexing process of image content by document lists will be increasingly tedious and time consuming. This way of manual indexing is not cost effective and the efficiency of indexing becomes highly dependent on quality of manpower and finally, it is language dependent.
Text has compact, distinctive visual characteristics i.e. a set of symbols with distinct geometrical and morphological features. Secondly text may be of different font, color or language is usually closely related to its semantic content and maintaining some specific pattern in the image. Hence, text is often considered to be a strong candidate for use as a feature in high level semantic indexing and content-based retrieval. Text is useful in performing text analysis like in broadcasting, to display name of the program, anchor’s name, program introductions, special announcements. In an advertisement product’s name, name of the companies selling the products are displayed. In weather forecast, temperature, humidity of different places is shown. In other cases objects and locations can be identified by text from implicit and explicit text annotations such as in a sports event players can be identify by their name and number in their jerseys, vehicles can be spotted by their license plate, a station or streets or shops can be located by their bill boards or hoardings.
2.
RELATED WORK
In response to such a need many researchers are showing inclination to embark on new expedition to develop efficient tools on content-based search and retrieval like QBIC[1], Virage[2], NeTra[3], SIMPLIcity[4] may be referred for image retrieval. In [5] a text extraction method using color clustering and CC analysis from scene images is presented. They apply separate approaches for color images and gray images to detect candidate text regions. For color images geometrical clustering is used to group the same color as a preprocessing step. For gray level image, Canny operator is used to detect edges in images. To filter out non-text components and to mark the text boundary accurately, long line removal and repetitive run length smearing is used on gray images. Their performance is unsatisfactory if the background contains similar periodic structure like text region.
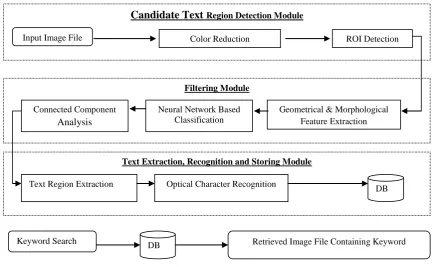
Fig 1: (a) Block diagram of text detection, extraction, recognition and storing (b) Block diagram of video retrieval based While this method is well suited for processing newspaper
advertisements and web images, it is not so efficient for detecting text with complex and cluttered background, small font. A morphological technique is used in [7] to detect text from color and gray scale images. Color images transform to intensity images () as follows:
= .299R + .587G + .114B
Here R, G, and B are red, green, and blue components of the input color image. In the next step, gradients are computed to detect edges. A global non histogram-based threshold technique is used to binarize the resulting edge image. Spatially close edge pixels are grouped by dilation method while non-text components are filtered out by erosion method. This algorithm is well suited for skewed text and text with different orientations. However, this method works on the assumption that most of the text is with high contrast and characters have moderate size. Secondly, At least few characters should be present in a text string for meaningful text representations. The other drawbacks are that no quantitative performance numbers are reported and performance of their algorithm is shown based on a few images. A learning based algorithm to detect text from still images and videos is design and studied in [8]. They employ gray level constraints, morphological constraints, and geometrical constraints sequentially to detect text components in images. In [9] a method is presented for automated text localization based on bootstrap neural network. To facilitate the detection of candidate text regions, color image edge operator (CED) is used on the Y.I.Q color space of the image. They employ morphological constraints and analyze horizontal and longitudinal projection profile to classify text block and non-text block coarsely. In order to reduce the false positive, they employ a multi channel Gabor filter to extract feature vector. An artificial neural network (ANN) is used as a feature-based classifier to determine if the probable block contains text or non-text elements.
In [10] a top down approach in which multiple cues are used for detecting text blocks from extracted frames in a video is illustrated. They initially perform projection profile analysis on a HSV based color-reduced image. For each resulting color plane, regions of interest possibly containing text blocks are detected.
A color-based clustering method for detecting text in a image is discussed in [11]. They consider homogeneous color and sharp edges for detecting text region in an image. For selecting the best color plane, they emphasize the contrast difference between the foreground color and background color.
3.
DETAILED DESCRIPTION OF THE
TEXT DETECTION USING PATTERN
RECOGNITION IN IMAGES
In this section we give a detailed description of the building blocks as depicted in figure 1.
3.1
Color Reduction
We propose a novel color reduction technique using HSV color space where each pixel contributes either hue (H) or intensity (V) value depending on its saturation (S). The HSV color space is conceptually different from the widely known RGB color space since it disassociates the intensity component or luminance from the color information
A three dimensional representation of the HSV color space may be considered as a hexacone, where the central vertical axis represents the intensity. Hue lies in the range [0, 2] relative to the red axis with pure red at angle 0, pure green at 2/3, pure blue at 4/3 and pure red again at 2. Saturation is the depth or purity of the color and it is measured as a distance from the central axis with the value between 1 at the outer surface for a completely saturated color and 0 at the center, which represents a completely unsaturated color. Each image can be represented as a set of triplet as follows:
I = {(
pos
, [t | g], Val)}
Text Extraction, Recognition and Storing Module Filtering Module
Candidate Text
Region Detection ModuleInput Image File Color Reduction ROI Detection
Geometrical & Morphological Feature Extraction
Neural Network Based Classification
Classification Connected Component
Analysis
Text Region Extraction Optical Character Recognition
DB
[image:2.595.78.515.64.331.2]Here pos denotes position of the pixel, [t | g] signify whether the pixel is a “true color” component i.e. a pixel whose hue is the dominant component or as a “gray color” component whose intensity is the dominant component. Again, it is observed that the difference in hue of a pixel is visually more prominent compared to that of saturation. We, therefore, consider either its hue or intensity value as the prevailing feature based on its saturation values. For low values of saturation or intensity, we can approximate a color by a gray value specified by the intensity level, while for higher saturation the color can be approximated by its hue. Again if the saturation value is high and hue value is equal to 0 we consider that the gray value is dominant component for that pixel. The algorithm for computing the “true color” and “gray color” may be written as follows:
For each pixel in the image Read the RGB value Convert RGB to HSV
If ((S < Min_Sat) or (V <Min_lum_fctr*no_of_color)) V= Round (V/DIV_FCTR+57)
Else if ((H > float (0.0)) H= Round (H* MUL_FCTR) Else
V= Round (V/DIV_FCTR+57)
Here number of color is the maximum intensity, usually 256 and Min_Sat is the minimum saturation value. Min_lum_fctr is the minimum luminance factor. Min_Sat and Min_lum_fctr are assigned values 0.2 and 0.25 respectively and work well for our experiments.
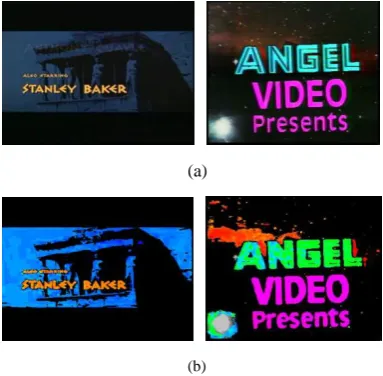
(a)
(b)
Fig 2: (a) Original image, (b) HSV based color reduced image
The total number (NH) of true color components is determined by the value of quantization levels. Since hue value lies between 0 and 2, the total numbers (NH) of true color components can be computed as follows:
NH= Round (2××MUL_FCTR+1)
Here MUL_FCTR is the multiplying factor that determines the quantization level for hue. MUL_FCTR has been empirically chosen to be 8. Similarly the total number of component (NV) representing gray values can be determined as follows:
NV = Round (V/DIV_FCTR+1)
Here V represents the maximum value of the intensity and set to 255 and DIV_FCTR determines the number of quantized gray levels. The value of DIV_FCTR is 32. The total number (NC) of true color and gray color can be computed as follows:
NC =NH+NV
As we have mentioned earlier we set MUL_FCTR=8 and DIV_FCTR= 32 and total number of true color and gray color component will be 59 in our proposed color reduced image. In figure 2 we have shown the original images and their color reduced images.
3.2
ROI Identification and Feature
Extraction
For each ROI, a number of features are extracted for each color. Before feature extraction, the regions of interest are binarized.
Let vij denote the color value of the pixel (i,j) after color reduction. For a given color vk, v, binarization is done as follows:
for i=1 to ROI_Height for j = 1 to ROI_Width
if vi,j= vk Set v i,j=1 else
Set v i,j=0
Thus, when we process any given color, we set all pixels in the ROI of that color to 1 and the rest to 0.
(a)
(b)
(c)
(d)
Fig 3: Foreground extraction from a color image (a) Original image (b) Element image with color value = 5 (c) Element image with color value = 10 (d) Element image with color value = 31
In figure 3 we have shown the original image and their image part for different color plane. Next for extracting feature from element images, we consider 10 features for each ROI which are briefly mentioned below.
[image:3.595.349.500.380.630.2] [image:3.595.68.260.394.582.2]feature for distinguishing between text and non-text components. It is defined as the ratio of height and width of text component. So there are reasonable number of text components in an ROI of certain height and width (aspect-ratio). The number of components in an ROI is proportional to length (w) of the ROI and inversely proportional with the height (H) of the ROI. Therefore, initially we count the number of components (N) in an ROI which maintain aspect ratio within a range and derive the size analysis feature value N× Ar where
Ar =
W
H
The algorithm for calculating size analysis feature is as follows:
Co-ordinates of each component are extracted using connected component analysis from each ROI. Aspect ratio (Ac) is determined for each component
in an ROI and the aspect ratio (Ar) of ROI is derived.
Count the number of component (N) in an ROI if Ac is within a range Tc and Tf. Here Tc and Tf are pre-defined values. Tc and Tf are 2.0 and 0.18, respectively and worked well in our experiments. For each ROI size analysis feature value is
calculated as follows:
Size analysis = N× Ar
Contrast changes per unit length- Usually for better visibility, color of text components maintains high contrast with its background color. Therefore, in text rich area of an image there are frequent contrasts alternations compare to rest part of the images. So to identify text rich ROI, we horizontally scan the ROI and count number of contrast changes in an ROI. Finally, we calculate contrast changes for unit length.
Inter-character gap- Text components maintain inter-character gaps to separate inter-character components from each other in a word. In a test string there are gaps between words. It is found that number of inter-character gaps is proportional with the length of the text string and inversely proportional with the height of the text component. Therefore, initially we count the number of inter-character gaps (Ng) in an ROI by applying vertical projection profile analysis and derive the feature inter-character gap for each ROI as follows:
Inter-character gap (F1) = Ng × Ar HereAr is the aspect ratio of the ROI.
Foreground pixel density– It is found that texts are represented by foreground color which is different from background color of the image. We presume that in each ROI there are high densities of foreground pixels for some specific color planes. The ROI is binarized for that specific color plane. Therefore, foreground pixel density is defined as the number of pixels per unit area in an ROI whose binarized value is 1.
[image:4.595.310.549.96.305.2]Ratio of foreground pixel to background pixel – It is observed that text components maintain regular shape and reasonable size. Therefore, it is found that in text rich area of an image a ratio of text area and non-text area can be used to determine if the ROI contains text or non-text blocks. Our proposed method for calculating ratio of foreground area and
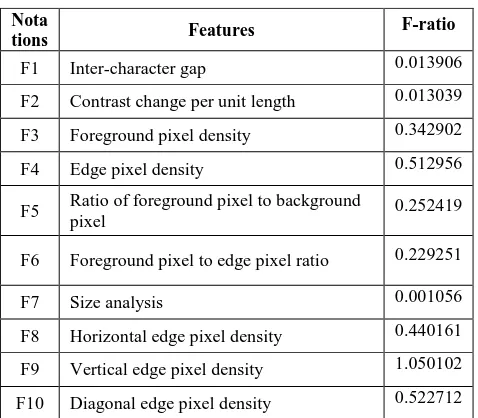
Table 1. F-Ratio Values Extracted Features
background area in a binarized ROI is comprised of two stages: calculation of foreground pixel density, background pixel density and computation ratio between foreground pixel density and background pixel density.
Edge pixel density – It is found that in most of the text extraction systems from images edge based features play a predominant role. Edge pixels are defined as the ones for which one of its eight neighbors has a binarized value of 0. Let (i,j) denote an image pixel at location i, j. There are eight neighbors of (i,j) at a distance d=1 are denoted as 1,j-1), (i-1,j), (i-1,j+1), (i,j-1), (i,j+1), (i+1,j-1), (i+(i-1,j), (i+1,j+1). If any of these eight neighbors value is 0 it is considered as edge pixel. Edge pixel density is defined as number of edge pixel per unit area.
Foreground pixel to edge pixel ratio – Ratio of foreground pixel density to edge pixel density is computed.
Edge pixel categorization- An edge pixel (ei,j) can be grouped in the following three categories
Horizontal edge pixel density-Horizontal edge pixels are defined as the ones for which one of its right or left neighbors, which are positioned horizontally has a binarized value of 0. Using mathematical expression it can be formulated as follows:
ei,j=
1} -{1, z
z]
j
e[i,
so that 0 ei,j 2Horizontal edge pixel density is the number of horizontal edge pixels in unit area of an ROI.
Vertical edge pixel density- Vertical edge pixels can be defined as the ones for which one of its two vertically positioned neighbors has a binarized value of 0. If (i,j) denotes ordinate of a pixel in an image (i-1,j), (i+1,j) denote co-ordinates of vertical edge pixel. Using mathematical expression it can be formulated as follows:
ei,j=
1} -{1, z
j]
z,
e[i
so that 0 ei,j 2 Notations Features
F-ratio
F1 Inter-character gap 0.013906
F2 Contrast change per unit length 0.013039
F3 Foreground pixel density 0.342902
F4 Edge pixel density 0.512956
F5 Ratio of foreground pixel to background
pixel 0.252419
F6 Foreground pixel to edge pixel ratio 0.229251
F7 Size analysis 0.001056
F8 Horizontal edge pixel density 0.440161
Vertical edge pixel density is the number of vertical edge pixels in unit area of an ROI.
Diagonal edge pixel density- Diagonal edge pixels are defined as the ones for which one of its four neighbors, which are positioned diagonally, has a binarized value of 0. Using mathematical expression it can be formulated as follows:
ei,j=
1} -{1, z2 z1,z2]
j
z1,
e[i
,so that 0 ei,j 4
On the basis of grouping we count the number of diagonal edge pixels in an ROI and calculate the diagonal edge pixel density in the unit area of an ROI.
Evaluating performance of feature set
The learning based methods depend on the quality of training data and on the extracted features which are fed into the learning machine. However in text detection scheme, texts appear in various sizes, fonts, styles, colors and intensities and it is very hard to train an unconstrained generalizing system. In order to optimize the performance of the neural network system by reducing the dimension of feature vector and improving the classification result, we compute contribution of each feature in the feature set. The reduction of feature vector dimension also increases time efficiency due to computation of less number of feature vectors.
Our feature set selection based on contribution in the classification process is comprised of two stages: contribution determination of each feature in the feature set and optimum feature set selection.
Contribution determination of each feature in the feature set
We use F-ratio based method to determine the contribution of each feature in the feature set. Contribution of a feature is defined as the feature’s impact on the discrimination of text and non-text classes. F-ratio can be defined as a ratio between variance of means between classes and the mean of variances within class. The criteria for better separation between text class and non-text class are increase in distribution of mean value between text class and non-text class or narrow gap in value within each class. The computations of the F-ratio as follows
n j 1 j n j 1 j 2 nt ntj 2 t tj 2 nt g 2 t gX
X
n
Ratio
F
Here n is the number of text and non-text data. µt and µnt represent mean of text components and non-text components, respectively. µg represents global mean and calculate as follows
µg = µt + µnt
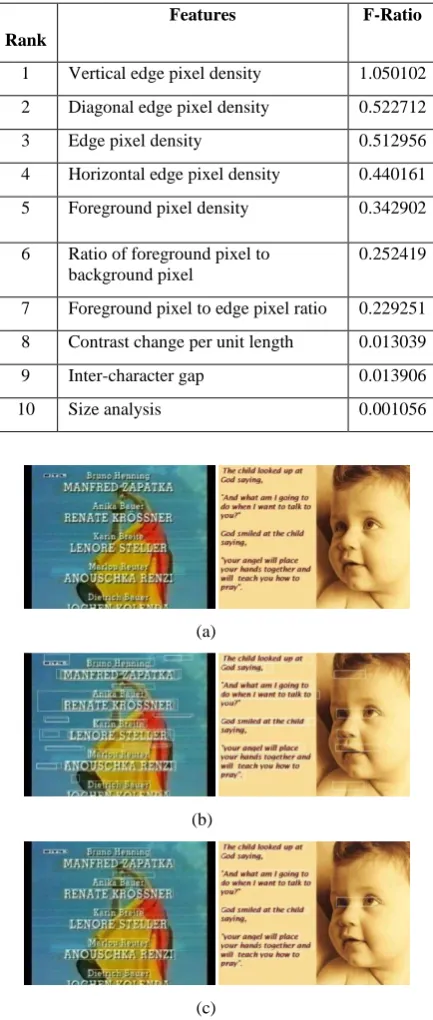
In Table 1 we show the F-ratio values of ten features which are computed from 75 text and 75 non-text data. The higher value of F-ratio indicates better impact on classification process. In Table 1 F-ratio value of vertical edge pixel density is higher then other features. Hence vertical edge density has maximum impact on the classification process to distinguish an ROI, which contains text or non-text components.
Optimum feature set selection
Next Singular Value Decomposition (SVD) method is applied on the training data set to select the optimum feature set for our feature based classifier. Singular Value Decomposition can be expressed as follows:
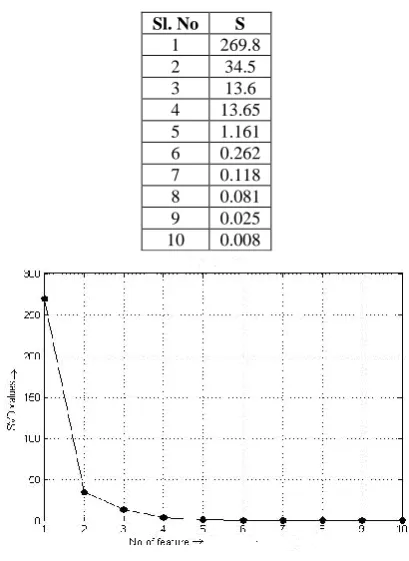
[image:5.595.325.530.210.491.2]S= SVD(X) Here X is the data set, containing features values of text and non-text training samples and S indicates the returned vector of singular values for the feature set. In Table 2 we show the returned vector value(S) of the feature set.
Table 2. SVD Values for Different Features Sl. No S
1 269.8 2 34.5 3 13.6 4 13.65 5 1.161 6 0.262 7 0.118 8 0.081 9 0.025 10 0.008
Fig 4: SVD value for extracted features
In Figure 4, we plot SVD values for different features. It may be observed from the figure that there are certain changes in values from sixth or seventh position. We consider seven features for our methodology as in our algorithm seven features give better performance than six. Table 3 shows the order according to ranking and we consider seven features from top as final feature set for our application. We have experimented with HSV based feature set also and it shows the same result.
3.3
Neural Network Based Classification
[image:5.595.71.275.564.611.2]Table 3. Extracted Features Based on Ranking
Rank
Features F-Ratio
1 Vertical edge pixel density 1.050102 2 Diagonal edge pixel density 0.522712
3 Edge pixel density 0.512956
4 Horizontal edge pixel density 0.440161
5 Foreground pixel density 0.342902
6 Ratio of foreground pixel to background pixel
0.252419
7 Foreground pixel to edge pixel ratio 0.229251 8 Contrast change per unit length 0.013039
9 Inter-character gap 0.013906
10 Size analysis 0.001056
(a)
(b)
(c)
Fig 5: Various stages of text extraction from an image (a) Original (b) After ROI detection (c) Output of MLP based classification
In the learning phase, features are extracted from data set consists of both text and non-text regions. The geometrical and morphological features are extracted from each region of interest and next, used for classification by a multilayer perceptron. Such regions are manually checked and assigned the corresponding ground truth. We have used 200 text regions and an equal number of non-text regions for training the MLP. The MLP contains 7 inputs, one hidden layer of 10 units and 1 output. Here the outputs of each neuron in previous layer are computed by passing pre-defined weighted sum of its input through a non-linear transformation function. The output represents whether the input block contains text or
non-text. The MLP was trained with different initial conditions and was found to have similar performance in each case.
The training and testing were performed using the back propagation algorithm. Back propagation algorithm trains the system by iterative processing and minimizes the mean squared error between prediction and actual class by modifying the weighted values in backward direction. The network was trained until the MSE error descends below 10-3 or maximum iteration reach 70,000 epochs. We have trained our system by caption text and scene text of different font, size, color and intensity. In figure we have shown some examples of text regions and non-text regions for different stages. In (a) and (b) we show respectively original images and probable text area. In Figure 5(c) we observed there are lots of improvements in text detection after trained through neural network based classification of text and non-text blocks.
3.4
Text Extraction and Recognition
The remaining components are marked as text blocks. These text blocks cannot serve as a direct input to an optical character recognition (OCR) system). Existing segmentation techniques built in the OCR systems are not capable of handling the complexity of color images in which such text regions are embedded. Instead, it is essential to build specialized methods to enhance the image quality for identifying the text blocks from images
_proq ra m?
who w;ll prorecr
me?
You_ on_el will plocc
Fig 6: Examples of binarized images and their OCR based output.
Our proposed method consists of four steps namely as follows:
Color polarity detection
Binarization of the cropped image. Removal of touching characters and noise. OCR based identification and storing in a database
4.
CONCLUSION
In this paper we have presented a comprehensive approach for the detection of text region and recognition of texts from images A great deal of work will have to be done to make the system more efficient. First, we plan to extend our work in the compressed domain processing to make it even faster. Secondly, our system cannot detect non-horizontally text in an image. Thirdly, we have to investigate the improvement of our method for better tracking of text with complex motion. Fourthly, the recognition accuracy of our system is poor for text with complex background. Finally, a more accurate OCR will also improve the quality of retrieval further.
5.
REFERENCES
[1] Niblack, W. 1993. The QBIC Project: Querying Images by Content Using Color, Texture and Shape. In Proc. Storage and Retrieval for Image and Video Databases, SPIE Bellingham, Wash,173-187
[2] Bach, J. R, Fuller, C., Gupta, A., Hampapur, A., and Horowitz, B. 1996. Virage Image Search Engine: An Open Framework for Image Management. In Proc. of SPIE-1996, 76-87.
[3] Ma, M. Y., and Manjunath, B. S. 1999. Ne Tra: A Toolbox for Navigating Large Image Databases. Journal Multimedia System, Springer Berlin, 184-198.
[4] Wang, J.Z., Li, J., and Wiederhold,G. 2001, SIMPLIcity: Semantics-Sensitive Integrated Matching for Picture
Libraries. IEEE Transactions on Pattern Analysis and Machine, 947-963.
[5] Byun, H.R., Roh, M.C., Kim, K.C., Choi, Y.W., and Lee, S.W. 2002. Scene Text Extraction in Complex Images. In Proc. DAS-2002, LNCS 2423. 329-340.
[6] Jain, A.K., and Yu, B. 1998. Automatic Text Location in Images and Video Frames, Pattern Recognition Society. Vol. 31(12), 2055-2076.
[7] Hasan, Y. M.Y., and Karam, L.J. 2000. Morphological Text Extraction from Images. IEEE Transactions on Image Processing, Vol 9(11), 1978-1982.
[8] Wolf, C., and Jolion, J.M. 2004. Model Based Text Detection in Images and Videos: A Learning Approach. Technical Report LIRIS RR.
[9] Hao, Y., Yi, Z., Zeng-Guang H., and Min, T. 2003. Automatic Text Detection in Video Frames Based on Bootstrap Artificial Neural Network and CED. Journal of Winter School of Computer Graphics (WSCG), Vol. 11. [10] Misra, C., and Swain, P.K. 2011. An Automated HSV
Based Text Tracking System from Complex Color Video. LNCS,Vol 6536, 255-260.