Methodologies to Develop Quantitative Risk Evaluation
Metrics
Thaier Hamid, PhD.
University of Bedfordshire, UK
Carsten Maple
University of Bedfordshire, UK
Paul Sant, PhD.
University of Bedfordshire, UK
ABSTRACT
The goal of this work is to advance a new methodology to measure a severity cost for each host using the Common Vulnerability Scoring System (CVSS) based on base, temporal and environmental metrics by combining related sub-scores to produce a unique severity cost by modeling the problem‟s parameters in to a mathematical framework. We build our own CVSS Calculator using our equations to simplify the calculations of the vulnerabilities scores and to benchmark with other models. We design and develop a new approach to represent the cost assigned to each host by dividing the scores of the vulnerabilities to two main levels of privileges, user and root, and we classify these levels into operational levels to identify and calculate the severity cost of multi steps vulnerabilities. Finally we implement our framework on a simple network, using Nessus scanner as tool to discover known vulnerabilities and to implement the results to build and represent our cost centric attack graph.
General Terms
Vulnerabilities, security. CVSS. Quantitative security metrics.
Keywords
Quantifying security, CVSSv2, Overall CVSS score, Attack graph.
1.
INTRODUCTION
The Oxford dictionary defines a metric as “a system or standard of measurement”. From this meaning the measurement is used to clarify the term metric. Quantitative security metrics could present a clear picture on security structure and support security decisions and also assist experts to understand the capability of a system to carry on a task under attack. Risk assessment could be implemented to measure system reliability and to benchmark different security solutions. A measureable risk assessment is the main tool we used to determine if the additional budget should be allocated to afford more secure features. The objective of risk assessment is to measure the likelihood of exploitability and its consequences (impact). We can achieve our objective by assessing the probability that manifests threats in terms of access required and attack complexity and by weighting the impact of the occurrence with the damage potential, they may effect.
1-Compliance metrics: measures compliance with current security and privacy regulations and standards, such as HIPAA, Sarbanes-Oxley, GLBA, etc.
2-Resilience metrics: measures the resilience of controls relating to physical security, personnel security, IT security, and operational security both before and after a product, system or network is deployed.
3- Return on investment (ROI) metrics: measures the ROI in physical, personnel, IT, and operational security controls to guide capital investment.
There are a number of other security metrics systems accomplished by both commercial and noncommercial organizations. They each have their merits, but they differ in what they measure. For example, CERT/CC produces a numeric score ranging from 0 to 180 but considers such factors as whether the Internet infrastructure is at risk and what sort of preconditions are required to exploit the vulnerability [United States Computer Emergency Readiness Team (US-CERT). US-CERT Vulnerability Note Field Descriptions. The SANS vulnerability analysis scale considers whether the weakness is found in default configurations or client or server systems (SANS Institute. SANS Critical Vulnerability Analysis Archive). Microsoft‟s proprietary scoring system [2] tries to reflect the difficulty of exploitation and the overall impact of the vulnerability (Microsoft Corporation. Microsoft Security Response Center Security
Bulletin Severity Rating System). The Common
Vulnerability Scoring System (CVSS) gives an open structure for communicating the individualities and impacts of IT vulnerabilities.
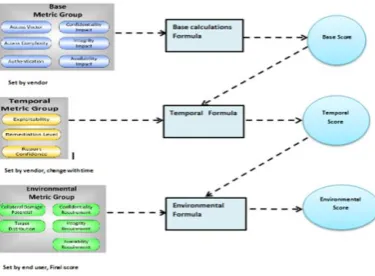
The CVSS model is aimed at providing the end user with a complete merged score representing the severity and risk of a vulnerability. It is resultant from metrics and formulas. The metrics are in three different groupings that can be quantitatively or qualitatively measured. Base Metrics contain qualities that are essential to any given vulnerability that do not change over time or in different environments. Temporal Metrics contain individualities of a vulnerability which change over the lifetime of a vulnerability. Environmental Metrics comprises those characteristics of a vulnerability which are tense to an implementation in a specific user‟s environment. The National Vulnerability Database (NVD) and The Common Vulnerabilities and Exploits Database (CVE) provide specific CVSS scores for publicly known vulnerabilities.
1.1
Common Vulnerability scoring System
(CVSS)
Figure-1: The CVSS Model
1.2 Vulnerability Databases
Vulnerabilities classification is a joint effort of the Common Vulnerabilities and Exploits Database (CVE) and the MITRE Corporation, a non-profit organization managing national defense and research facilities, foundations, and projects. The Common Vulnerabilities and Exposures (CVE) list [1] an initiative to standardize vulnerability references and gives vulnerabilities a name in the form CVE-YYYY-XXXX, where YYYY is the year in which the vulnerability was first reported. This central database allows each of the vulnerabilities to have one unique identifier, a CVE id, such as “CVE- 2002-0649.” The use of unique identifiers reduces the complexity of the international security threat identification effort, in that there are fewer duplicate vulnerabilities circulating, enabling a cleaner, simpler network report to be generated. CVE serves as more of a dictionary of vulnerabilities than a database. The National Vulnerability Database (NVD) is one of NIST‟s important security assets for determining the severity of computer security risks. NVD is the sum of many other security databases, and utilizes the CVSS scoring system, allowing the fullest utilization of available public computer security risk analysis, and quantification methods via CVSS scores [4]. NVD is also linked with CVE, enabling comparison and expansion of NVD with CVE entries. The CVSS scores from NVD, and identified vulnerability signatures in NVD entries allow for this automated approach. NVD is used as the primary resource for finding vulnerabilities and determining their comparative severity and impact. Using NVD‟s information about the vulnerabilities, vulnerability signatures can be derived, enabling matching of network conditions to the extracted signatures, then matching to CVE IDs, and getting the CVSS base score from the NVD entries, scores can be acquired for each of the vulnerabilities which have been identified from the matching process. NVD provides a reputable, widely used, constantly updated, and openly available resource.
2.
QUANTITATIVE RISK
EVALUATION
The risk is defined to be a function of the probability (likelihood) and the severity (impact) of the probable breaches on the systems. The risk in IT systems could be exposed to Internet, Network [1], Servers and local host. Our prototype uses base, temporal, and environmental metric groups set in the CVSS to evaluate the risk rate. The initial exploitability metrics driven form CVSS base score (i.e. the base metrics associated to exploitability) captures access required (AV)
and attack complexity (AC) and authentication instances (Au). The corresponding values could be seen in Table -1. The initial exploitability is calculated as follows:
n base
V P AV AC Au
E 1
int ( , , )
We use CVSS version 2 released on June 20th, 2007 to produce unique quantities metric to measure the severity cost of a specific vulnerability. We base our methodology on the following facts driven from a careful consideration of different sub metrics.
1- If the attacker manages to exploit a specific vulnerability without causing any damage (impact) in terms of confidentiality, integrity and availability, then it is not logical to consider the risk weight as zero - considering the risk represented by impact times likelihood of exploitability - as the explosions in multi-step intrusions might lead to access another vulnerability inside or outside the system. The risk matrixes weighting will solve this problem in case there are no impact score of explosions. Distributed of likelihood of exploitability as follows:
25% assigned for access required (AV).
40 % assigned for attack complexity (AC).
35% assigned for authentication instances (Au).
2- As the impact measures the damage caused by vulnerability, we believe that the impact represents 70% of the total risk severity. Within the impact metric we distribute the weight on the different sub metrics as follows:
20% assigned for confidentiality value, which represent different impacts on informational exposé
35% assigned for integrity value as the attacker might modify or delete the data as impact.
45% assigned for availability value as the impact might indicate crash or total shutdown or reduction in the performance of the system. Using the Common Vulnerability Scoring System (CVSS) version 2 based on base, temporal, and environmental metrics by combining related sub-scores to produce a unique severity cost by modelling the problem‟s parameters in to a mathematical framework, ( for example in the temporal metrics, if the exploitability tools & techniques (E) sub metric touch the high score - the tools and techniques available on the Internet as information‟s or freeware) this will increase the score of Access Vector (AV).
Base
AV
E
temporal
In the same logic we reached the following relations:
Base Ac
temporal
RL
Base
Ac
temporal
RC
Once the Base and Temporal metrics are evaluated, the assessments are aggregated into one value of probability score calculated as shown below:
0.384422 * )) * 35 . 0 ( ) * * * 4 . 0 ( ), * * 25 . 0 ((
temporal temporal
temporal Ac RL RC Au
E AV
Ev
The same justification applies to impact: The possible adjusted impact intrinsic to a vulnerability (i.e. the base metrics related to impact) can be increased or decreased depending on the security requirements driven from
environmental metrics as shown below:
Base (C) (CR)
(IR)environmental(I)Base
Base (A) (AR)environmental
Base (A) (CDP)environmental
Base Base Base,(I) ,(C) (A)
(TD)environmental
Target Distribution (TD) metric measures the percentage of systems that could be affected by the vulnerability. The parameters of this environmental sub metrics could be None (N), low (L), medium (M), high (H). The None (N): for example means that no target systems exists - in other words the impact scores on Confidentiality, Integrity and availability will be null. The same logic applies to low (L), medium (M), high (H). This sub metric has direct effect on A, I, C. 0.906 * )) * * * * 45 . 0 ( ), * * * 35 . 0 ( ), * * * 2 . 0
(( C CRenvi TDenv I IRenv TDenv A ARenvTDenv CDPenv
Iv
base base base
According to ISO 31010, the risk is derived by combining the consequences of a threat (impact) with the likelihood of its exploitability as follows:
Risk = Likelihood of an adverse event *Impact of the adverse event.
Since 1980 the above method has been fundamentally challenged. Specialists accept the main elements in the function but disagree on the production of likelihood and impact on calculating the risk, as the risk should be evaluated in terms of maximum impact on an adverse event. By establishing our model on the temporal and environmental information given in the CVSS metrics, we use easily accessible and publicly open context information that are regularly updated and maintained [1].
) , (I L f
Wi
To adjust the total Cost value using the risk matrix illustrated the following equation is used:
2 / ) ) 100 * ) 4.7619 * *
(( v V v
v E I W
Cost
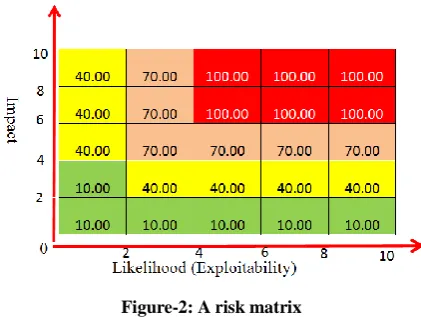
A risk matrix linking the two vectors likelihood and impact is a graphical description of different risks in a relative way. The matrix uses four levels of weights to classify the ranks of
[image:3.595.323.542.294.414.2]different types of risks.
Figure-2: A risk matrix
1- Level 1: (100): A vulnerability that will allow an intruder to immediately gain privileged access (e.g. Administrator,
root) to the system. For example Buffer overflow from local or remote system
2-Level 2 (70): Vulnerabilities that allow local or remote users to increase their privileges on a system or access confidential information such as company financial records or user passwords are usually considered moderate risks
3-Level 3 (50): vulnerability like a Denial-of-Service attack.” Generally, do not compromise the system beyond a Denial-of-Service. This type of condition is often inherent in running a particular service.
4-Level 4 (10): A vulnerability that provides information to an intruder that could lead to further compromise attempts Information about the target is gathered.
[image:3.595.61.272.576.734.2]We build our own CVSS Calculator using our equations to simplify the calculations of the vulnerabilities scores and to benchmarking with other models as shown in Figure-3as you can see The CVSS scores range from [0, 100] with the higher the worse security.
Figure-3: Our CVSS Calculator
Definition 1 (Maximum cost) if we have vulnerability (V) with access required network (N) and attack complexity low(L), authentication instances none( N) this will lead to Maximum exploitability and if we have confidentiality impact complete (C) and integrity impact complete (C),availability impact complete (C) as Maximum impact this will give the Maximum cost. Because this vulnerability is with very high risk, the Weight=100 according to risk matrices..The given vulnerability has the following parameters
(AV:[ N]/AC:[ L]/Au:[N]/C:[ C]/I:[C ]/A:[C])
(E:[ H ]/RL:[ U ]/RC:[ C ]) Temporal
(TD:[ND]/CDP:[ H ]/CR:[H]/IR:[H]/AR:[ H ]) Environmental
0.384422 * )) * 35 . 0 ( ) * * * 4 . 0 ( ), * * 25 . 0 (( temporal temporal
temporal Ac RL RC Au
E AV
Ev
384422 . 0 * )) 704 . 0 * 35 . 0 ( ) 1 * 1 * 71 . 0 * 4 . 0 ( ) 1 * 1 * 25 . 0 (( v E 300 . 0 v E 0.90631 * )) * * * * 45 . 0 ( ), * * * 35 . 0 ( ), * * * 2 . 0
(( C CRenvi TDenv I IRenv TDenv A ARenv TDenv CDPenv
Iv
base base base2 / ) ) 100 * ) 4.7619 * *
(( v V v
v E I W
Cost
2 / ) 100 ) 100 * ) 4.7619 * 700 . 0 * 0.300
((
v Cost
00 1
v Cost
CVSS metrics group CVSS attribute Rating Rating value
base metrics
Exploitability
access required (AV) local (L) 0.395
adjacent network (A) 0.646
network (N) 1.0
attack complexity (AC) high (H) 0.35
medium (M) 0.61
low (L) 0.71
authentication instances (Au) multiple (M) 0.45
single (S) 0.56
[image:4.595.312.543.71.526.2]none (N) 0.704
Table.1: CVSS base metrics-(exploitability)
Definition 2 (Minimum cost) if we have vulnerability (V) with access required network (L) and attack complexity low(H), authentication instances none( M) this will lead to Minimum exploitability and if we have confidentiality impact none (N) and integrity impact none (N), availability impact none (N) as Minimum impact this will give the Minimum cost. Because this vulnerability is with low risk (level (4) in risk matrix), the Weight=10 referring to risk matrices.
(AV:[ L]/AC:[H]/Au:[M]/C:[ N]/I:[N ]/A:[N])
(E:[ U ]/RL:[ OF ]/RC:[ UC ]) Temporal
(TD:[N]/CDP:[ N ]/CR:[L]/IR:[L]/AR:[ L ]) Environmental
0.384422 * )) * 35 . 0 ( ) * * * 4 . 0 ( ), * * 25 . 0 ((
temporal temporal
temporal Ac RL RC Au
E AV
Ev
0.1162
v E
0.90631 * )) * * * * 45 . 0 ( ), * * * 35 . 0 ( ), * * * 2 . 0
(( C CRenvi TDenv I IRenv TDenv A ARenv TDenv CDPenv
Iv
base base base000 . 0
v I
2 / ) ) 100 * ) 4.7619 * *
(( v V v
v E I W
Cost
5
v Cost
CVSS metrics group
CVSS attribute Rating Rating value
base metrics
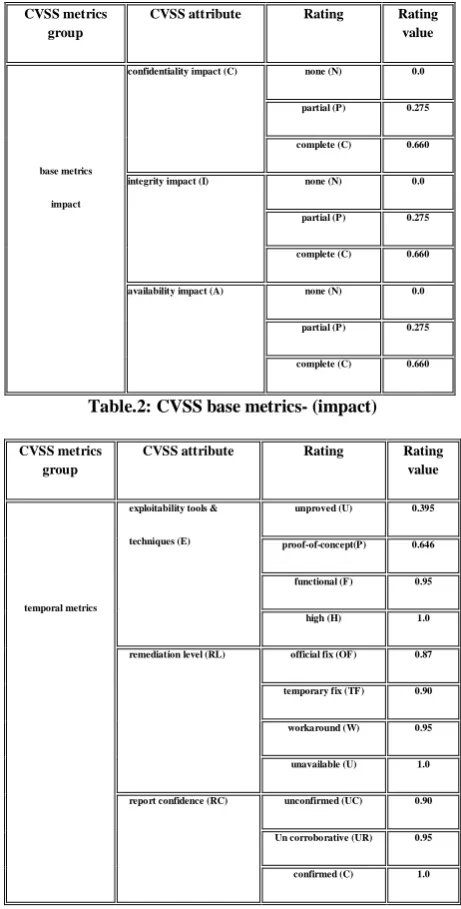
impact
confidentiality impact (C) none (N) 0.0
partial (P) 0.275
complete (C) 0.660
integrity impact (I) none (N) 0.0
partial (P) 0.275
complete (C) 0.660
availability impact (A) none (N) 0.0
partial (P) 0.275
complete (C) 0.660
Table.2: CVSS base metrics- (impact)
CVSS metrics group
CVSS attribute Rating Rating
value
temporal metrics
exploitability tools &
techniques (E)
unproved (U) 0.395
proof-of-concept(P) 0.646
functional (F) 0.95
high (H) 1.0
remediation level (RL) official fix (OF) 0.87
temporary fix (TF) 0.90
workaround (W) 0.95
unavailable (U) 1.0
report confidence (RC) unconfirmed (UC) 0.90
Un corroborative (UR) 0.95
confirmed (C) 1.0
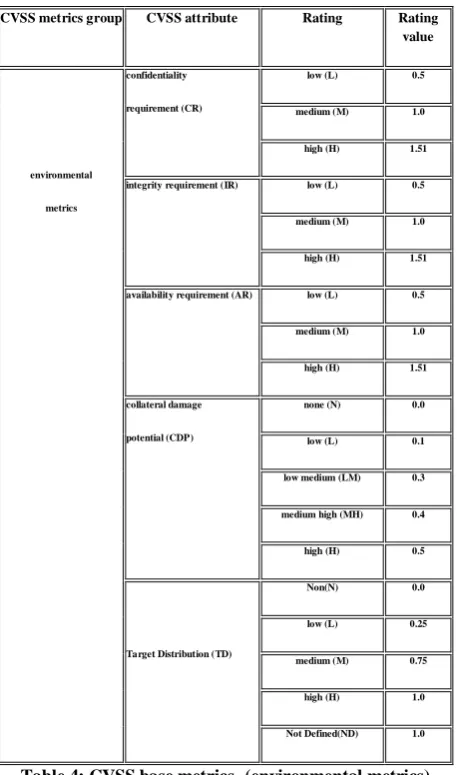
[image:4.595.50.283.148.353.2]CVSS metrics group CVSS attribute Rating Rating value environmental metrics confidentiality requirement (CR)
low (L) 0.5
medium (M) 1.0
high (H) 1.51
integrity requirement (IR) low (L) 0.5
medium (M) 1.0
high (H) 1.51
availability requirement (AR) low (L) 0.5
medium (M) 1.0
high (H) 1.51
collateral damage
potential (CDP)
none (N) 0.0
low (L) 0.1
low medium (LM) 0.3
medium high (MH) 0.4
high (H) 0.5
Target Distribution (TD)
Non(N) 0.0
low (L) 0.25
medium (M) 0.75
high (H) 1.0
[image:5.595.54.283.69.457.2]Not Defined(ND) 1.0
Table.4: CVSS base metrics- (environmental metrics)
2.1 PRACTICAL IMPLEMENTATION
We will use our CVSS equations to calculate the severity cost of the vulnerability CVE-2002-1142, Microsoft Data Access Components RDS Data Stub Remote Overflow.Synopsis: The remote host is affected by remote buffer overflow vulnerability.
Description: The remote DLL /msadc/msadcs.dll is accessible by anyone. Several flaws have been found in it in the past. We recommend that you restrict access to MSADC only to trusted hosts.
Solution:- Launch the Internet Services Manager
- Select your web server - Right-click on MSADC and select 'Properties'
- Select the tab 'Directory Security'
- Click on the 'IP address and domain name restrictions' option
- Make sure that by default, all computers are DENIED access to this resource
- List the computers that should be allowed to use it
CVSS Score
7.5 (CVSS2#AV:N/AC:L/Au:N/C:P/I:P/A:P) Base
(E:[ H ]/RL:[TF ]/RC:[ C ]) Temporal
(CDP:[ H ]/TD[H]/CR:[H]/IR:[H ]/AR:[ H ]) Environmental
0.384422 * )) * 35 . 0 ( ) * * * 4 . 0 ( ), * * 25 . 0
(( AV Etemporal Ac RLtemporal RCtemporal Au
Ev
0.2891 v E 0.90631 * )) * * * * 45 . 0 ( ), * * * 35 . 0 ( ), * * * 2 . 0
(( C CRenvi TDenv I IRenv TDenv A ARenv TDenv CDPenv
Iv
base base base0.2917 v I 2 / ) ) 100 * ) 4.7619 * *
(( v V v
v L I W
Cost
2 / ) 100 ) 100 * ) 4.7619 * 0.2917 * 0.2891 (( v Cost 70.08 v Cost
Now we will use the solution to list the computers that should be allowed to have access to Server-A, by configuring the firewall as shown in figure 4
Figure-4: Practical Example
If we locate Sever A behind the firewall, then the weight level of the risk driven from risk metrics will drop down from 100 to 10 and the Environmental metrics parameters change as follow
(CDP:[ N ]/TD[N]/CR:[L]/IR:[L ]/AR:[ L ])
When we try to access Server A from any computer not in the firewall‟s list
0.384422 * )) * 35 . 0 ( ) * * * 4 . 0 ( ), * * 25 . 0 (( temporal temporal
temporal Ac RL RC Au
E AV
Ev
0.2891 v E 0.90631 * )) * * * * 45 . 0 ( ), * * * 35 . 0 ( ), * * * 2 . 0
(( C CRenvi TDenv I IRenv TDenv A ARenv TDenv CDPenv
Iv
base base base0.0000 v I 2 / ) ) 100 * ) 4.7619 * *
(( v V v
v L I W
Cost
2 / ) 10 ) 100 * ) 4.7619 * 0.0 * 0.2891 (( v Cost 5.0 v Cost
2.2 Cost calculation framework:
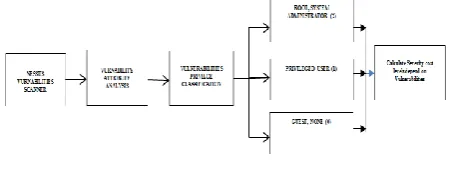
The Nessus scanner is designed to identify Vulnerabilities before the hackers can exploit them. In our project we will use the Nessus scanner as a tool to discover known Vulnerabilities. First, we will analyze the Vulnerability attributes and then we classify and calculate Vulnerabilities cost according to privileges as follows:
1-The cost of vulnerabilities that will allow an intruder to
immediately gain privileged access (root, system
administrator (2)).
2- The cost of vulnerabilities that will allow an intruder to gain access to the system with privileged user only (privileged user (1)).
External
Network
Attacker
Server A
[image:5.595.328.548.228.304.2]3- The cost of vulnerabilities that will allow an intruder to gain access to the system with guest or without having any account to access the system (Guest or None (0)).
Figure-5: Cost calculation framework
The mode for joining the vulnerabilities into one score for the machine is derived at by first taking each of the vulnerabilities, and getting their CVSS scores. Then the vulnerabilities are listed on a table similar to the table 5 and 6. These are classified according to the vulnerabilities specification to User privileges vulnerabilities (i.e. The impact of the vulnerabilities does not include gain privileged access) and root privileges vulnerabilities which include gain privileged along with other impacts. After this, the vulnerabilities are processed using the following equations:
. / ) (
1 1 ,
.
n n
Xn Costv n
C
Where Vn are User privileges vulnerabilities
n n
Xn Costv n
C 1 2 ,
. ( )/
Where Vn are Root privileges vulnerabilities
The average operational level is operational level 0 (OL0) or average of full set of vulnerabilities which represent the values assigned when the attacker directly reaches a specific state. The highest operational level is operational level 1 (OL1) or average of set of vulnerabilities which represent the values assigned when the attacker can touch specific states indirectly through a multi-step intrusion. The selection of the vulnerabilities depends on the specifications for each vulnerability. After careful considerations of more than 3000 vulnerabilities, we discovered that the state transit of a multi-step intrusion happens mainly with vulnerabilities with severity cost greater than 45, besides other attributes of the vulnerability. The formula we will use to calculate operational level 1(OL1) is:
n n n
L
Xn Costv V n
C 1 ,
. ( ( ). ( 45))/
3.
PRACTICAL APPROACH TO DEVELOP
COST-CENTRIC ATTACK GRAPH.
Instead of specifying a state by network attributes, we propose cost-centric model checking, in which each state is specified by the attributes of a single host. We refer to the corresponding attack graphs generated with model checking algorithms as cost-centric attack graphs. We use our methodologies and all the concepts mentioned in section 2 to develop quantitative risk evaluation metrics and we will use the results to build our cost-centric attack graphs. We use Nessus scanner as a tool to discover known Vulnerabilities on
[image:6.595.332.535.194.320.2]IP1 and IP2 on the simple network shown in figure-6, and we analyze the Nessus scanning reports adding our environmental metrics according to our setting. We calculate the severity cost for each vulnerability based on CVSS score then we process the results by classifying them to user and root privileges levels. We may need to live with some of the vulnerabilities, and take countermeasures only when a multi-step intrusion is actually happening, so within each level we classify the vulnerabilities to operational level 0 and 1(a multi-steps intrusion), then we use the results to build the cost-centric attack graphs.
Figure-6: Simple Network
The list of Vulnerabilities we got after using Nessus scanning reports on (IP1) the total numbers of Vulnerabilities is 14 we will present some of the Vulnerabilities parameters as shown below:
1-(CVSS2#AV:N/AC:L/Au:N/C:N/I:N/A:P) Base (E:[ H ]/RL:[ OF ]/RC:[ C ]) Temporal
(CDP:[ MH ]/TD:[H]/CR:[L]/IR:[L ]/AR:[ H ]) Environmental
39.61
12213
Cost
2- (CVSS2#AV:N/AC:L/Au:N/C:N/I:N/A:P) (E:[ F ]/RL:[ OF ]/RC:[ C ]) Temporal
(CDP:[ H ]/TD:[H]/CR:[H]/IR:[H ]/AR:[ H ]) Environmental
45.08
45517
Cost
3- CVSS2#AV:N/AC:L/Au:N/C:C/I:C/A:C) (E:[ P ]/RL:[ OF ]/RC:[ C ]) Temporal
(CDP:[ ND ] /TD:[H]/CR:[H]/IR:[H]/AR:[H]) Environmental
89.53
10357
Cost
4-(CVSS2#AV:N/AC:L/Au:N/C:P/I:P/A:P) (E:[ P ]/RL:[ OF ]/RC:[ C ]) Temporal
(CDP:[ MH]/ TD:[H]/CR:[H]/IR:[H]/AR:[H]) Environmental
66.47
11161
Cost
5-(CVSS2#AV:N/AC:M/Au:N/C:P/I:N/A:N) E:[ F ]/RL:[ OF ]/RC:[ C ]) Temporal
(CDP:[ L ]/CR:[L]/IR:[L]/AR:[L]) Environmental
6.98
11213
Cost
6-(CVSS2#AV:N/AC:L/Au:N/C:C/I:C/A:C) (E:[ P ]/RL:[ OF ]/RC:[ C ]) Temporal
(CDP:[ H ] /TD:[H]/CR:[H]/IR:[H]/AR:[H]) Environmental
91.96
11890
Cost
or integrity or availability, with user privileges we arrange them in user privileges row, user privileges. While the vulnerabilities that will allow an intruder to immediately gain privileged access (root, system administrator). We classified them under root privilege as shown in Table 5, as you can notice we processed all the vulnerabilities as operational level 0 while in operational level 1 we only process the vulnerabilities with multi steps intrusion according to the rules and regulations mentioned in 2.2 . You can notice in figure 7 that the user privilege vulnerabilities distribution start from less than 10 severity cost up to less than 70, in other hand the root privilege vulnerabilities rang in OL0 started from 70 to 94.3. In OL1 the range for user level starts from 45.08 to 66.47 and in root level from 89.53 to 94.3. The above analysis indicates the correctness of using risk matrix to classify and evaluate the risk.
Vn1 Vn2 Vn3 Vn4 Vn5 Vn6 OL0
User privileges 39.6 45.0 66.4 6.9 39.5 20.7 C
IP1,1 36
Administrator privilege 89.5 91.9 89.5 94. 67.4 C
IP1,2 86.5
Operational level zero
Vn1 Vn2 Vn3 Vn4 Vn5 Vn6 OL0
User privileges 45.08 66.47 C
IP1,1 56
Administrator privilege 89.53 91.96 89.53 94.3 C
IP1,2 91.33
Operational level 1
[image:7.595.51.516.239.584.2]Table.5: Operational levels of IP1 Host
Figure.7: Vulnerabilities distribution for IP1
1-User privileges:
n n
n Costv n
C 1 1 ,
. ( )/
nn Cost
C 1 1 ,
. (39.61,40.08,66.47,6.98,39.51,20.75)
35.566
1 , 1
.IP
C
2- Administrator privilege:
n n
Vn Costv n
C 1 1 ,
. ( )/
nVn Cost
C 1 1 ,
. (89.53,91.96,89.53,94.3,94.3,67.49)
86.562
2 ,
!
IP C
The list of Vulnerabilities we got after using Nessus scanning reports on (IP2):
Vn1 Vn2 Vn3 Vn4 Vn5 Vn6 Vn7 Vn8 Vn9 Vn10 Vn11 OL0
User
privileges 45.87 58.94 58.94 59.29 67.52 41.41 35.82 42.62 59.12 38.39 20.19 CIP2,148.01
Administrator
privilege 94.87 83.65 74.04 97.64 79.92 70.83 CIP2,283.49
Operational level zero
Vn1 Vn2 Vn3 Vn4 Vn5 Vn6 Vn7 Vn8 Vn9 Vn10 Vn11 OL0
User
privileges 45.87 58.94 58.94 59.29 67.52 41.41 35.82 42.62 59.12 38.39 20.19 CIP2,148.01
Administrator
privilege 94.87 83.65 74.04 97.64 79.92 70.83 CIP2,283.49
[image:7.595.312.550.403.588.2]Operational level 1
Table.6: Operational levels of IP2 Host
Figure.8: Vulnerabilities distribution for IP2
In our model, the attributes of hosts IP1, IP2 include:
1- Attacker‟s access privilege on each host: Privilege level, i.e., root or system administrator (2), privileged user (1), user, guest, or none (0).
2- Security Metrics cost for each host: represent the CVSS score with the Risk Assessment levels for each host.
3-Exploit mode: The locality of an attacker performing an exploit
0
20
40
60
80
100
1 2 3 4 5 6
Se
ve
ri
ty
co
st
Vulnerabilities number
Root
privilege
OL0
User
privileges
OL0
User
privileges
OL1
0
20
40
60
80
100
120
1
3
5
7
9
Sever
it
y
co
st
Vulnerabilities number
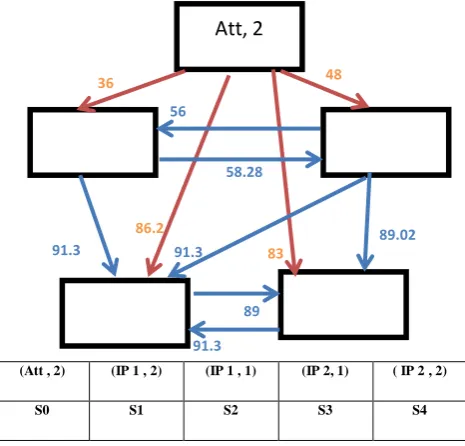
If you look at figure 9 below, we have five states to represent the cost centric attack graph for IP1 and IP2. Notice the direct cost to reach s1, s2, s3 represents OL0„s costs, while the indirect cost from (s2, s1), (s2, s3), (s2.s4) and (s3,s4), (s3,s1), (s3, s2) and (s4,s1) and (s1, s4) represent OL1 „s costs.
(Att , 2) (IP 1 , 2) (IP 1 , 1) (IP 2, 1) ( IP 2 , 2)
[image:8.595.51.284.137.360.2]S0 S1 S2 S3 S4
Figure-9: Cost centric attack graph
4.
CONCLUSION
The paper describes a new method of representing a unique severity cost to the total weight of all vulnerabilities for each host, using CVSS scores of base, temporal and environmental metrics by combining related sub-scores and modelling the problem‟s parameters in to a mathematical framework. Generally the quantitative score of the risk in combining of exploitability and impact scores. Since 1980 the above method has been challenged. Specialists accept the main elements in the function but disagree on the production of likelihood and impact to calculate the risk, as the risk should be evaluated in terms of maximum impact on an adverse event, and for this, we use the risk matrix to collaborate the risk equations. Using our framework to measure a single severity cost for all vulnerabilities in a single host by creating four levels of classifications, the first and second levels represent the user and root vulnerabilities. We refer to these
vulnerabilities to operational levels zero (OL0) and the third and fourth levels represent multi-step and single-step vulnerabilities and we refer to these to operational level one(OL1). Using our classifications and tables of vulnerabilities and figures analysis, we proved that this classification really reflects the usefulness of the risk matrices. We used the calculated values to build our cost centric attack graph.
5.
REFERENCES
[1] Bin WU, Andy Ju An WANG. EVMAT: An OVAL and NVD Based Enterprise Vulnerability Modeling and Assessment Tool, In Proceedings of ACMSE, Kennesaw, GA, USA, March 24-25, 2011.
[2] Remco R. Bouckaert, Eibe Frank, Mark Hall, Richard Kirkby, Peter Reutemann, Alex Seewald, and David Scuse. WEKA Manual for Version 3.7. The University of Waikato, 2010.
[3] Thaier Hamid and Carsten Maple, IJCA Special Issue on Network Security and Cryptography Number 1 2011, ISBN: 978-93-80865-66-7.
[4] Risk Assessment and Mapping Guidelines for Disaster
Management, COMMISSION STAFF WORKING PAPER, Brussels, 2010.
[5] Microsoft, Security TechCenter, Security Bulletin
Severity Rating System Available from:
http://www.microsoft.com/technet/security/bulletin/rating.ms px [06.2012].
[6]Elizabeth Van and Karen Scarfone, the Common Misuse
Scoring System (CMSS): Metrics for Software Feature
Misuse Vulnerabilities, NIST Interagency Report, 2009
[7] Peter Mell, Karen Scarfone, A Complete Guide to the
Common Vulnerability Scoring System Version 2.0, June, 2007.
[8] NVD, “National vulnerability database v2.2,
http://nvd.nist.gov/[06.2012].
[9] Renaud Deraison (Tenable Network Security), “Nessus
4.4.1 Released,” URL:
http://blog.tenablesecurity.com/2011/03/nessus-441-released.html [06.2012].
Att, 2
IP1,1
IP1,2
IP 2,1
IP 2,2
36 48
86.2
83
58.28
89.02 56
91.3 91.3
89