http://dx.doi.org/10.4236/jmmce.2015.34028
How to cite this paper: Sukumar, M.S., Reddy, B.V.S. and Venkataramaiah, P. (2015) Analysis on Multi Responses in Face Milling of Ammc Using Fuzzy-Taguchi Method. Journal of Minerals and Materials Characterization and Engineering, 3, 255-270. http://dx.doi.org/10.4236/jmmce.2015.34028
Analysis on Multi Responses in Face Milling
of Ammc Using Fuzzy-Taguchi Method
Madiri Samuel Sukumar*, Borra Vijay Sudheer Reddy, P. Venkataramaiah
Department of Mechanical Engineering, College of Engineering, Sri Venkateswara University, Tirupati, India Email: *[email protected]
Received 26 May 2015; accepted 7 June 2015; published 10 June 2015
Copyright © 2015 by authors and Scientific Research Publishing Inc.
This work is licensed under the Creative Commons Attribution-NonCommercial International License (CC BY-NC).
http://creativecommons.org/licenses/by-nc/4.0/
Abstract
In this paper, Fuzzy-Taguchi Method has been used to identify the optimal combination of influen-tial factors by analyzing the multi responses in the face milling. Milling experiment has been per-formed on AMMC (Aluminium Metal Matrix Composite), according to Taguchi orthogonal array (L27) for various combinations of influential parameters: speed, feed, depth of cut and coolant. Fuzzy logic is applied for the analysis of experimental response data of vibrations, temperature, surface roughness and resultant forces. The Fuzzy grade is calculated from this data and Fuzzy grade is optimized using Taguchi method in order to get the optimal parameter values, and also influence of parameters on individual responses is studied using Taguchi S/N ratio analysis. This work is useful for analysis of machining parameters in face milling.
Keywords
Face Milling, AMMC, Fuzzy Logic, Taguchi S/N Ratio Analysis
1. Introduction
Conventional materials have the limitations in achieving good combination of strength, stiffness, toughness, density, etc. To overcome these limitations and to meet the ever increasing demand of modern day technology, composites are most promising materials in recent days. Metal matrix composites (MMCs) possess high strength, hardness, toughness, and good thermal resistance properties as compared to unreinforced alloys.
Milling is the process of machining flat, curved or irregular surfaces by feeding the work piece against a ro-tating cutter containing a number of cutting edges. The literature review related to machining of AMMC is pre-sented in the following.
Shivanand et al. (2004) [1] compared Powder Metallurgy method and stir casting method for producing the AMMC through testing of mechanical properties and concluded that stir casting method was best suitable for preparation of AMMC. Dalalah and Bataineh (2009) [2] presented a fuzzy logic approach to the selection of the best silicon crystal slicing technology. Fuzzy reasoning is used to model the expert’s comprehension and uncer-tainty in the factors used in the decision criteria. Kuttolamadom et al. (2010) [3] studied the effects of machining feed on surface roughness in milling Al-6061. Increase the feed up until a cut-off surface roughness limit is reached and then increase the speed within the roughness range, to maximize productivity. Yazdi and Khorram (2010) [4] investigated the selection of optimal machining parameters for face milling operations in order to mi-nimize the surface roughness and to maximize the material removal rate using RSM and ANN methods. Abu-thakeer et al. (2011) [5] carried out a study to obtain the surface roughness and vibration responses were inves-tigated at various parametric levels and combinations using LabVIEW software. On the completion of the expe-rimental test, ANN is used to validate the results. Gunay et al. (2011) [6] focused on study of machining para-meters on the cutting forces and surface roughness during face milling of Ti-6Al-4V alloy with carbide tools under dry conditions. Resultant cutting forces and surface roughness increased with an increase in feed rate, whereas decreasing with increase in cutting speed. Çalışkanet al. (2012) [7] showed the influence process pa-rameters on the cutting forces (Fx, Fy, and Fz) and Ra in hard milling. According to the results of variance analysis, the cutting forces are the most sensitive to feed rate fz and then depth of cut. The cutting speed is only influential on Fx. Globocki Lakica et al. (2013) [8] carried out Experimental Research Using of MQL in Metal Cutting. The analysis shows that turning with MQL is a good alternative for conventional lubrication. Al-Zubaidi
et al. (2013) [9] proposed a new multi objective optimization approach in the face milling. It is showed that the method provides a robust way of looking at the optimum parameter selection problems. Jatin (2013) [10] studied the effect of different machining on Surface Roughness in milling by Taguchi analysis. Low cutting speed should be used for long cutter life. High cutting speed and low feeds give best surface finishes. Venkata Ramaiah et al.
(2013) [11] made an attempt to obtain optimum machining parameters for minimum cutting forces and cutting temperature by using Fuzzy Logic. It is showed that the method provides good results in machining of Al 6061. Das et al. (2014) [12] investigated the application of traditional Taguchi method with fuzzy logic for multi ob-jective optimization of the machining process of Al-5Cu. Experimental results are demonstrated to present the effectiveness of this approach.
To address the lack of research in this issue, the present work has been done on face milling of AMMC with the following objectives:
1) To study the influence of machining parameters on multi responses;
2) To identify the optimal setting of milling process parameters (coolant, cutting speed, feed rate and depth of cut) for optimal responses: vibrations, temperature, surface roughness and resultant forces.
2. Taguchi Orthogonal Array for Conducting Experiments
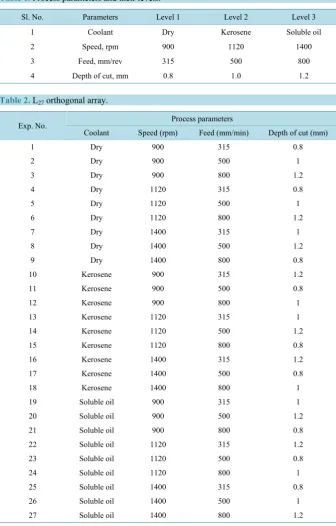
In this experiment four process parameters at three levels have been considered are shown in Table 1.
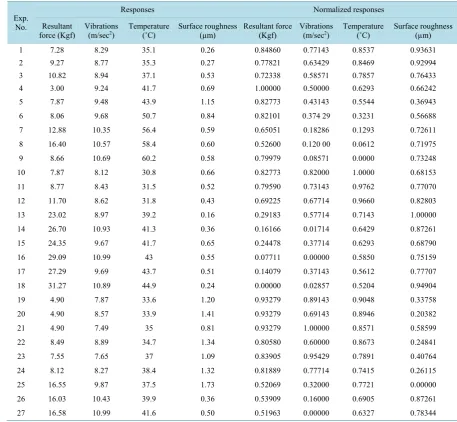
L27 orthogonal array as shown in Table 2 has been chosen for conducting experiments. Experiments are per-formed according to this design and the values of surface roughness, resultant force, vibrations and temperature are recorded and their Normalized responses and response values are shown in Table 3.
3. Milling of AMMC Material
3.1. Experimental Procedure
Step by Step procedure used in the experimental work.
1) Keep the milling machine ready for performing the machining operation; 2) Connect the DAQ system to milling machine;
3) Connect the milling tool dynamometer to the milling machine; 4) Prepare the AMMC work piece sample and fix in machine vice;
5) Fix the milling cutter to an arbor and make machine ready for experiment;
6) Perform milling experiments as per Taguchi design on work piece for various combinations of process control parameters like coolant, spindle speed, feed and depth of cut;
8) Measure forces such as thrust force, feed force, cross feed force by using milling tool dynamometer; 9) Measure vibrations by using accelerometer sensor (PCB Accelerometer having Sensitivity 100.5 mV/g) and temperature by using temperature sensor (NI-9211Temperature Module) of LabVIEW based DAQ system.
3.2. Measurement of Responses
[image:3.595.144.481.194.721.2]Experimental responses: surface roughness, vibrations, temperature and resultant forces are measured for different combinations of influential parameters. The measuring instruments and procedure is presented in the following.
Table 1.Process parameters and their levels.
Sl. No. Parameters Level 1 Level 2 Level 3
1 Coolant Dry Kerosene Soluble oil
2 Speed, rpm 900 1120 1400
3 Feed, mm/rev 315 500 800
4 Depth of cut, mm 0.8 1.0 1.2
Table 2. L27 orthogonal array.
Exp. No. Process parameters
Coolant Speed (rpm) Feed (mm/min) Depth of cut (mm)
1 Dry 900 315 0.8
2 Dry 900 500 1
3 Dry 900 800 1.2
4 Dry 1120 315 0.8
5 Dry 1120 500 1
6 Dry 1120 800 1.2
7 Dry 1400 315 1
8 Dry 1400 500 1.2
9 Dry 1400 800 0.8
10 Kerosene 900 315 1.2
11 Kerosene 900 500 0.8
12 Kerosene 900 800 1
13 Kerosene 1120 315 1
14 Kerosene 1120 500 1.2
15 Kerosene 1120 800 0.8
16 Kerosene 1400 315 1.2
17 Kerosene 1400 500 0.8
18 Kerosene 1400 800 1
19 Soluble oil 900 315 1
20 Soluble oil 900 500 1.2
21 Soluble oil 900 800 0.8
22 Soluble oil 1120 315 1.2
23 Soluble oil 1120 500 0.8
24 Soluble oil 1120 800 1
25 Soluble oil 1400 315 0.8
26 Soluble oil 1400 500 1
Table 3.Normalized responses.
Exp. No.
Responses Normalized responses
Resultant
force (Kgf) Vibrations (m/sec2) Temperature (˚C) Surface roughness (µm) Resultant force (Kgf) Vibrations (m/sec2) Temperature (˚C) Surface roughness (µm)
1 7.28 8.29 35.1 0.26 0.84860 0.77143 0.8537 0.93631
2 9.27 8.77 35.3 0.27 0.77821 0.63429 0.8469 0.92994
3 10.82 8.94 37.1 0.53 0.72338 0.58571 0.7857 0.76433
4 3.00 9.24 41.7 0.69 1.00000 0.50000 0.6293 0.66242
5 7.87 9.48 43.9 1.15 0.82773 0.43143 0.5544 0.36943
6 8.06 9.68 50.7 0.84 0.82101 0.374 29 0.3231 0.56688
7 12.88 10.35 56.4 0.59 0.65051 0.18286 0.1293 0.72611
8 16.40 10.57 58.4 0.60 0.52600 0.120 00 0.0612 0.71975
9 8.66 10.69 60.2 0.58 0.79979 0.08571 0.0000 0.73248
10 7.87 8.12 30.8 0.66 0.82773 0.82000 1.0000 0.68153
11 8.77 8.43 31.5 0.52 0.79590 0.73143 0.9762 0.77070
12 11.70 8.62 31.8 0.43 0.69225 0.67714 0.9660 0.82803
13 23.02 8.97 39.2 0.16 0.29183 0.57714 0.7143 1.00000
14 26.70 10.93 41.3 0.36 0.16166 0.01714 0.6429 0.87261
15 24.35 9.67 41.7 0.65 0.24478 0.37714 0.6293 0.68790
16 29.09 10.99 43 0.55 0.07711 0.00000 0.5850 0.75159
17 27.29 9.69 43.7 0.51 0.14079 0.37143 0.5612 0.77707
18 31.27 10.89 44.9 0.24 0.00000 0.02857 0.5204 0.94904
19 4.90 7.87 33.6 1.20 0.93279 0.89143 0.9048 0.33758
20 4.90 8.57 33.9 1.41 0.93279 0.69143 0.8946 0.20382
21 4.90 7.49 35 0.81 0.93279 1.00000 0.8571 0.58599
22 8.49 8.89 34.7 1.34 0.80580 0.60000 0.8673 0.24841
23 7.55 7.65 37 1.09 0.83905 0.95429 0.7891 0.40764
24 8.12 8.27 38.4 1.32 0.81889 0.77714 0.7415 0.26115
25 16.55 9.87 37.5 1.73 0.52069 0.32000 0.7721 0.00000
26 16.03 10.43 39.9 0.36 0.53909 0.16000 0.6905 0.87261
27 16.58 10.99 41.6 0.50 0.51963 0.00000 0.6327 0.78344
3.2.1. Measurement of Surface Roughness
The surface roughness values of the machined surface are measured in order to analyze the surface finish quality. Surface Roughness is measured with the help of Talysurf (Figure 1).
3.2.2. Measurement of Vibrations Using PCB Accelerometer
Spindle vibrations are measured using LabVIEW based DAQ. To measure the vibrations of the spindle, PCB Accelerometer (sensitivity 100.5 mv/g) is placed on spindle as shown in Figure 2.
3.2.3. Measurement of Temperature Using NI-9211 Thermocouple
The temperature at the contact of tool and work piece is measured using LabVIEW software based NI-9211 temperature thermocouple. According to the design of experiments at various conditions Dry, Kerosene and so-luble oil (Figure 3).
3.2.4. Measurement of Cutting Force Using Milling Tool Dynamometer
Figure 1. Talysurf (surface roughness measuring machine).
[image:5.595.193.437.592.663.2]Figure 2. PCB accelerometer mounted on moving spindle.
Figure 3. Thermocouple placed at contact of work piece and tool.
Figure 4. Milling tool dynamometer for measuring cutting forces.
3.3. Data Normalization
others. Data preprocessing is also necessary when the directions of the target in the sequences are different. If the target data value characteristic is “smaller the better”. The original sequence can be normalized using the Equation (1) as follows:
( )
( )
( )
( )
( )
* max
max min
o o
i i
i o o
i i
x k x k
x k
x k x k
− =
− (1)
where i=1, , m; k=1, , n. m is the number of experimental data items and n is the number of parameters.
( )
o i
x k Denotes the original sequence, *
( )
ix k the sequence after the data pre-processing, max o
( )
ix k the largest value of o
( )
i
x k , min o
( )
ix k the smallest value of o
( )
ix k , and xo is the desired value.
4. Analysis of Multi Responses
Deals with analysis of multi responses data shown in Table 3 and optimization of process parameters in milling of AMMC using Fuzzy logic and Taguchi analysis. And also influence of process parameters on individual res-ponses is studied using Taguchi S/N ratio analysis.
4.1. Determinations of Optimum Process Parameters Using Fuzzy Logic
The experimental data is analyzed using Fuzzy logic to determine optimum process parameters as in the following.
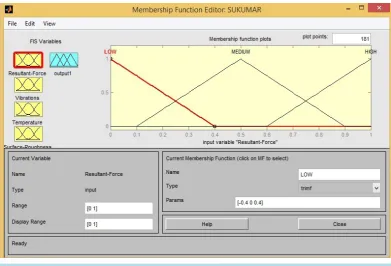
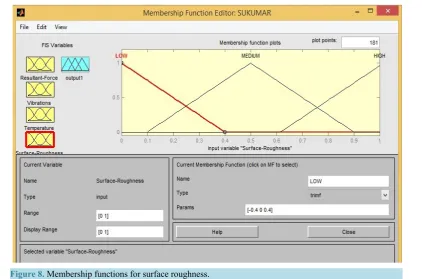
4.1.1. Creation of Membership Functions
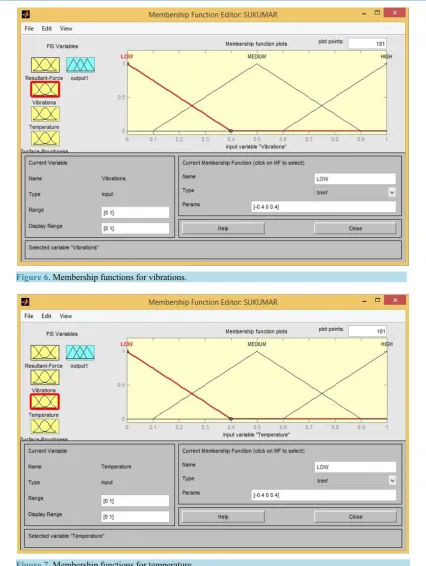
Figures 5-8 shows the membership function for vibrations, Temperatures, Surface roughness input values in the process parameter.
Figure 9 shows the membership function selected to defuzzify the output (performance), calculated using the simplifying rules. The rules for process parameter for some rules are shown in Table 4.
[image:6.595.117.509.442.708.2]Using more than three fuzzy sets would cause an explosion in the number of possible expressions. For the current case study 3 fuzzy sets and 4 inputs are considered. This results in a possible 34 = 81 expressions. The five fuzzy sets used in the performance membership function are “very low”, “low”, “medium”, “high”, and “very high”. Again, the trimf shape is employed to map the fuzzy sets. The use of the centroid defuzzification method
Figure 6. Membership functions for vibrations.
Figure 7. Membership functions for temperature.
Figure 8. Membership functions for surface roughness.
Figure 9.Membership functions for performance.
4.1.2. Evaluation of Fuzzy Grade
Fuzzy grade values are determined from Fuzzy logic using Fuzzy rules (Table 4) and normalizing data (Table 3). By using evaluation function of the MATLAB editor.
The evaluation function is: b = [experimental data]; a = readfis (“File name”), t = evalfis (b, a).
[image:8.595.118.513.221.622.2]Table 4.Rules for process parameter. S. No. Resultant force Vibrations Temperature Surface roughness Performance
1 If Low And Low And Low And Low Then Very high
2 If Low And Low And Low And Medium Then High
3 If Low And Low And Low And High Then Medium
4 If Low And Low And Medium And Low Then Very high
5 If Low And Low And Medium And Medium Then High
6 If Low And Low And Medium And High Then Medium
7 If Low And Low And High And Low Then High
8 If Low And Low And High And Medium Then Medium
9 If Low And Low And High And High Then Low
10 If Low And Medium And Low And Low Then Very high
- - - -
- - - -
- - - -
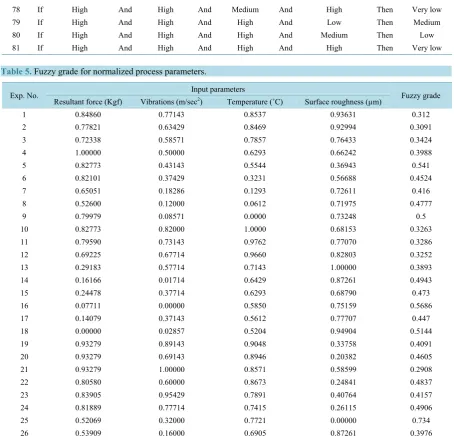
78 If High And High And Medium And High Then Very low
79 If High And High And High And Low Then Medium
80 If High And High And High And Medium Then Low
[image:9.595.86.541.267.710.2]81 If High And High And High And High Then Very low
Table 5. Fuzzy grade for normalized process parameters.
Exp. No. Input parameters Fuzzy grade
Resultant force (Kgf) Vibrations (m/sec2) Temperature (˚C) Surface roughness (µm)
1 0.84860 0.77143 0.8537 0.93631 0.312
2 0.77821 0.63429 0.8469 0.92994 0.3091
3 0.72338 0.58571 0.7857 0.76433 0.3424
4 1.00000 0.50000 0.6293 0.66242 0.3988
5 0.82773 0.43143 0.5544 0.36943 0.541
6 0.82101 0.37429 0.3231 0.56688 0.4524
7 0.65051 0.18286 0.1293 0.72611 0.416
8 0.52600 0.12000 0.0612 0.71975 0.4777
9 0.79979 0.08571 0.0000 0.73248 0.5
10 0.82773 0.82000 1.0000 0.68153 0.3263
11 0.79590 0.73143 0.9762 0.77070 0.3286
12 0.69225 0.67714 0.9660 0.82803 0.3252
13 0.29183 0.57714 0.7143 1.00000 0.3893
14 0.16166 0.01714 0.6429 0.87261 0.4943
15 0.24478 0.37714 0.6293 0.68790 0.473
16 0.07711 0.00000 0.5850 0.75159 0.5686
17 0.14079 0.37143 0.5612 0.77707 0.447
18 0.00000 0.02857 0.5204 0.94904 0.5144
19 0.93279 0.89143 0.9048 0.33758 0.4091
20 0.93279 0.69143 0.8946 0.20382 0.4605
21 0.93279 1.00000 0.8571 0.58599 0.2908
22 0.80580 0.60000 0.8673 0.24841 0.4837
23 0.83905 0.95429 0.7891 0.40764 0.4157
24 0.81889 0.77714 0.7415 0.26115 0.4906
25 0.52069 0.32000 0.7721 0.00000 0.734
26 0.53909 0.16000 0.6905 0.87261 0.3976
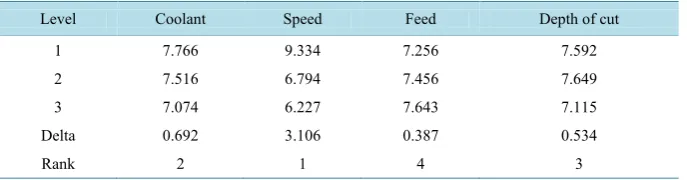
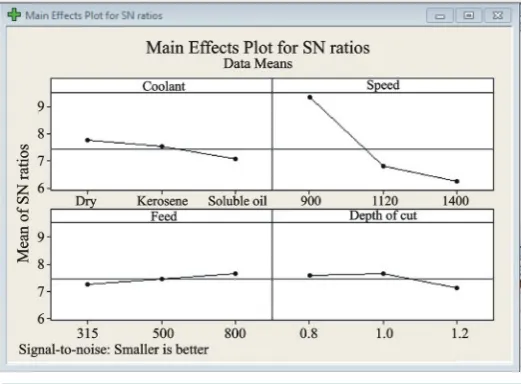
4.2. Taguchi Analysis
Taguchi S/N ratio analysis is performed on Fuzzy grade data shown in Table 6 using Minitab software and op-timum parameter values are found (Table 7)and the main effects plot is shown in Figure 10.
From the results (Table 7 and Figure 11), optimum process parameters combination for Fuzzy grade is Speed 3-Coolant 3-Depth of cut 3-Feed 1
Which means
[image:10.595.144.480.198.619.2]Speed at level 3 (1400 rpm)
Table 6. Factors and fuzzy grade for process parameters.
S. No. Coolant Speed (rpm) Feed (mm/min) Depth of cut (mm) Fuzzy grade
1 Dry 900 315 0.8 0.312
2 Dry 900 500 1 0.3091
3 Dry 900 800 1.2 0.3424
4 Dry 1120 315 0.8 0.3988
5 Dry 1120 500 1 0.541
6 Dry 1120 800 1.2 0.4524
7 Dry 1400 315 1 0.416
8 Dry 1400 500 1.2 0.4777
9 Dry 1400 800 0.8 0.5
10 Kerosene 900 315 1.2 0.3263
11 Kerosene 900 500 0.8 0.3286
12 Kerosene 900 800 1 0.3252
13 Kerosene 1120 315 1 0.3893
14 Kerosene 1120 500 1.2 0.4943
15 Kerosene 1120 800 0.8 0.473
16 Kerosene 1400 315 1.2 0.5686
17 Kerosene 1400 500 0.8 0.447
18 Kerosene 1400 800 1 0.5144
19 Soluble oil 900 315 1 0.4091
20 Soluble oil 900 500 1.2 0.4605
21 Soluble oil 900 800 0.8 0.2908
22 Soluble oil 1120 315 1.2 0.4837
23 Soluble oil 1120 500 0.8 0.4157
24 Soluble oil 1120 800 1 0.4906
25 Soluble oil 1400 315 0.8 0.734
26 Soluble oil 1400 500 1 0.3976
27 Soluble oil 1400 800 1.2 0.4159
Table 7.Rank of process parameters for fuzzy grade.
Level Coolant Speed Feed Depth of cut
1 7.766 9.334 7.256 7.592
2 7.516 6.794 7.456 7.649
3 7.074 6.227 7.643 7.115
Delta 0.692 3.106 0.387 0.534
[image:10.595.143.487.632.722.2]Coolant at level 3 (Soluble oil) Depth of cut at level 3 (1.2 mm) Feed at level 1 (315 mm/rev)
4.3. Individual Response Analysis
Taguchi S/N ratio analysis is applied for data shown in Table 5 to study the influence of process parameters on individual responses. The results are shown in Figures 11-14 and Tables 8-11.
4.3.1. S/N for Vibration versus Coolant, Speed, Feed and Depth of Cut
From Figure 11 and Table 8, the optimum process parameters combination for individual response (Vibration) is Speed 3-Depth of cut 3-Coolant1, 2 -Feed 3
Which means
[image:11.595.183.444.297.489.2]Speed at level 3 (1400 rpm) Depth of cut at level 3 (1.2 mm) Coolant at level 1, 2 (Dry, Kerosene) Feed at level 3 (800 mm/rev)
Figure 10.Main effects plot for vibration.
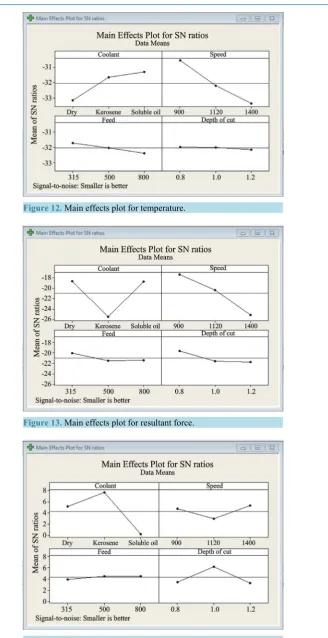
[image:11.595.182.446.339.707.2]Figure 12. Main effects plot for temperature.
[image:12.595.160.489.73.712.2]Figure 13. Main effects plot for resultant force.
Table 8. Rank of process parameters for vibration.
Level Coolant Speed Feed Depth of cut
1 −19.58 −18.42 −19.20 −19.03
2 −19.58 −19.23 −19.40 −19.32
3 −18.90 −20.41 −19.46 −19.72
Delta 0.68 2.00 0.26 0.69
Rank 3 1 4 2
Table 9.Rank of process parameters for temperature.
Level Coolant Speed Feed Depth of cut
1 −33.17 −30.56 −31.72 −31.98
2 −31.66 −32.20 −32.02 −32.00
3 −31.31 −33.37 −32.39 −32.15
Delta 1.87 2.81 0.67 0.17
Rank 2 1 3 4
Table 10. Rank of process parameters for resultant force.
Level Coolant Speed Feed Depth of cut
1 −18.68 −17.42 −20.02 −19.62
2 −25.50 −20.38 −21.46 −21.56
3 −18.73 −25.11 −21.44 −21.73
Delta 6.83 7.69 1.44 2.11
Rank 2 1 4 3
Table 11. Rank of process parameters for surface roughness.
Level Coolant Speed Feed Depth of cut
1 5.0958 7.7189 3.9266 3.4718
2 7.6211 2.9283 4.4599 6.1405
3 0.1882 5.2580 4.5187 3.2929
Delta 7.4329 2.3297 0.5921 2.8476
Rank 1 3 4 2
4.3.2. S/N for Temperature versus Coolant, Speed, Feed and Depth of Cut
From Figure 12 and Table 9, the optimum process parameters combination for individual response (Tempera-ture)
Speed3-Coolant1-Feed3 -Depth of cut3 Which means
Speed at level 3 (1400 rpm) Coolant at level 1 (Dry) Feed at level 3 (800 mm/rev) Depth of cut at level 3 (1.2 mm)
4.3.3. S/N for Resultant Force versus Coolant, Speed, Feed and Depth of Cut
From Figure 13 and Table 10, the optimum process parameters combination for individual response (Resultant force) is
Speed at level 3 (1400 rpm) Coolant at level 2 (Kerosene) Feed at level 2 (500 mm/rev) Depth of cut at level 3 (1.2 mm)
4.3.4. S/N for Surface Roughness versus Coolant, Speed, Feed and Depth of Cut
From Figure 14 and Table 11, the optimum process parameters combination for individual response (Surface roughness) is
Coolant3- Depth of cut3 -Speed2- Feed1 Which means
Coolant at level 3 (Soluble oil) Depth of cut at level 3 (1.2 mm) Speed at level 2 (1120 rpm) Feed at level 1 (315 mm/rev)
4.4. Conformation Test Results
Conformation experiment is conducted for optimum parameter combination and the values of Vibrations (shown in Figure 15andFigure 16), Temperature (shown in Figure 17andFigure 18), surface roughness, and resul-tant forces are recorded (Table 12).
According to Fuzzy based Taguchi S/N ratio analysis, the optimal combination of input parameters is Coolant = Soluble oil
[image:14.595.194.436.386.531.2]Speed = 1400 rpm Depth of cut = 1.2 mm Feed = 315 mm/rev
Figure 15.Lab VIEW front panel of acceleration(output).
[image:14.595.193.436.556.709.2]Figure 17.Lab VIEW front panel of temperature(output).
Figure 18.Lab VIEW block diagram of temperature.
Table 12.Experimental results.
Coolant Speed (rpm) (mm/min) Feed Depth of cut (mm) Resultant force (Kgf) Vibrations (m/sec2) Temperature (˚C) Surface roughness (µm)
Soluble oil 1400 315 1.2 19.28 10.95 38.6 0.52
5. Conclusions
The influence of machining parameters on the multi responses is studied and the following conclusions are drawn from the results.
1) The order of influenced parameters found from Fuzzy-Taguchi analysis is as follows:
• Speed (most influential);
• Coolant (moderately influential);
• Depth of cut (least influential);
• Feed (very least influential).
2) Taguchi analysis shows that speed has more influence on vibrations, forces and temperature and that coo-lant has more influence on surface roughness.
3) Confirmation test has been conducted and results are satisfactory. However, this work can be extended further by considering the followings:
• Accuracy of predictions will be enhanced by generating more experimental data for training;
• Tools with coated materials like Titanium, diamond, etc., are to be used in order to get the best results.
[image:15.595.87.540.487.525.2]References
[1] Shivanand, H.K., Benal, M.M., Sharma, S.C. and Govindraju, N. (2004) Comparative Studies on Mechanical Proper-ties of Aluminium Based Hybrid Composites Cast by Liquid Melt Technique and P/M Route. Materials Processing for Properties and Performance, 3, 57-60.
[2] Dalalah, D and Bataineh, O. (2009) A Fuzzy Logic Approach to the Selection of the Best Silicon Crystal Slicing Tech-nology. Expert Systems with Applications, 36, 3712-3719. http://dx.doi.org/10.1016/j.eswa.2008.02.020
[3] Kuttolamadom, M.A., Hamzehlouia, S. and Laine Mears, M. (2010) Effect of Machining Feed on Surface Roughness in Cutting 6061 Aluminum. International Center for Automotive Research, Clemson university, South Carolina, United state, 2010-01-0218.
[4] Soleymani Yazdi, M.R. and Khorram, A. (2010) Modeling and Optimization of Milling Process by Using RSM and ANN Methods. International Journal of Engineering and Technology, 2, 474-480.
http://dx.doi.org/10.7763/IJET.2010.V2.167
[5] Abuthakeer, S.S., Mohanram, P.V. and Mohankumar, G. (2011) The Effect of Spindle Vibration on Surface Roughness of Workpiece in Dry turning using ANN. International Journal of Lean Thinking, 2.
[6] Gunay, M., Kacal, A. and Turgut, Y. (2011) Optimization of Machining in Milling of Ti-6Al-4V Alloy using Taguchi method. e-Journal of New World Sciences Academy, 6, Article No. 1A0165.
[7] Çalışkan, H., Kurbanoğlu, C., Panjan, P. and Kramar, D. (2012) Investigation of the Performance of Carbide Cutting Tools with Hard Coatings in Hard Milling Based on the Response Surface Methodology. The International Journal of Advanced Manufacturing Technology, 66, 883-893. http://dx.doi.org/10.1007/s00170-012-4374-y
[8] Globočki Lakić, G., Sredanović, B., Kramar, D., Nedić, B. and Kopač, J. (2013) Experimental Research Using of MQL in Metal Cutting. Tribology in Industry, 35, 276-285.
[9] Al-Zubaidi, S. Ghani, J.A., Hassan, C. and Haron, C. (2013) Optimization of Cutting Conditions for End Milling of TiAL4V by Using a Gravitational Search Algorithm. Mechanica, 48, 1710-1715.
[10] Jatin, P.S. (2013) Effect of Machining Parameters on Output Characteristics of CNC Milling Using Taguchi Optimiza-tion Technique. IJEBEA 13-335, 2013.
[11] Venkata Ramaiah, P., Rajesh, N. and Dharma Reddy, K. (2013) Determination of Optimum Influential Parameters in Turning of Al6061 Using Fuzzy Logic. IJIRSET, 2.