Preferences, information and biodiversity
preservation
Spash, Clive L. and Hanley, N
Economics Department, University of Stirling
July 1994
Online at
https://mpra.ub.uni-muenchen.de/38351/
BIODIVERSITY PRESERVATION
BY CLIVE L. SPASH AND NICK HANLEY
Clive L. Spash and Nick Hanley July 1994
Environmental Economics Research Group, University of Stirling, Scotland, U.K.
ABSTRACT
This paper considers the nature of preferences for the preservation of biodiversity, and the extent to which individuals are well-informed about biodiversity. We present evidence that the elicitation of monetary bids to pay for biodiversity preservation, as required for cost-benefit analysis, fails as a measure of welfare changes due to the prevalence of preferences which neoclassical economics defines as lexicographic. That is, a significant proportion of individuals refuse to make trade-offs which require the substitution of biodiversity for other goods. In addition, we show that understanding of the biodiversity concept is extremely limited, raising concerns over a reliance on stated preferences, as revealed in contingent valuation studies, for decision-making on this issue. Results from two samples (students and the general public) are described.
Keywords: biodiversity, lexicographic preferences, cost-benefit analysis, contingent valuation, environmental ethics
I. INTRODUCTION
One of the few agreements made at the United Nations Conference on Environment and Development in Rio de Janeiro, 1992, concerned the preservation of biodiversity. The Convention on Biological Diversity provides an overall framework for international action to protect species and their habitats. Countries ratifying the Convention are required to identify and monitor their biological resources and to produce plans for conserving them; including the establishment of protected areas. The Convention also contains provisions to encourage access to and transfers of technology, on mutually agreed terms, to facilitate the safe use of biotechnology, and to promote benefit sharing arrangements between countries providing valuable biological resources and those who “develop” these resources. These latter provisions may be limited due to concerns (eg, within the UK government) that transfer of technology and biotechnology are undesirable (probably due to concerns over trade
competition). As with other international treaties, sovereign nations are left to their own devices in order to satisfy treaty requirements.
The Convention has motivated public agencies (such as the Forestry Commission in the UK) to attempt to measure biodiversity. The movement towards the adoption of a cost-benefit analysis (CBA) approach to this issue can be seen on at least two fronts. First, legislation concerning public projects has become increasingly environmentally-friendly because of a publicly recognised need to conserve scarce resources. Current legislation in Europe requires the use of environmental impact assessment (where impacts are measured in physical units) for certain projects, under Directive 85/337. CBA is an alternative paradigm for measuring environmental impacts. Indeed, in the US, environmental impact assessment was followed chronologically by President Reagan's executive order 12291, mandating the use of CBA for public projects and policies. Second, the imposition of biodiversity
declines in their own biodiversity levels during early industrialisation. The costs and benefits of biodiversity protection, and their incidence, is a question of political economy which raises issues of economic and political values.
If decisions about biodiversity protection are to be made on the basis of CBA, then some means of placing an economic value on the benefits of actions which increase
biodiversity protection is necessary. This is complicated by the non-market nature of many of these benefits. While much work in environmental economics during the last 20 years has focused on such non-market valuation, the application of benefit measurement techniques to biodiversity confronts two problems:
1. Individuals may be unwilling to trade-off increases/decreases in biodiversity against losses/gains in income. For example, a certain proportion of the population may hold rights-based beliefs which would prevent them from agreeing to such trade-offs (for a discussion in the intergenerational context see Spash 1993b). In the current context, I might believe that a particular species has the right to be saved from extinction regardless of its utilitarian value, or of the costs to society of preserving it. Such non-compensatory decision rules are referred to by neoclassical economists as representing “lexicographic preferences”. If lexicographic preferences are found to exist amongst a significant proportion of the population the use of CBA would be questionable. CBA is founded upon the concept of compensating for welfare losses, as expressed in the Kaldor-Hicks potential compensation test. Lexicographic preferences and the implications for CBA are discussed more fully in the next section.
2. Many individuals may be unsure as to the meaning of biodiversity, and the
economics literature (eg., Meier and Randall, 1991), others have expressed concerns that poorly informed consumers cannot be relied upon to make sensible decisions about complex environmental phenomena (eg., Sagoff, 1988). In this paper we are concerned about the extent to which people are aware of the complex issue of biodiversity protection.
In what follows, section II explains the meaning of lexicographic preferences and sets out the theoretical implications for CBA. This section also considers the implications of ill-informed consumers. Section III describes the design of two surveys carried out to assess the importance of these issues. Section IV details our main results, whilst Section V offers conclusions and suggestions for future research.
II. THEORETICAL CONSIDERATIONS
Lexicographic Preferences
The typical approach to the valuation of non-market environmental assets (such as wildlife) in environmental economics has been to treat such assets identically to marketed goods and services (eg., Braden and Kolstad, 1991). For example, if W represents the stock of
i
some particular wild species, such as golden eagles, and X represent marketed goods (where i = 1 to n), then a standard theoretical assumption is the existence of the direct utility function:
i
U = U (X , W) (1)
which is typically assumed to be weakly separable in some elements of X and W. The
1 2
willingness-to-pay (WTP) of an individual to prevent a decrease in W from W to W is given by:
1 2
WTP = e (p, W , U ) - e (p, W , U )1 1 (2)
i
where U is the post-change level of welfare, p is a price vector for X and e (.) is an1
expenditure function. An individual would therefore be prepared to give up some
summed across all affected individuals to obtain an aggregate WTP figure. Similarly, the minimum compensation demanded to accept a reduction in W for an individual is given by:
1 2
WTAC = e (p, W , U ) - e (p, W , U )0 0 (3) where WTAC is willingness to accept compensation and U is the initial, pre-change level of0
i
welfare. In this case expenditure on X rises to compensate for the reduction in W, keeping the agent at their initial level of welfare. The welfare measures of WTP and WTAC are not expected to be equivalent, due to the potential for loss aversion (Knetsch, 1990), income effects (Willig, 1976) and substitution effects (Adamowicz, Bhardwaj and MacNab, 1993).
However, some individuals may treat certain environmental goods differently from the manner suggested by this theoretical framework. If an individual believes that aspects of the environment, such as wildlife, have an absolute right to be protected, then that individual will refuse all money trade-offs which decrease what is regarded as an environmental
commodity in the neoclassical framework (Spash 1993b). In terms of equations (2) and (3) above, WTAC would be infinite and WTP the entire budget, since the respondent believes that W should remain at or above its current level (that is, that no reductions in W should be allowed). In fact individuals may express a zero WTP as a protest against the implication that such things as the right of a species to exist could be traded for other goods or money.
Such a non-compensatory stance can be viewed as evidence of a lexicographic preference. Lexicographic preferences mean that utility functions including W are
undefinable for an individual (since the axiom of continuity is violated), and that indifference surfaces are single points in (n+1) dimensional space (Gravelle and Rees, 1993). The standard explanation of lexicographic preferences in goods space is shown in Figure 1 (eg., Varian, 1984 or Malinvaud, 1972), where for simplicity only two goods, W and X, are assumed to
1 1
provide utility. Assume an individual starts with an endowment of W and X at point A. No increase in X can compensate this individual for a reduction in W (their WTAC for a decrease in W is infinite), but holding W constant and increasing X gives greater utility. Wildlife has a priority over other goods. Thus, the only point on the line segment (C, A, B) which gives
1
irrespective of any associated increase in X. As a result the shaded area of Figure 1 shows the bundles of goods W and X which are preferred to that at A; note this includes the line
segment AB. All points are either better than A or worse than A, none are of equal utility. Thus, point A, rather than an indifference curve, describes the individual's preferences and no indifference curves exist. The implication that one good (here W ) is immeasurably more important than another (here X ) has lead to lexicographic preferences being regarded as unrealistic and unlikely to occur in economics (Malinvaud, 1972 p.20).
However, some evidence for the existence of lexicographic preferences has been put forward. For example, Stevens et al. (1991) discuss the idea of a minimum level of X (in their case income) which must exist before an individual will value wildlife, and relate this to lexicographic preferences. Their explanation is described by Figure 2, which is similar to Figure 1. Again consider an individual located initially at point A. Stevens et al. (1991 p.397)
1 min
claim this individual would be WTP the same amount (X -X ) regardless of the extent to
min
which a reduction in the wildlife population is prevented. The level X , while unexplained in the Stevens et al. paper, could be regarded as the lowest amount of X which ensures human
min
survival or a minimum standard of living. At a point such as D, which lies below X , willingness to pay is undefined. Thus, WTP no longer relates to equivalent surplus; undermining its use as a measure of welfare changes. Stevens et al. collected data on individual preferences and found that around 25% of their sample revealed preferences for wildlife preservation in the USA which could be described as lexicographic in this sense.1
The description of lexicographic preferences given by Stevens et al. deviates from that normally used, and described in Figure 1, in two ways. First, they allow individuals to either
min
care solely about income (until X ) or solely about wildlife. Lexicographic preferences as described in Figure 1 allow increases in income to increase welfare as long as wildlife is unaffected. This allows movements along the line segment AB to increase welfare, rather than implying all income will be sacrificed for wildlife increases; restricting movements to
1 The species studied were bald eagle, wild turkey, coyote and salmon. Stevens et al
1 min
the right of W along X . If income becomes of no significance this would imply vertical indifference curves, ie., additional income is neither good nor bad, and the result would be corner solutions. Second, the idea of a minimum living standard as a constraint on standard lexicographic preferences restricts the extent to which X is regarded as a second class good to
min
W. This raises some interesting possibilities because X as the minimum standard of living is susceptible to being culturally determined and is consistent with a variety of material levels of well-being (Sen 1987). Thus respondents with lexicographic preferences who regard themselves as on the minimum standard of living (which can, as Sen points out, be consistent with owning say a car and a television) will be willing-to-pay nothing for increases in wildlife because they cannot afford to do so but will give an infinite valuation of a decrease in
wildlife.
If increases, rather than decreases, in W are considered an irreversible aspect of lexicographic preferences is apparent. In Figure 3 the individual is again assumed to start at
1 1 2
point A with W=W and X=X . From the above discussion an increase in W to W means the individual will be willing to give up X to have this increase in W, so long as X stays above
min 2 2
X . The combination at point E with (X , W ) would give greater utility than the
1 1
combination at point A with (X , W ) (remember that wildlife always has priority over all other goods for this individual). However, once the move to E has been made there would be no way to go back to A without reducing utility and the reduction in W this implies would be
2
given an infinite valuation. In this way W now becomes the new reference point at or above
1
which wildlife must be maintained. More generally, if W is increased the entire amount X
-min
X will be paid (the WTP amount), but if this is reversed the required compensation is infinite (the WTAC amount).
necessary and, in the neoclassical framework, would be based upon individual preferences. This criterion becomes inoperable once compensatory amounts become infinite. Furthermore CBA itself is meaningless under non-compensatory preferences. Two relevant research questions in the current context are: (i) whether any individuals actually hold lexicographic preferences for biodiversity protection; and (ii) do these individuals hold such preferences irrespective of whether a gain or a loss in biodiversity is proposed? In this paper, we present some evidence on (i), leaving (ii) for future research.
First, though, we discuss a second problem for biodiversity valuation. That is the problem of information provision and knowledge about the concept of biodiversity. One question this raises concerns the extent to which knowledge may be linked to lexicographic preferences. This line of reasoning might say that poorly informed individuals rely upon lexicographic preferences, or, more generally, individuals facing ignorance refuse trade-offs. However, we would reject the suggestion that any simple relationship exists between
information provision and ethical stance. For example, providing additional information on biodiversity to a vegan, animal rights activist is unlikely to make them become a meat eating, utilitarian. Additional information could, with equal plausibility, make respondents either more or less likely to behave in a utilitarian manner. This question might be framed as a hypothesis for empirical testing but is one which we leave for future research.
Uncertainty About Biodiversity
In this section we wish to conceptualize biodiversity as a good whose characteristics are unclear to individuals. For example, biodiversity may be important for the continued existence of an individual, or for the existence of their offspring, but the relationship is vague and the cause-effect mechanisms removed from the individual's everyday experience of life. The state of the natural environment affects welfare (or utility) in two ways: first, by
discussions of biodiversity value see McNeely 1988, Soulé and Wilcox 1980, or Wilson 1988). In the case of indirect inputs their very definition makes them less perceptible to individuals. Biodiversity provides indirect benefits in terms of ecosystem stability and the preservation of genetic variation which may one day be useful for medical, agricultural or forestry use. For example, if pests on currently-grown varieties of wheat became very difficult to control (due, for example, to the build-up of resistance to pesticides), then new varieties which were resistant to attack might be developed using the gene pool which had been safeguarded by biodiversity protection policies. Alternatively, if breeds of fish currently used in aquaculture became very susceptible to fungal attack, then again resistant species or varieties could be found given that they have been preserved as the result of biodiversity legislation. If individuals are uninformed about these possible benefits of preserving diversity, then preservation benefits will be under-stated.2
Whilst much debate has attended the problem of measuring biodiversity (eg., Solow et al., 1993), the basic idea here is that biodiversity protection is “produced” by some mix of genetic, species and ecosystem preservation.3 Thus, when individuals are asked to value a particular level of biodiversity, they are attributing value to those genes/species/ecosystems that contribute to diversity. In order to obtain a working definition of biodiversity, the
following statement has been compiled as a useful summary of key concepts, based upon the global biodiversity strategy of the World Resources Institute (WRI), the World Conservation Union (IUCN) and the United Nations Environment Programme (UNEP) (WRI, IUCN and UNEP 1992):
Biodiversity is the totality of genes, species and ecosystems in a region. Genetic diversity refers to the variation of genes within species. Species diversity refers to the variety of species within a region. Ecosystem diversity
2 Although it is possible to argue here that these expected benefits could be valued
directly by the economist (in terms of expected losses avoided) without recourse to seeking individual preferences.
3 Solow et al discuss three measures, which allow for genetic gaps between species,
refers to the variety of systems of living things in relationship with their environment, within a region.
In other words, preserving a given ecosystem, for example, generates a number of utilitarian benefits (recreational use and flood protection perhaps, for a wetland), but also generates net benefits in terms of its contribution to the measure of diversity (so long as this preservation is independent of any action which reduces diversity to a greater degree). However, in what follows biodiversity is treated as a (composite) good, rather than in terms of its determinants or services, because this is the approach most likely under a CBA due to its simplicity.
If we persist along a neoclassical route, the characteristics of biodiversity can be
i
defined as z , where i goes from 1 to m. Assume the individual has prior beliefs about the probability distribution of each of these characteristics given by a subjective probability
i
density function g(z), with a cumulative distribution function G(z ). This model is consistent with an individual believing biodiversity to have some characteristics which are in fact absent (z=0, g(z)>0); and with biodiversity actually having characteristics which the individual believes are absent (z>0, g(z)=0).
The problem can be simplified by assuming that there is only one characteristic of interest. Hanley and Munro (1994) have used this approach to show that supplying individuals with increasing amounts of “good” information (ie., information relating to desirable characteristics) will increase their true willingness to pay. Their cumulative
probability distribution is Gì (z), where Gì (z) second-order stochastically dominates G(z). This assumes that biodiversity protection enters the representative agent's utility function in
accordance with the axioms of preference, ie., preferences for biodiversity are assumed not to be lexicographic. The observation that telling people more about the characteristics of a good can increase the value they place on that good is one which seems intuitively obvious.
Although, as Hanley and Munro (1994) show, more information about a desirable
environment generally, and biodiversity in particular. Hanley and Munro also show that no general conclusion can be drawn for the impact of increased information on the variance of WTP.
A rather different, and more difficult, issue is how much information should be provided to individuals if a public agency is interested in their revealed or stated preferences as a guide to policy. This in turn begs the question as to the likely costs to the economy, in efficiency terms, of uninformed decisions.In terms of neoclassical theory, additional information should be provided to individuals as long as the expected value of that
information is greater than its cost (Adams and Crocker, 1984).4 Thus, an individual would, ex post, be willing to pay an amount up to the increase in the expected utility from the resource in question for this additional information. In addition, if the cost of providing information publicly (eg., in a contingent valuation survey) is lower than the cost faced by individuals of privately gathering the same information, then the public provision of information is efficient. However, there is also a problem over how much information on complex environmental resources, such as biodiversity, that individuals can be expected to assimilate and understand.5
Thus, for both direct and indirect benefits of biodiversity protection, we would argue that (i) uninformed preferences are likely to under-estimate the social value of biodiversity protection; and (ii) that if preferences for biodiversity protection are to be sought as a guide to policy decisions, individuals need to be given as much information on biodiversity protection as they can be reasonably expected to assimilate. In this regard, discovering the extent of ignorance amongst the public concerning the benefits of biodiversity protection becomes extremely important.
4A large literature exists in economics concerning the subject of uncertainty, for a
summary see Kreps, 1991.
5 The NOAA Panel Report on the contingent valuation method recommends that
III. EMPIRICAL EVIDENCE
Survey Design
This section reports on the collection of data from two samples to investigate the issues of (i) the level of ignorance amongst individuals regarding the meaning of biodiversity; and (ii) the willingness of individuals to trade-off changes in the level of biodiversity
protection for changes in their income in a hypothetical market situation. The first sample was drawn from the population of students at the University of Stirling, whilst the second was a stratified random sample of the general public. Students were used because they represented an easily accessible group of individuals. Student responses were compared with those of the public sample, since we were interested to know how much the student-derived results would differ from those obtained from the general public.
The student sample was obtained by advertising at the university for participants at a one-hour session. Students were offered a payment of £6 if they attended the session, and completed the requirements of the session leader (the same leader was used in all sessions). Each group consisted of about 25 students, and the total sample size was 125. The students were faced with two areas of questions; first (chronologically), with questions related to their knowledge of biodiversity (stage one). Second, with a contingent valuation question, which asks for their maximum WTP to prevent a hypothetical but well-defined reduction in biodiversity (stage two). Questions on age, sex and income were also included in stage two. At the beginning of each session, a brief, general introduction about the project was given, with students being asked to take the task seriously, think carefully before answering each question, and answer without conferring.
Stage One Results: knowledge about biodiversity
The objectives of stage one of the student survey were to (i) investigate peoples' knowledge of what biodiversity means; (ii) confront them with different notions of biodiversity; and (iii) investigate their familiarity with the “official” definitions of
biodiversity. With regard to (i), participants were asked an open-ended question which ran as follows:
"What does the word “biodiversity” suggest to you?"
Individual's responses to this question were analyzed using a word-counting programme: most common occurrences of relevant terms were "species", "different", "biological", "plants" and "diversity". With regard to (ii), three possible meanings of biodiversity were shown consecutively to respondents, who were asked to either agree, disagree or say that they were unsure if this description accorded with their understanding of biodiversity. The three possible meanings (which respondents were told were inclusive ie., more than one could be true) related to species diversity, genetic diversity and ecosystem diversity. With regard to (iii), two definitions were presented. These were, first an “official” definition, based upon the biodiversity strategy report as given earlier (WRI, IUCN and UNEP 1992), and second a definition of biodiversity applied to UK forests which was supplied by Forestry Commission researchers. Individuals were asked to score their familiarity with these two definitions on five point Likert scales, from 1 (totally unfamiliar) to 5 (totally familiar).
Simple descriptive statistics from stage one are given in Table 1. As may be seen, most disagreement was with the genetic variation aspect of biodiversity, and least
disagreement with the species variation notion. Concerning respondent familiarity with IUCN/WWF/UNEP based definition of biodiversity only 5 respondents scored 5, although 43% registered either a 3,4 or 5 score. 46 respondents (37%) were totally unfamiliar. The mean score was 2.27. The modal response was also "totally unfamiliar". This pattern is repeated for the Forestry Commission definition of biodiversity, with slightly more
34% in this category. The mean score was 2.09.
A correlation matrix is shown as Table 2. These correlations are in accordance with expectations, and indicate a degree of internal consistency in students' responses. For example, familiarity with the general definition of biodiversity is positively correlated to being aware of the species, genetic and ecosystem notions of biodiversity, and to familiarity with the forest biodiversity definition (here a high value of +0.725).6 Cross-correlations between all three notions of biodiversity (species, genetic and ecosystem variation) are all positive, although rather small. Interestingly, the correlations between the two familiarity scores and genetic diversity are lower than those between these scores and either species or ecosystem diversity. This possibly reflects the higher proportion of “disagree” responses to the genetic diversity concept.
Turning to the general public sample, the most common phrases used in answer to the question: "What does the word “biodiversity” suggest to you?" were "don't know", "haven't a clue" and "nothing". This indicates a low degree of understanding compared to the student sample, as might be expected due to the lower mean educational level of the general public. These respondents were then confronted with the three biodiversity concepts (species, genetic and ecosystem diversity) and asked whether they agreed, disagreed or were unsure about these interpretations. Results are given in Table 3. As can be seen, a roughly equal number of people agreed with each notion of biodiversity. Most disagreements were with species
diversity, while most "don't know" comments were given for ecosystem diversity. Compared with the student survey, the most striking features are (i) the greater percentage of "don't know" responses in the street survey, and (ii) the smaller proportion of "disagree" responses in the street survey.
Respondents were then confronted with the IUCN/UNEP/WWF based definition of biodiversity, and the Forestry Commission definition of biodiversity in UK forests. As with the student surveys, respondents were asked to rank their familiarity with these concepts on a
6 A positive correlation was also found with the number of conservation groups to
5 point scale from 1 (totally unfamiliar) to 5 (totally familiar). For the general biodiversity definition, the mean score was 1.52, which is lower than the student survey score of 2.27. Only 6% of respondents were totally familiar with the definition, whilst 71% were totally unfamiliar (student surveys = 37%). For the forest biodiversity definition, the mean score was 1.49 (students = 2.09), with 2% being totally familiar, and 67% being totally unfamiliar.
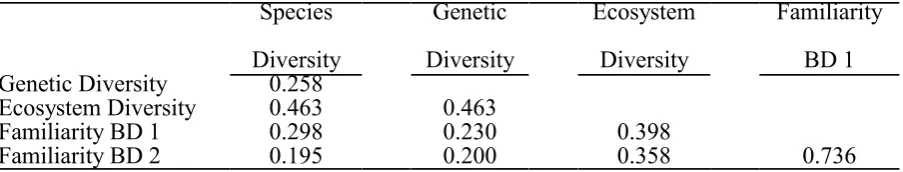
Correlation coefficients for the three biodiversity definitions and the two agency based definitions are shown in Table 4. These results also show a degree of internal consistency, as an awareness of one concept of biodiversity increases one's awareness score for another concept. For example, the familiarity scores for general biodiversity and forest biodiversity are highly positively correlated (+0.736).
Stage Two Results: biodiversity protection versus income changes
The second stage of the survey asked both samples to state their WTP to avoid a hypothetical reduction in biodiversity.7 This reduction in biodiversity was characterised as the destruction of a remnant of the Caledonian pine forest (Crannoch Wood). Such ancient woodland is a rapidly-disappearing ecosystem in Scotland, and is the principle habitat of rare birds (eg., the Capercaillie and Crested Tit) and rare mammals (eg., the Scottish Wildcat and Pine Marten). The “bid vehicle” used in this case was donations to a trust fund set up to protect the forest. Conservation bodies have used such trust funds in the past to acquire similar threatened habitats in the UK.8
We were most interested in whether individuals gave a positive or a zero WTP response. In the latter case, respondents were asked why they bid zero. The possible motives supplied to respondents include some which are consistent with a refusal to trade-off
environmental gains for changes in income. These motives were then related to the beliefs of
7 We were unable to measure Willingness to Accept Compensation measures in this
study, due to funding constraints.
8 Such as the purchase of another remnant of the Caledonian pine forest (Abernethy
respondents concerning (a) their ethical view on rights ie., whether animals, plants or ecosystems have the right to be protected regardless of what it costs society; and (b) the environmental stance of individuals eg., whether environmental problems are capable of technical fixes or require a significant change in preferences/behaviour. In case (a), sub-samples were defined according to whether respondents were asked about animal, plant or ecosystem rights. Each respondent appears in one sub-sample only. In case (b), the intention was to characterise respondents' basic attitudes to the environment, using the classification adopted by Spash (1993a).
Initially, analysis is presented on each of the student sub-samples in turn. When considering each of the sub-samples the reader should remember that the contingent valuation question, and (where appropriate) reasons for a “zero” response, were asked before the
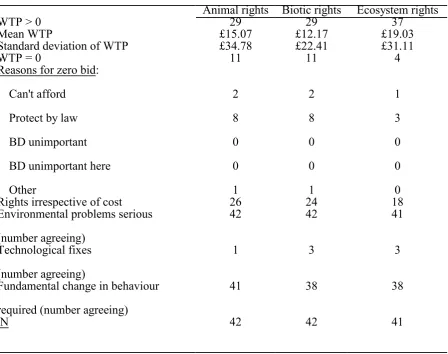
questions on beliefs or rights. A summary of our results for the student sample is given in Table 5.
Sub-sample one: animal rights. Of 42 responses in this class, 29 individuals were WTP some positive amount to protect biodiversity. The mean bid was £15.07, the standard deviation £34.78. Of those 11 bidding zero, the motives for so doing were: "can't afford it" (one person), "Biodiversity should be protected by law" (eight people) and "other" (one person). No zero responses were tendered for reasons of zero value. All 42 respondents said that animals had the right to be protected. While 16 individuals said that animals should be protected in relation to the cost, only 26 said that this right should be upheld regardless of the cost (a belief in absolute rights). These 26 persons included 19 individuals who were WTP some positive amount, ie., in spite of their implied infinite valuation. This might be
interpreted as either:
(i) Inconsistent preferences. This could be taken as implying that the WTP bids of such respondents are failing to show their true preferences under the contingent valuation method; or
The correlation coefficient between a belief in rights and WTP was -0.075, so that WTP falls as a belief in rights increases.
All respondents said that environmental problems are serious, and only one stated that they could be solved by technological fixes. This shows a strong tendency towards the
classification of deep ecologist or environmental vanguard in this sample. The former position would reject the neoclassical utilitarian approach while the latter can be consistent with this but evidence shows is liable to reject it in favour of a rights-based approach (Spash 1993a). The classification of ecologists as shallow and deep is due to Arne Naess (1973). Shallow ecologists are concerned with the welfare of beings or a sub-group of human-beings, while deep ecologists take a holistic view emphasising the interrelated nature of all things and the equal right of each being to “live and blossom”. Such a rights-based system of belief is clearly at odds with the teleological perspective of utilitarianism. The environmental vanguard has been defined by Milbraith (1984) as comprising individuals who place a high value on nature, are compassionate towards other species, people and generations, wish to plan and act to avoid risks to ecosystems, recognise the limits to growth, and believe a new society is required which changes human economic and political behaviour rather than relying on technical solutions to environmental problems.
in absolute rights. Again all 42 respondents thought that environmental problems are serious, with only 3 indicating a faith in technological fixes.
Sub-sample three: ecosystem rights. Of 41 responses in this class, 37 individuals were WTP some positive amount to protect biodiversity. The mean bid was £19.03 and the
standard deviation £31.11. Four persons tendered a zero bid. The motives given were: "can't afford it" (one person), "protect by law" (three people) and "biodiversity protection
unimportant" (one person). However, the person saying that biodiversity protection was unimportant in this case also bid £100, so the response may be disregarded since the subject clearly failed to understand the question. This same respondent was the only individual stating that ecosystems had no rights to be protected ie., 40 respondents stated that ecosystems have a right to be protected. Amongst these there were 18 respondents who believed that this right should exist regardless of cost. Of these 18 “absolute rights”
respondents, 16 stated a positive bid. The correlation between WTP and a belief in absolute rights was +0.365. All 41 respondents believed environmental problems to be serious, with only 3 believing in technological fixes.
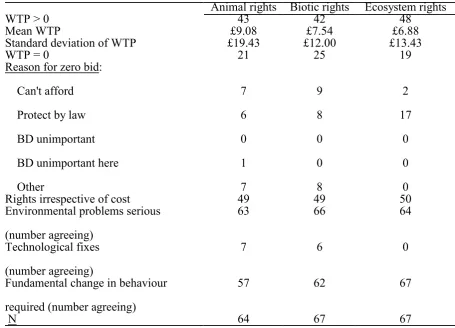
For the general public sample, an identical survey was carried out. The results are summarised in Table 6. In sub-sample one (animal rights) only one person stated a genuine zero WTP. All 64 respondents said that animals had the right to be protected, and 49 said that this should be done irrespective of the costs. These persons included 35 who were WTP some positive amount, and 14 who refused to state a WTP figure. The correlation coefficient between a belief in absolute rights and WTP was -0.104.
In sub-sample two (biotic rights) of 67 respondents in this class, 42 were WTP some positive amount. No zero bids were given for reasons of zero value. All 67 respondents said that plants/trees had the right to be protected, of which 49 said that protection should be given irrespective of the costs. Those believing in absolute rights but tendering a positive WTP numbered 33, those refusing to state a positive WTP numbered 16. The correlation coefficient between a belief in absolute rights and WTP was 0.181.
zero value. All but one respondent thought ecosystems had the right to be protected, with 50 of these persons believing that this protection should be extended regardless of the cost. Of these 50 “absolute rights” respondents, 34 were WTP some positive amount for biodiversity protection, whilst 16 refused to state a WTP figure. The correlation between WTP and absolute rights was +0.022.
So long as responses on income, education, and membership of conservation
organisations were unaffected by which rights question respondents received, then responses from the three sub-samples of the general public survey can be aggregated. The following results apply to the resultant data set, which contains 198 responses. This gives the
information, shown in Table 7, on familiarity with the general biodiversity definition, WTP, income, sex, membership of conservation groups and educational level.
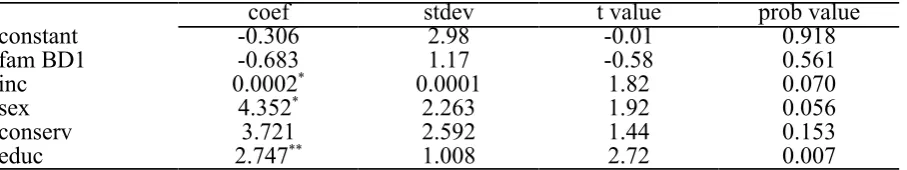
A simple linear bid curve was estimated to indicate the determinants of WTP. The coefficients of this function are shown in Table 8. As may be seen, inc, educ and conserv are all correctly signed; famBD is incorrectly signed but has an extremely high standard error. Educational achievement, on this evidence, is the strongest influence on willingness to pay to protect biodiversity. Alternative functional forms might give a better fit in terms of the R2
measure, whilst we might also wish to include attitudinal variables from the rights questions; however, these vary across sub-samples, so have in this instance been omitted from the aggregated data set. Also, there were very few respondents in the no-rights classification.
The mean WTP was thus £8.01 (including protests), which is lower than the mean WTP amongst the student sample (£15.42), even though mean income was much lower in the latter group. This might reflect more environmental concern on the part of students, or that the sample of students was biased in this respect. The mean educational level was obviously lower in the street sample than in the student sample.
IV. CONCLUSIONS
from the student survey section lead to the conclusion that biodiversity is a poorly understood concept among the majority of the sample. This lack of knowledge occurs despite the sample being highly skewed in educational terms. Our conclusion from the survey of the general public on definitions of biodiversity is that, compared with the student surveys, biodiversity is understood even less. This raises concern over consulting the general public for their
valuations of biodiversity. Information assimilation within a survey context is restricted and will only be able to initiate respondents as to what is being discussed. Under such
circumstances, where the general public is basically uninformed about a public good, the information given will be helping to form preferences rather than inform existing preferences.
On the prevalence of lexicographic type preferences for biodiversity preservation, two main measures of the extent of a refusal to trade-off income against biodiversity protection are available: (i) respondents who stated that animals/ecosystems/plants should be protected irrespective of the costs and who refused to give a WTP amount; and (ii) as with (i), but where individuals have a positive WTP. Considering the general public sample we find these categories contain 46 respondents (23.2%) and 148 respondents (74.7%) respectively. Note, the general public sample is important from the perspective of the wider application of the contingent valuation method. Category (i) respondents are identified as having lexicographic preferences.
Category (ii) respondents represent an interesting case, since they are indicating that they believe that decreases in biodiversity should be avoided, yet are WTP relatively small amounts, in terms of their disposable income, to offset a threatened reduction. Such
individuals have a minimum living standard requirement and are close to this income which would make their behaviour consistent with the modified lexicographic position of Figures 2 and 3. On balance, we would wish to avoid classifying category (ii) respondents as having lexicographic preferences without supporting tests of these hypotheses, and thus treat their responses as unreliable. Therefore, we would judge around one quarter of individuals (ie., those in category (i) to have lexicographic preferences, indicative of a refusal to accept trade-offs, on this evidence.
An anonymous referee has questioned the extent to which category (i) individuals are lexicographic rather than merely desirous of a change in government expenditure between projects, and therefore reject giving willingness-to-pay answers. However, 67% of these individuals believe that "biodiversity should be protected by law, and we shouldn't have to pay money to protect it", which is inconsistent with paying for it via a reallocation of resources (you still pay at the end of the day). In addition, individuals who felt the
government should switch funds from other projects could easily have stated so under "other reasons (please state)", but nobody did so. Thus, there is little reason to support this
criticism.
The prevalence of lexicographic preferences clearly has implications for the
acceptability of the contingent valuation method in valuing biodiversity protection, which is reinforced by the strong evidence of a high degree of ignorance concerning individuals understanding of the very concept of biodiversity. As suggested earlier, interesting further research would be to repeat the survey giving respondents WTAC questions as well as the WTP question used here, to see whether WTAC scenarios yield responses more in line with revealed ethical beliefs. The relationship of hypothetical bids for biodiversity protection with actual bids in an experimental situation would also be worthy of study.
ACKNOWLEDGEMENTS
REFERENCES
Adams, R.M. and Crocker, T.D., 1984. Economically relevant response estimation and the value of information. In T.D. Crocker (editor) Economic Perspectives of Acid Deposition Control. London, Butterworth.
Adamowicz, WL, Bhardwaj, V and MacNab B (1993) "Willingness to pay and willingness to accept compensation". Land Economics, 69 (4), 416-427.
Braden, J. and Kolstad, C., 1991. Measuring the Demand for Environmental Quality. Amsterdam, Elsevier North-Holland.
Gravelle, H. and Rees, R., 1992. Microeconomics, 2nd Edition. Harlow, Essex, Longmans. Hanley, N. and Munro, A., 1994 "The effects of information in contingent markets for
environmental goods". Discussion papers in Ecological Economics, Economics Department, University of Stirling, no.94/5, 34pp.
Knetsch, J (1990) "Environmental policy implications of the disparity between willingness to pay and compensation demanded". Journal of Environmental Economics and
Management, 18, 227-237.
Kreps, D., 1990. A Course in Microeconomic Theory. Hemel Hempstead, Harvester-Wheatsheaf.
Malinvaud, E., 1972. Lectures on Microeconomic Theory. Amsterdam, North-holland. McNeely, J.A., 1988. Economics and Biological Diversity. Gland, Switzerland, IUCN. Meier, C. and Randall, A., 1991. Use value under uncertainty. Land Economics, 67 (4),
379-389.
Milbraith, L.W., 1984. Environmentalists: Vanguard for a New Society. New York, State University Press.
Mitchell, R. and Carson, R., 1988. Using Surveys to Value Public Goods: the Contingent Valuation Method. Washington DC, Resources for the Future.
Sagoff, M., 1988. The Economy of the Earth. Cambridge, Cambridge University Press. Sen, A., 1987. The Standard of Living. Cambridge, Cambridge University Press.
Solow, A., Polasky, S. and Broadus, J., 1993. On the measurement of biological diversity. Journal of Environmental Economics and Management, 24 (1), 60-68.
Soulé, M.E. and Wilcox, B.A., 1980. Conservation Biology. Sunderland, Massachusetts, Sinauer Associates.
Spash, C.L., 1993a. Estimating the importance of inviolable rights: the case of long-term damages and future generations. Unpublished report to the Scottish Economic Society.
Spash, C.L., 1993b. Economics, ethics and long-term environmental damages. Environmental Ethics, 15 (2), 117-132.
Stevens, T., Echevarria, J., Glass, R., Hager, T. and More, T., 1991. Measuring the existence value of wildlife: what do CVM estimates really show. Land Economics, 67 (4), 390-400.
Varian, H.R., 1984. Microeconomic Analysis, 2nd edition. New York, W.W. Norton.
Willig R (1976) "Consumers' surplus without apology" American Economic Review, 66, 589-597.
Wilson, E., (editor) 1988. Biodiversity. Washington, DC, National Academy Press. WRI, IUCN, UNEP, 1992. Global Biodiversity Strategy. New York, World Resources
Table 1 Definitions of biodiversity: student responses Agreement with Definitions (% of sample)
Species Diversity Genetic Diversity Ecosystem Diversity
Agree 49.6 46.4 44.0
Disagree 31.2 36.8 33.6
Don't Know 19.2 16.8 22.4
[image:26.595.71.533.249.336.2]N 125 125 125
Table 2 Correlation Matrix for Student Sample Species Diversity Genetic Diversity Ecosystem Diversity Familiarity BD 1 Genetic Diversity 0.109
Ecosystem Diversity 0.182 0.083
Familiarity BD 1 0.309 0.108 0.329
Familiarity BD 2 0.267 0.075 0.338 0.725 Familiarity BD 1 = familiarity with biodiversity (general definition)
Familiarity BD 2 = familiarity with biodiversity (forestry definition)
Table 3 Definitions of biodiversity: public responses Agreement with Definitions (% of sample)
Species Diversity Genetic Diversity Ecosystem Diversity
Agree 40.0 39.0 40.5
Disagree 16.0 12.5 9.0
Don't Know 44.0 48.5 50.5
N 200 200 200
Table 4 Correlation Matrix for Public Sample Species Diversity Genetic Diversity Ecosystem Diversity Familiarity BD 1 Genetic Diversity 0.258
Ecosystem Diversity 0.463 0.463
Familiarity BD 1 0.298 0.230 0.398
Familiarity BD 2 0.195 0.200 0.358 0.736 Familiarity BD 1 = familiarity with biodiversity (general definition)
[image:26.595.70.523.443.517.2] [image:26.595.73.525.575.661.2]Table 5 Summary Results for Student Stage Two Responses
Animal rights Biotic rights Ecosystem rights
WTP > 0 29 29 37
Mean WTP £15.07 £12.17 £19.03
Standard deviation of WTP £34.78 £22.41 £31.11
WTP = 0 11 11 4
Reasons for zero bid: Can't afford Protect by law BD unimportant BD unimportant here Other 2 8 0 0 1 2 8 0 0 1 1 3 0 0 0
Rights irrespective of cost 26 24 18
Environmental problems serious (number agreeing)
42 42 41
Technological fixes (number agreeing)
1 3 3
Fundamental change in behaviour required (number agreeing)
41 38 38
Table 6 Summary Results for Public Stage Two Responses
Animal rights Biotic rights Ecosystem rights
WTP > 0 43 42 48
Mean WTP £9.08 £7.54 £6.88
Standard deviation of WTP £19.43 £12.00 £13.43
WTP = 0 21 25 19
Reason for zero bid: Can't afford Protect by law BD unimportant BD unimportant here Other 7 6 0 1 7 9 8 0 0 8 2 17 0 0 0
Rights irrespective of cost 49 49 50
Environmental problems serious (number agreeing)
63 66 64
Technological fixes (number agreeing)
7 6 0
Fundamental change in behaviour required (number agreeing)
57 62 67
Table 7 WTP Analysis: Street Survey
Mean Standard Deviation
WTP (£) 8.01 15.40
Familiarity BD1 (1 to 5) 1.54 1.00
Income (£) 14696.00 10273.00
Sex (0=male 1=female) 0.51 0.50
Conservation Groups (number) 0.19 0.44
Education (1 to 4)* 1.23 1.25
Note: Highest educational achievement: 1= O'grade; 2= higher/A'levels; 3= undergraduate;*
4= post-graduate.
Familiarity with the general BD definition (famBD1), willingness-to-pay (WTP), income (inc), sex (sex), membership of conservation groups (conserv) and educational level (educ).
Table 8 Bid Curve Coefficients: Street Sample
coef stdev t value prob value
constant -0.306 2.98 -0.01 0.918
fam BD1 -0.683 1.17 -0.58 0.561
inc 0.0002* 0.0001 1.82 0.070
sex 4.352* 2.263 1.92 0.056
conserv 3.721 2.592 1.44 0.153
educ 2.747** 1.008 2.72 0.007
[image:29.595.73.527.371.456.2]APPENDIX
The University of Stirling is conducting a research project concerning peoples" attitudes to the environment. This partly involves asking members of the public for their knowledge about, and views on, environmental issues. We would be very grateful for a few minutes of your time to answer a short questionnaire. All replies are completely anonymous.
1. In just a few words, what does the word "biodiversity" suggest to you? _________________________________________________________ _________________________________________________________
2. Please answer "agree," "disagree," or "don't know": "Biodiversity" is a measure of the number of different species of animals and plants in a particular area (such as the Scottish Highlands): for example, the number of different types of birds (golden eagles, sparrows, blackbirds...), the number of different types of trees (oak, ash, elm...).
Agree Disagree Don't know
3. Please answer "agree," "disagree," or "don"t know": "Biodiversity" is a measure of the extent of genetic variation within a particular species; for example, different sorts of apple trees, different types of wheat, different breeds of sheep...
Agree Disagree Don't know
4. Please answer "agree," "disagree," or "don't know": "Biodiversity" measures the number of different ecosystems in a particular area (such as Britain). For example, these different ecosystems include marshes, pine forests, coastal beaches and grass meadows. The more different sorts of ecosystem there are in Britain, the greater is the level of biodiversity in Britain.
5. The next question gives a definition and asks how familiar it is to you: Biodiversity is
officially defined as the totality of genes, species, and ecosystems in a region. Genetic
diversity refers to the variation of genes within species. Species diversity refers to the variety of species within a region. Ecosystem diversity refers to the variety of systems of living things in relationship with their environment, within a region.
How familiar were you with "biodiversity" as defined here before taking part in this survey? Answer by naming a digit from 1 to 5, where 1 means "totally unfamiliar," and 5, "totally familiar."
1 2 3 4 5
(totally unfamiliar) (quite familiar) (totally familiar)
6. Now we wish to discover your familiarity with biodiversity in the context of British forests: Biodiversity as it applies to British forests means habitats for many kinds of
organisms, not only of species of vegetation but also of animals, fungi, and bacteria; the kind and number of such habitats depend on the total number of species of trees, on which species are dominant, and on the complex spatial and temporal patterns that occur in forests.
How familiar were you with "biodiversity" as defined here before taking part in this survey? Answer by naming a digit from 1 to 5, where 1 means "totally unfamiliar," and 5, "totally familiar."
1 2 3 4 5
(totally unfamiliar) (quite familiar) (totally familiar)
7a. Now we will consider how you might value British Forests as a significant source of biodiversity, using an example. Crannoch Wood, a Highland pine forest, is not easily accessible to the public, but is very important in terms of biodiversity. Many birds and animals found here are rare, including the pine marten, the crested tit, and the capercaillie. Imagine that this wood was threatened by clear felling, and could only be saved by public subscription to a charitable trust fund. The sole purpose of this charitable trust would be to buy and look after the wood. What is the most that you as an individual would be willing to pay as a once only payment to save Crannoch Wood?
7b. If you have said that you would not be willing to pay anything, is this because (please tick just one sentence):
i. You can't afford any extra expenditure?
ii. You think biodiversity should be protected by law, and we shouldn't have to pay money to protect it?
iii. You don't believe that biodiversity protection is important at all?
iv. You don't believe that biodiversity protection is important in this particular example v. Other reason (please state)
_________________________________________________________ _________________________________________________________
We now want to ask you some other questions about your attitudes to biodiversity.
8. Do you believe that wild animals have the right to be protected?
yes no
In many cases, protecting wild animals is costly: for example, in terms of foregone
development benefits (such as timber, in the case of the wood), or in fencing and monitoring costs.
If your answer (at 8) was "yes":
8a. Do wild animals have the right to be protected irrespective of what this costs society?
yes no
If your answer (at 8) was "no":
8b. If protection of wild animals was to be made much cheaper, then would you wish them to be protected?
yes no
9a. Do you believe that environmental problems are of serious concern today?
yes no
9b. Which of the following two statements do you agree with most? i. Environmental problems will be solved by technological progress
Finally, it would be of great help to us if you could give us some information about yourself, bearing in mind that you will remain anonymous.
10. Is the gross (before tax, etc.) annual income of your household (please tick/circle one) under £5,000 £5-10,000 £10-15,000 £15-20,000
£20-25,000 £25-30,000 over £30,000
11. Are you (please tick/circle one) male female
12. Do you belong to (please tick/circle all that you belong to) Greenpeace
Friends of the Earth
World Wide Fund for Nature (WWF)
Any other conservation organisations (please say which)
_____________________________________________________
13. Do you have (please tick/circle all that you have) O grade/CSE/Standard Grade
Higher grade/A level Undergraduate Degree Postgraduate Degree