http://dx.doi.org/10.4236/fns.2015.69077
How to cite this paper: Kumar, K.A., Sharma, G.K., Khan, M.A. and Semwal, A.D. (2015) Optimization of Multigrain Premix for High Protein and Dietary Fibre Biscuits Using Response Surface Methodology (RSM). Food and Nutrition Sciences, 6, 747-756. http://dx.doi.org/10.4236/fns.2015.69077
Optimization of Multigrain Premix for High
Protein and Dietary Fibre Biscuits Using
Response Surface Methodology (RSM)
Kathalsar Ashwath Kumar, Gopal Kumar Sharma*, Mohammed Ayub Khan, Anil Dutt Semwal Cereals and Pulses Technology Division, Defence Food Research Laboratory, Siddarthanagar, Mysore,
Karnataka, India
Email: *[email protected], *[email protected]
Received 23 April 2015; accepted 8 June 2015; published 11 June 2015
Copyright © 2015 by authors and Scientific Research Publishing Inc.
This work is licensed under the Creative Commons Attribution International License (CC BY). http://creativecommons.org/licenses/by/4.0/
Abstract
In order to improve the nutritional quality of biscuits, a multigrain premix (MGP) was developed by using whole barley, sorghum, chickpea, pea and defatted soya flour, each at 20% level. The de-veloped MGP had 26.28% protein, 10.13% insoluble dietary fiber and 7.38% soluble dietary fiber. The experiment was designed to optimise the MGP and wheat flour concentration for the devel-opment of multigrain biscuits with high protein, dietary fibre and to maximize the acceptability by the application of central composite rotatable design (CCRD) of Response Surface Methodology (RSM). The levels of incorporation of MGP and wheat flour were taken as variables whereas pro-tein, soluble, insoluble fibers, biscuit dough hardness, breaking strength and overall acceptability (OAA) as responses. The optimum level of MGP and wheat flour obtained using numerical optimi-zation was found to be 40 g and 60 g respectively. The biscuits prepared using these had 16.61% protein, 2.57% soluble fibre, and 6.67% insoluble fibre which is significantly (p ≤ 0.05) higher than control biscuit.
Keywords
Multigrain Biscuits, Breaking Strength, High Protein and Fiber, Multigrain Premix, Response Surface Methodology (RSM)
1. Introduction
In recent years, there is an increased demand for fiber and protein rich, nutritious ready-to-eat foods with
ex-*
tended shelf life, satisfying taste and texture [1]. Among ready-to-eat foods, biscuits are one of the most popular, convenient food consumed both in urban and rural areas [2]. The basic formulation of biscuit contains wheat flour, sugar and fat apart from baking chemicals like baking powder, sodium bicarbonate and salt [3]. Wheat flour used in the biscuit making is refined wheat flour of 60 to 75% extraction in which the major portion of minerals, vitamins, fibres found in the bran layer is partially or totally removed [1]. Biscuits can be considered as a better vehicle for fortification and enrichment with protein and other vital nutrients, as it is popular among all age groups of the population [4]. Enrichment of biscuits by replacing the wheat flour with high protein ingre-dients such as pulses, oil seeds, protein concentrates, isolates and industrial by-products has been reported by many authors [5] [6].
The demand for fibre-enriched baked products to increase the consumption of dietary fibre and also to de-crease the caloric density of the baked goods is getting importance [7]. Consumption of dietary fibre is asso-ciated with various health benefits like lowering of cholesterol, glycemic index level, colon cancer, bowel dis-orders and to improve lipid metabolism [8]. Use of grains or a combination of one or two grains, legumes, and oilseeds is a recent trend in the baking industry as it gives multiple health benefits apart from improved taste, aroma, appearance and variety [9]. Earlier, many authors have used protein and fibre rich ingredients to improve the nutritional quality of biscuits [3] [10]. Combination of cereals, pulses and oil seeds will give the combined effect of increased quality protein and dietary fibre in the end product [11].
Generally, optimization was done by means of varying one parameter while keeping the others at a constant level or varying both parameters. The main disadvantage of this method was that it does not include interactive effects among the other variables, and also does not represent the effects of various parameters on their res-ponses [12]. RSM, which uses CCRD to fit a first- or second-order polynomial by a least significance technique, is used to optimize the variables (MGP and wheat flour) for the development of biscuits with high protein and dietary fibre [13]. The RSM technique gives the effect of an individual parameter as well as interactive effect of the parameters [14]. Earlier also, many authors have used RSM for food product development and process opti-mization [15]-[17].
There is no available report on the development of MGP and its optimization for biscuits. With the above background, considering the necessity of increasing both protein and dietary fibre ingestion and also keeping in mind the customers demand for healthier foods with high sensory quality, optimization of MGP for biscuit was carried out.
2. Material and Methods
2.1. Raw Materials
The grains like sorghum (Sorghum vulgare), barley (Hordeum vulgare L.), chickpea (Cicer arietinum), pea ( Pi-sum sativum), commercial wheat flour (Double Nandi Brand), sugar, skimmed milk powder (Nandini brand, Karnataka Milk Federation, Mysore, India) and vanilla essence (Bush Boake Allen Ltd., Chennai, India) were procured from the local market, Mysore, India. The defatted toasted soya flour (Glycine max) was procured from Sakthi Soya Company, Pollachi, Tamil Nadu, India. Marvo pride brand bakery shortening for biscuit was pro-cured from Bunge India Pvt. Ltd., Mumbai, India.
2.2. Preparation of Multigrain Premix (MGP)
The grains like sorghum, barley, chickpea and peas were cleaned and milled separately using an ultra-centrifugal mill (Retsch ZM 200, Germany) using 200 µm sieve. The milled flours were packed separately in an airtight container and stored at 4˚C for further use. Based on preliminary studies, MGP containing five different grains were selected and combined in the ratio of 1:1, to get maximum benefit of protein and dietary fiber in MGPs without adversely affecting the sensory characteristics of biscuits. All flours at 1:1 ratio were combined in a Hobart mixer (Model N50, Hobart Gmbh, Offenburg, Germany) and mixed for 10 min to get homogenous mix. The mixed MGP was sieved through 200 µm sieve to get uniform particle size.
2.3. Physico-Chemical Characteristics and Proximate Composition of MGP and Biscuits
whe-reas the soluble and insoluble dietary fibres were estimated according to the method [19]. The carbohydrate content was calculated by the difference method (100 − % moisture + % crude protein + % crude fat + % ash + % fiber). Energy content was calculated by multiplying protein, fat and carbohydrate contents by factors of 4, 9 and 4, respectively. The mean of three independent determinations was reported.
2.4. Experimental Design
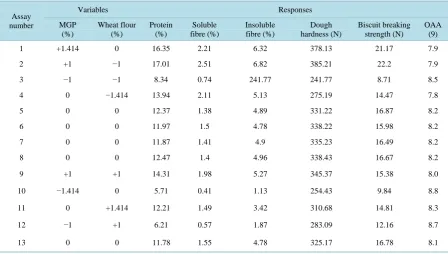
A CCRD analysis was used to optimize and evaluate the effect of two variables (MGP and wheat flour) on res-ponses (protein (%), soluble fibre (%), insoluble fibre (%), dough hardness (N), breaking strength (N) and OAA). Based on previous preliminary baking experiments, the variable ranges were determined and presented with their coded and actual values in Table 1. The proportion of each flour was expressed as a fraction of the mixture and for each treatment combination, the sum of the components proportion was equal to 100; where xi= x1 + x2
= 100%.
The thirteen different experiments were carried out with four factorial points, five replicates of central points and four axial points and presented in Table 2. Experiments were conducted randomly to minimize the effect of unexplained variables in the observed responses due to extraneous factors [20].
The results for the CCRD were used to fit second-order polynomial equation. The regression analysis of the responses was conducted by fitting suitable models represented by (1) & (2)
1) First order linear equation
0 1 n
i i i
Y β βx
=
[image:3.595.89.538.371.442.2]= +
∑
Table 1. Experimental ranges and levels of variables used in RSM in terms of actual and coded factors.
Variables
Range of levels
Low actual Low coded High actual High coded
A MGP (%) 10.00 −1.000 40.00 1.000
B Wheat flour (%) 60.00 −1.000 90.00 1.000
Table 2. Experimental design and responses for high protein and dietary fibre enriched biscuits.
Assay number
Variables Responses
MGP (%)
Wheat flour (%)
Protein (%)
Soluble fibre (%)
Insoluble fibre (%)
Dough hardness (N)
Biscuit breaking strength (N)
OAA (9)
1 +1.414 0 16.35 2.21 6.32 378.13 21.17 7.9
2 +1 −1 17.01 2.51 6.82 385.21 22.2 7.9
3 −1 −1 8.34 0.74 241.77 241.77 8.71 8.5
4 0 −1.414 13.94 2.11 5.13 275.19 14.47 7.8
5 0 0 12.37 1.38 4.89 331.22 16.87 8.2
6 0 0 11.97 1.5 4.78 338.22 15.98 8.2
7 0 0 11.87 1.41 4.9 335.23 16.49 8.2
8 0 0 12.47 1.4 4.96 338.43 16.67 8.2
9 +1 +1 14.31 1.98 5.27 345.37 15.38 8.0
10 −1.414 0 5.71 0.41 1.13 254.43 9.84 8.8
11 0 +1.414 12.21 1.49 3.42 310.68 14.81 8.3
12 −1 +1 6.21 0.57 1.87 283.09 12.16 8.7
[image:3.595.89.538.468.722.2]2) Second order polynomial equation
2 0
1 1 1
n n n
i i ii i ii i ij
i i i j
Y β βx β x β x x
= = ≠ =
= +
∑
+∑
+∑
where, β0 was the value of the fitted response at the center point of the design, i.e., point (0, 0, 0) in case MGP
and wheat flour; xi, xijwerevariables; βi, βii and βi j were regression coefficients and n denoted the number of variables.
The optimization of multigrain biscuits for protein and dietary fibre enrichment was performed according to the method [21] [22]. Design Expert 7.0.0 software (Stat Ease Inc., Minneapolis, MN) was used to generate the models that fit the experimental data, draw the response surface plots and Analysis of Variance (ANOVA) to obtain the coefficients of the final equation for better accuracy. Three-dimensional (3D) surface plots were drawn to illustrate the interactive effects. All the individual desirability functions obtained for each response were combined into an overall expression, which is defined as the geometrical mean of the individual functions. The higher the desirability value, the more adequate is the system. In this study, desirability functions were de-veloped in order to obtain maximum protein, soluble fibre, insoluble fibre, OAA and minimize biscuit dough hardness and breaking strength. All variables of the polynomial regression at a significance level of p ≤ 0.05 were included in the model, and the coefficient of determination (R2) was generated in order to assess the ade-quacy of the model.
2.5. Preparation of Biscuit
Biscuits were prepared according to the AACC method 10 - 52 [18] with some modifications (Figure 1). The ingredients used for the preparation of biscuits were wheat flour 100 g, pulverized sugar 35 g, bakery shortening 20 g, sodium chloride 0.5 g, sodium bicarbonate 0.5 g, ammonium bicarbonate 1 g, skimmed milk powder 2 g, dextrose 2 g and vanilla essence 1 ml. The same procedure was used for the development of multigrain biscuits except the replacement of wheat flour with MGP according to the experimental design and maintaining remain-ing remain-ingredients constant for all the experiments. After coolremain-ing the biscuits were stored in airtight container for further analysis.
2.6. Biscuit Dough Hardness
The hardness of the biscuit dough for all the assays was measured using texture profile analysis (TPA) method
[23] using a texture analyzer (TA-HD plus, Stable Micro Systems, Surrey, UK). The hardness of the biscuit
dough was measured with 50 Kg load cell. The following conditions were used: biscuit dough thickness, 10 mm (circular disc); diameter, 40 mm; circular probe-80 mm diameter; crosshead speed, 50 mm/min; compression— 50% of dough height. The mean of three independent determinations was reported.
2.7. Biscuit Breaking Strength
The breaking strength of biscuit was determined by texture analyzer using triple beam snap (three point break) techniques as per method [24]. The peak force from the resulting curve indicated as the breaking strength of biscuits. The mean of three independent determinations was reported.
2.8. Sensory Evaluation of Biscuits
Sensory quality of multigrain biscuits (MGBs) was evaluated by twenty panellists of age between 25 to 50 years, including both male and female, who had earlier experience in quality evaluation of bakery products. They were further oriented in four sessions, including two hours of training in each session. The samples were evaluated in triplicates by each panellist for its overall acceptability on a 9 point hedonic scale (1 = dislike extremely, 5 = neither like nor dislike and 9 = like extremely) according to the method [25]. The samples were identified by code numbers and presented in a random order to the panellist.
2.9. Statistical Analysis
Figure 1. Flow chart for the preparation of biscuit.
7.0.0 software (Stat Ease Inc., Minneapolis, MN). Analysis of variance (ANOVA) was used to test the signific-ance of each variable (p ≤ 0.05) and to verify the adequacy of the model. Interaction effects were determined using LS means (p ≤ 0.05). All experiments were carried out in triplicate.
3. Results and Discussion
3.1. Flour Analysis3.2. Effect of Variables on the Selected Responses
The 13 experimental combinations of CCRD with two selected variables were presented in Table 2. Incorpora-tion of MGP significantly (p ≤ 0.05) increased the protein, soluble and insoluble fibres content in biscuits. The increase in protein content is mainly due to the presence of defatted soya flour, chickpea and pea flour in the MGP. Particularly, soya is known for its rich protein content with high levels of lysine and other micronutrients
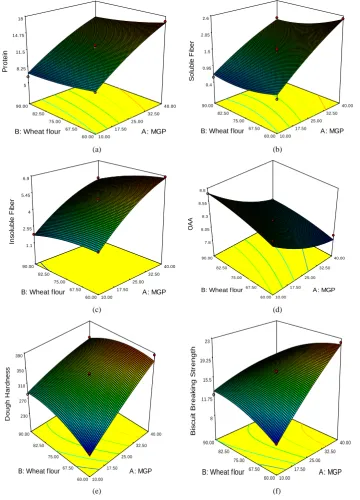
[27]. Barley will contribute for soluble and insoluble dietary fibers, particularly soluble fiber component beta- glucan, which is reported to lower cholesterol levels [8]. Sorghum with husk will contribute to soluble and inso-luble fiber along with polyphenols, which results in the high fiber content in the MGP [28]. Figures 2(a)-(c)
(a) (b)
(c) (d)
[image:6.595.120.481.199.700.2]
(e) (f)
Figure 2. 3D plot depicting the effect of MGP (%) and wheat flour (%): (a) Protein (%); (b) Soluble fiber (%); (c) Insoluble fiber (%); (d) OAA; (e) Dough hardness; and (f) Breaking strength of biscuits.
10.00 17.50 25.00 32.50 40.00 60.00 67.50 75.00 82.50 90.00 5 8.25 11.5 14.75 18 P rot ei n A: MGP B: Wheat f lour
10.00 17.50 25.00 32.50 40.00 60.00 67.50 75.00 82.50 90.00 0.4 0.95 1.5 2.05 2.6 S ol ubl e F iber A: MGP B: Wheat f lour
10.00 17.50 25.00 32.50 40.00 60.00 67.50 75.00 82.50 90.00 1.1 2.55 4 5.45 6.9 Ins ol ubl e F iber A: MGP B: Wheat f lour
10.00 17.50 25.00 32.50 40.00 60.00 67.50 75.00 82.50 90.00 7.8 8.05 8.3 8.55 8.8 O AA A: MGP B: Wheat f lour
10.00 17.50 25.00 32.50 40.00 60.00 67.50 75.00 82.50 90.00 230 270 310 350 390 D ough H ar dnes s A: MGP B: Wheat flour
shows the effect of MGP on the responses viz. protein, soluble fibre and insoluble fibre contents. Earlier, [29]
optimized cereal-millet based nutri-bar and reported the significant increase in protein, fat, fiber and ash content. Biscuit dough hardness and breaking strength are important physical parameters in the biscuit quality evalua-tion, which in turn affect the sensory attributes of biscuits. Figure 2(e)and Figure 2(f)show the effect of MGP on dough hardness and biscuit breaking strength respectively. The hardness of the dough increased with the in-crease in MGP addition [30]. The increase in the dough hardness may be due to presence of greater number of hydroxyl groups, which exist in the fiber structure of MGP, allows more water interaction through hydrogen bonding [31]. The breaking strength of biscuits increased with the incorporation of MGP. This breaking strength stimulates the evaluation of hardness by consumer holding the biscuits in hands and breaking by bending [32]. Similar finding of increased breaking strength of biscuits by adding fenugreek seed and flax seed was reported
[33]. Sensory attributes plays an important role in modification, improvement, development and acceptance of new food products [14]. Figure 2(d) depicts the effect of variables on OAA of biscuits, which reduced signifi-cantly (p ≤ 0.05) with the incorporation of MGP. Earlier, [10] also reported reduction in OAA score of biscuits with the 30% addition of roasted, steamed or microwave treated wheat bran. Addition of increased level of rice bran and fenugreek flour blends decreased the OAA scores of cookies [34].
3.3. Regression Equations and Model Fitting
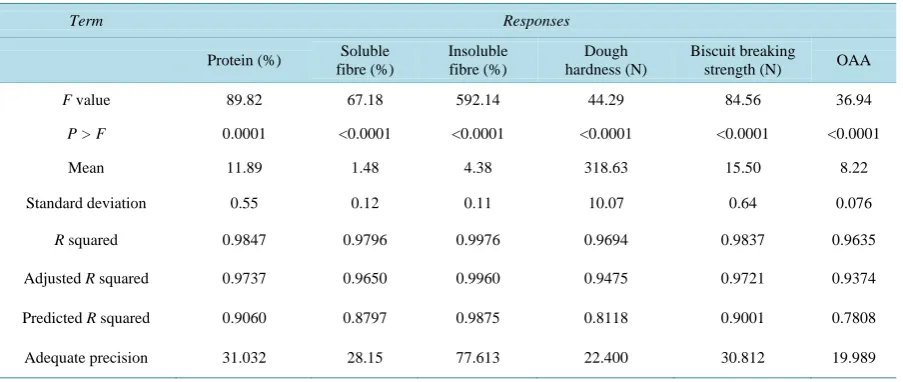
Regression coefficients, R2, adjusted R2 and probability (p) values for the protein and dietary fibre enriched bis-cuits were developed and presented in theTable 3. All the responses were fitted with quadratic models. The p values of all regression models were less than 0.0310 indicating the significance of all the models. The R2 values of the responses to protein, soluble fibre, insoluble fibre, dough hardness, biscuit breaking strength and OAA were found to be 0.9847, 0.9796, 0.9976, 0.9694, 0.9837 and 0.9635 respectively, which is higher than 80% in-dicating the fitness of polynomial models used for describing the effect of variables on the responses [35]. Ear-lier [14] reported, in optimization of baking parameters of chapathi with respect to vitamin B1 and B2 retention and quality, the polynomial models were fitted as the R2 value for the responses like hardness, cohesiveness, chewiness, vitamin B1 and B2 were above 80%.
The multiple regression equations (in terms of coded factors) were obtained for the responses are as follows;
( )
2 22 2
Protein % 12.09 0.38* 0.91* 0.14 * * 0.68* 0.35*
1.120 003* * 3.54 * *
Y A B A B A B
E A B A B
= + + − − − +
− − +
( )
2 2Soluble fibre % Y = +1.45 0.72 *+ A−0.20 *B−0.090 * *A B−0.095*A +0.15*B
( )
2 2 [image:7.595.90.542.530.721.2]Insoluble fibre % Y = +4.86 1.87 *+ A−0.59 *B−0.20 * *A B−0.53*A −0.26 *B
Table 3.Regression coefficient and model statistics for high protein and dietary fibre enriched biscuits.
Term Responses
Protein (%) Soluble fibre (%)
Insoluble fibre (%)
Dough hardness (N)
Biscuit breaking
strength (N) OAA
F value 89.82 67.18 592.14 44.29 84.56 36.94
P > F 0.0001 <0.0001 <0.0001 <0.0001 <0.0001 <0.0001
Mean 11.89 1.48 4.38 318.63 15.50 8.22
Standard deviation 0.55 0.12 0.11 10.07 0.64 0.076
R squared 0.9847 0.9796 0.9976 0.9694 0.9837 0.9635
Adjusted R squared 0.9737 0.9650 0.9960 0.9475 0.9721 0.9374
Predicted R squared 0.9060 0.8797 0.9875 0.8118 0.9001 0.7808
(
)
2 2 Overall acceptability OAA Y = +8.18 0.32 *− A+0.13*B−0.025* *A B+0.10 *A −0.046 *B( )
2 2Dough hardness N Y= +333.65 47.58*+ A+6.46 *B−20.29 * *A B−6.37 *A −18.05*B
( )
2 2Biscuit breaking strength N Y = +16.56+4.09 *A−0.36 *B−2.57 *A B* −0.64 *A −1.07 *B
3.4. Optimization of MGP Level and Model Validation
The ratio of MGP and wheat flour for biscuits was optimized using numerical multi-response optimization me-thod. Numerical optimization technique is one of the best methods to find out the best optimal ratio of the va-riables as it reduces the time and efforts required for the investigation of multifactor and multiple-response sys-tems. The optimized ratio of MGP and wheat flour was 40% and 60% respectively, with a desirability of 0.991. The predicted responses were experimentally validated using an optimized ratio of MGP and wheat flour (Table 4). A model can be considered as an adequate model, if the predicted values are close to the experimental values observed during the validation tests [36]. The results revealed that there is no significant (p ≤ 0.05) difference
between experimental and predicted response values and thereby reconfirming the adequacy of the models.
3.5. Proximate Composition of Control and Optimized Biscuit
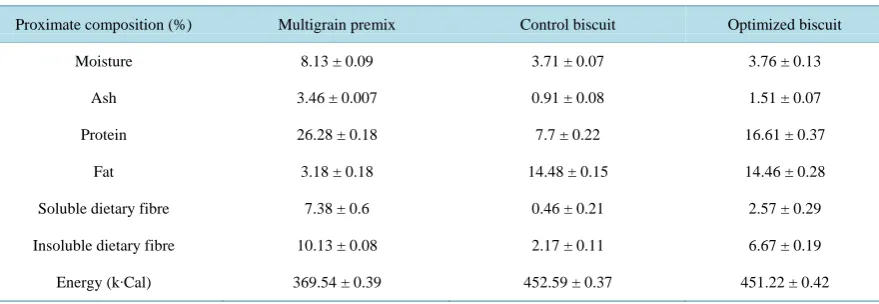
The composition of optimized and control biscuits were presented in Table 5. The addition of MGP did not af-fect significantly the fat content of biscuits, but a significant (p ≤ 0.05) difference in protein, soluble and inso-luble fiber content was observed. The protein content, soinso-luble fibre, insoinso-luble fibre contents were found to increase from 7.7%, 0.46% and 2.17% to 16.61%, 2.57% and 6.67% respectively. Earlier, [9] reported up to 15% addi-tion of multigrain mix in bread making resulted in a 1.5% increase in protein and 2.5% increase in dietary fiber.
4. Conclusion
[image:8.595.87.540.482.542.2]RSM was found to be efficient in optimizing the best optimal ratio of MGP and wheat flour to obtain protein and dietary fibre enriched biscuits. The present study shows that if wheat flour is substituted with 40% of MGP developed by using sorghum, barley, chickpea, pea and defatted soya flour each at 20% level, it is good enough to produce biscuits containing high protein (16.61%) and dietary fibre (9.24%) with a good overall acceptability similar to wheat flour based control biscuits.
Table 4. Predicted and experimental value for the responses at optimum conditions.
Protein (%) Soluble fibre (%) Insoluble fibre (%) Dough hardness (N)
Biscuit breaking
strength (N) OAA (9)
Predicted 16.79 2.51 6.73 370.65 21.86 7.82
Experimental 16.61 2.57 6.67 365.17 21.36 7.9
Table 5. Proximate compositions of MGP, control and optimized biscuits.
Proximate composition (%) Multigrain premix Control biscuit Optimized biscuit
Moisture 8.13 ± 0.09 3.71 ± 0.07 3.76 ± 0.13
Ash 3.46 ± 0.007 0.91 ± 0.08 1.51 ± 0.07
Protein 26.28 ± 0.18 7.7 ± 0.22 16.61 ± 0.37
Fat 3.18 ± 0.18 14.48 ± 0.15 14.46 ± 0.28
Soluble dietary fibre 7.38 ± 0.6 0.46 ± 0.21 2.57 ± 0.29
Insoluble dietary fibre 10.13 ± 0.08 2.17 ± 0.11 6.67 ± 0.19
[image:8.595.96.536.567.719.2]Acknowledgements
The authors are sincerely thankful to DRDO—Defence Food Research Laboratory for their help to carry out this research work.
References
[1] Chavan, J.K. and Kadam, S.S. (1993) Nutritional Enrichment of Bakery Products by Supplementation with Non-Wheat Flours. Critical Reviews in Food Science and Nutrition, 33, 189-226. http://dx.doi.org/10.1080/10408399309527620
[2] Banerjee, C., Singh, R., Jha, A. and Mitra, J. (2014) Effect of Inuline on Textural and Sensory Characteristics of Sorg-hum Based High Fibre Biscuits Using Response Surface Methodology. Journal of Food Science Technology, 51, 2762- 2768.
[3] Abu-Salem, F.M. and Abou-Arab, A.A. (2011) Effect of Supplementation of Bambara Groundnut (Vigna subterranean
L.) Flour on the Quality of Biscuits. African Journal of Food Science, 5, 376-383.
[4] Sudha, M.L., Vetrimani, R. and Leelavathi, K. (2007) Influence of Fibre from Different Cereals on the Rheological Characteristics of Wheat Flour Dough and on Biscuit Quality. Food Chemistry, 100, 1365-1370.
http://dx.doi.org/10.1016/j.foodchem.2005.12.013
[5] Jyotsna, R., Shwetha, L., Jyothilakshmi, A. and Venkateshwara, R.G. (2012) Influence of Green Gram Flour (
Phaseo-lus aureus) on the Rheology, Microstructure and Quality of Cookies. Journal of Texture Studies, 43, 350-360.
http://dx.doi.org/10.1111/j.1745-4603.2012.00346.x
[6] Ritika, B.Y., Baljeet, S.Y. and Nisha, D. (2012) Effect of Incorporation of Plantain and Chickpea Flours on the Quality Characteristics of Biscuits. Journal of Food Science and Technology, 49, 207-213.
http://dx.doi.org/10.1007/s13197-011-0271-x
[7] Stauffer, C.E. (1990) Emulsifiers and Dough Strengtheners in Functional Additives for Bakery Foods. Van Nostrand Reinhold, New York, 69-124.
[8] Izydorczyk, M.S. and Dexter, J.E. (2008) Barley b-Glucans and Arabinoxylans: Molecular Structure, Physicochemical Properties, and Uses in Food Products—A Review. Food Research International, 41, 850-868.
http://dx.doi.org/10.1016/j.foodres.2008.04.001
[9] Indrani, D., Soumya, C., Jyotsna, R. and Venkateshwara, R.G. (2010) Multigrain Bread—Its Dough Rheology, Micro-structure, Quality and Nutritional Characteristics. Journal of Texture Studies, 41, 302-319.
http://dx.doi.org/10.1111/j.1745-4603.2010.00230.x
[10] Nandeesh, K., Jyotsna, R. and Rao, G.V. (2011) Effect of Differently Treated Wheat Bran on Rheology, Microstruc-ture and Quality Characteristics of Soft Dough Biscuits. Journal of Food Processing and Preservation, 35, 179-200.
http://dx.doi.org/10.1111/j.1745-4549.2009.00470.x
[11] Okpala, L.C. and Okoli, E.C. (2011) Formulation and Evaluation of Cookies Containing Germinated Pigeon Pea, Fer-mented Sorghum and Cocoyam Flour Blends Using Mixture Response Surface Methodology. Advance Journal of
Food Science and Technology, 3, 366-375.
[12] Rai, P., Majumdar, G.C., Gupta, S.D. and De, S. (2004) Optimizing Pectinase Usage in Pretreatment of Mosambi Juice for Clarification by Response Surface Methodology. Journal of Food Engineering, 64, 397-403.
http://dx.doi.org/10.1016/j.jfoodeng.2003.11.008
[13] Sun, Y., Wang, Z.F., Wu, J.H., Chen, F., Liao, X.J. and Hu, X.S. (2006) Optimizing Enzymatic Maceration in Pretreat- ment of Carrot Juice Concentrates by Response Surface Methodology. International Journal of Food Science and
Technology, 41, 1082-1089.http://dx.doi.org/10.1111/j.1365-2621.2006.01182.x
[14] Yadav, D.N., Sharma, G.K. and Bawa, A.S. (2007) Optimization of Soy Fortified Instant Sooji Halwa Mix Using Res- ponse Surface Methodology. Journal of Food Science and Technology, 44, 297-300.
[15] Nazni, P. and Gracia, J. (2014) Optimization of Fibre Rich Barnyard Millet Bran Cookies Using Response Surface Me- thodology. International Journal of Agriculture and Food Science, 4, 100-105.
[16] Reddy, J.K., Pandey, M.C., Harilal, P.T. and Radhakrishna, K. (2013) Optimization and Quality Evaluation of Freeze Dried Mutton Manchurian. International Food Research Journal, 20, 3101-3106.
[17] Kathiravan, T., Nadanasabapathi, S. and Kumar, R. (2013) Optimization of Pulsed Electric Field Processing Condi-tions for Passion Fruit Juice (Passiflora edulis) Using Response Surface Methodology. International Journal of Advan
-ced Research, 1, 399-411.
[18] AACC International (2000) Approved Methods of the Association of Cereal Chemists International. 10th Edition, AA- CC International, Saint Paul.
Dietary Fibre. Journal of Agriculture and Food Chemistry, 31 476- 482.http://dx.doi.org/10.1021/jf00117a003
[20] Myers, R.H. and Montegomery, D.C. (2002) A Text Book of “Response Surface Methodology: Process and Product Optimization Using Design Experiments”. 2nd Edition, John Wiley & Sons Inc., Hoboken, 321-342.
[21] Montgomery, D.C. (2001) Design and Analysis of Experiments. John Wiley and Sons, New York.
[22] Sin, H.N., Yusof, S., Hamid, N.S.A. and Rahman, R.A. (2006) Optimization of Hot Water Extraction for Sapodilla Juice Using Response Surface Methodology. Journal of Food Engineering, 74, 352-358.
http://dx.doi.org/10.1016/j.jfoodeng.2005.03.005
[23] Bourne, M.C. (1978) Texture Profile Analysis. Food Technology, 32, 62-66.
[24] Gains, C.S. (1991) Instrumental Measurement of the Hardness of Cookies and Crackers. Cereal Foods World, 36, 989, 991-994, 996.
[25] Larmond, E. (1997) Laboratory Methods for Sensory Evaluation of Foods. Canada Department of Agriculture Publica-tion, Ottawa.
[26] Dachana, K.B., Jyotsna, R., Indrani, D. and Prakash, J. (2010) Effect of Dreid Moringa (Moringa oleiferal Lam.) Lea- ves on Rheological, Microstructural, Nutritional, Textural and Organoleptic Characteristics of Cookies. Journal of
Food Quality, 33, 660-677.http://dx.doi.org/10.1111/j.1745-4557.2010.00346.x
[27] Aleem, Z.M.D., Genitha, T.R. and Syed, I.S. (2012) Effects of Defatted Soy Flour Incorporation on Physical, Sensorial and Nutritional Properties of Biscuits. Journal of Food Process and Technology, 3, 4.
[28] Awika, M.J. and Rooney, L.W. (2004) Sorghum Phytochemicals and Their Potential Impact on Human Health.
Phyto-chemistry, 65, 1199-1221.http://dx.doi.org/10.1016/j.phytochem.2004.04.001
[29] Poongodi, V.T., Raghunath, T. and Jaganmohan, R. (2012) Preparation of Cereal Mix for Nutri-Composite Bar Devel-opment Using Response Surface Methodology. Elixir Food Science, 53, 11946-11950.
[30] Banerjee, C., Singh, R., Jha, A. and Mitra, J. (2014) Effect of Inuline on Textural and Sensory Characteristics of Sorg-hum Based High Fibre Biscuits Using Response Surface Methodology. Journal of Food Science Technology, 51, 2762- 2768.
[31] Rosell, C.M., Rojas, J.A. and Benedito, B. (2001) Influence of Hydrocolloids on Dough Rheology and Bread Quality.
Food Hydrocolloids, 15, 75-81.http://dx.doi.org/10.1016/S0268-005X(00)00054-0
[32] Devi, K. and Haripriya, S. (2012) Pasting Behavior of Starch and Protein in Soy Flour Enriched Composite Flours on Quality of Biscuits. Journal of Food Processing and Preservation, 38, 116-124.
http://dx.doi.org/10.1111/j.1745-4549.2012.00752.x
[33] Nirmala, M., Jyotsna, R., Jeyarani, T. and Rao, G.V. (2011) Influence of Debittered, Defatted Fenugreek Seed Powder and Flax Seed Powder on the Rheological Characteristics of Dough and Quality of Cookies. International Journal of
Food Science and Nutrition, 62, 336-344.http://dx.doi.org/10.3109/09637486.2010.536145
[34] Sharma, H.R. and Chauhan, G.S. (2002) Effects of Stabilized Rice Bran—Fenugreek Blend on the Quality of Breads and Cookies. Journal of Food Technology, 39, 225-233.
[35] Joglekar, A.M. and May, A.T. (1987) Product Excellence through Design of Experiments. Cereal Foods World, 32, 857-868.