PREPROCESSING AND GENERATION OF ASSOCIATION
RULES FOR PREDICTION OF ACUTE MYELOID LEUKEMIA
FROM BONE MARROW DATA
1
D.MINNIE, 2S.SRINIVASAN 1
Madras Christian College, Department of Computer Science, Chennai, India 2
Anna University: Chennai Regional Office Madurai, Department of Computer Science and Engineering,
Madurai, India
E-Mail: [email protected], [email protected]
ABSTRACT
In this paper we analyze the components of the bone marrow and the structure of the bone marrow database. The Knowledge Discovery in Databases (KDD) steps are briefly explained. 18,000 bone marrow analysis records are collected from a reputed Hospital and this raw data is transformed into a preprocessed data using the pre-processing phases of KDD such as Data Cleaning, Data Selection and Data Transformation. Eliminate the tuple technique is used to clean the data. The attributes related to the bone marrow components are selected. The ranges of low, high and normal values for the individual attributes are used to transform the data. The Data Mining techniques are studied and the Apriori algorithm is selected for finding frequent item sets that are used for the generation of association rules.
Keywords: Knowledge Discovery in Databases, Data Mining, Association Rule Mining, Haematology, Bone Marrow Analysis.
1. INTRODUCTION
Huge volumes of automated medical data are currently available in various forms. This data are used along with various analysis techniques to generate results that can be used by the health care professionals in efficient decision making that can improve the quality of service in the medical fields.
Bone Marrow is the flexible tissue found in the interior of bones. It produces the cellular elements of the blood such as red blood cells, white blood cells and platelets. The bone marrow is used to diagnose diseases such as leukemia, anemia, neimen pick disease and so on.
Leukemia is a type of blood cancer that begins in the bone marrow. Leukemia leads to an uncontrolled increase in the number of white blood cells (leukocytes) that are used by the body to fight infections and other foreign substances. The cancerous cells prevent healthy red cells, platelets, and mature white cells (leukocytes) from being made. Life-threatening symptoms can then develop as normal blood cells decline. The cancer cells can spread to the bloodstream and lymph nodes. The main types of leukemia are:
• Acute lymphocytic leukemia (ALL)
• Acute myeloid leukemia (AML) • Chronic lymphocytic leukemia (CLL) • Chronic myeloid leukemia (CML)
AML is an acute form of leukemia that spreads very fast. An early detection can increase the survival rate of an infected person. A bone marrow aspiration and biopsy shows the presence of any leukemia cells. The bone marrow data can be used to predict the presence of leukemia [1].
Knowledge Discovery in Databases (KDD) is used to extract useful knowledge such as prediction from data. The data is to be preprocessed using the KDD preprocessing steps Data Cleaning, Data Transformation and the resultant preprocessed data is used to generate knowledge using the Data Mining techniques such as classification, clustering, association rule mining and prediction [2-5].
data in a database [6-8]. Prediction generates models that are used to predict the outcome for a given input.
The data mining algorithms are used to generate knowledge from medical data. Clustering algorithms are used to mine temporal data to diagnose diabetes [9]. Association Rule Mining is used to diagnose hyperlipidemia disease [10], heart disease [11,12] and in the application of counseling and analyzing the help seeking behavior of adolescents [13]. Association rules are generated among the attributes of the Automated Blood Cell Counter Data [14].
A class discovery procedure using Leukemia classification automatically distinguishes between acute myeloid leukemia (AML) and acute lymphoblastic leukemia (ALL) with previous knowledge of these classes [15]. The association rule mining and classification techniques were used to predict the diseases and the association rule mining technique was found to be better than the classification algorithm [16].
[image:2.595.89.292.460.718.2]This bone marrow data consist of numerical and categorical attributes. The numerical data are discretized and association rules are generated. The association rules are proposed to be used to predict the disease AML.
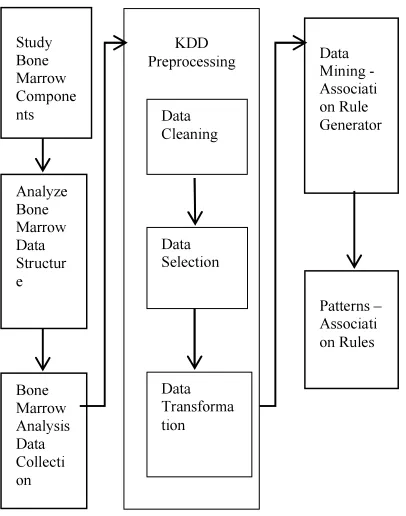
Figure 1 System Architecture
2. METHODS
2.1 System Architecture
The system architecture of this work is shown in figure 1 and it consists of studying the bone marrow components, analyse bone marrow data structure, bone marrow analysis data collection, KDD preprocessing steps data cleaning, data selection and data transformation and data mining using association rule generation.
2.2 Bone Marrow Components
The bone marrow contains various cells such as erythrocytes (red blood cells), blasts, promyelocyte, myeloblasts, plasma cells, white blood cells such as neutrophils, eosinophils, basophils and monocytes.
2.3 Data Collection
Eighteen thousand bone marrow data are collected from a Clinical Pathology department of a reputed hospital. The data is present as an excel file. The bone marrow analysis data is de-identified to preserve the privacy of the patient, doctor and the hospital. A sample of the data file is shown in figure 2.
2.4 Bone Marrow Data Format
The Bone Marrow Analysis data consists of values for each attributes such as erythrocytes, blasts, promyelocyte, myeloblasts, neutrophils, eosinophils, plasma cells, basophils and monocytes, the patient id, date in which the test is taken, hospital id, detailed description of the results and the final impression. The list of attributes along with a detailed description of the attributes is shown in table 1.
Table 1 Attributes of the Bone Marrow Data
Attribute Name Description bmid Patient Id date Test Date hsno Hospital Number eryth Erythrocyte count blasts Blast cell count promy Promyelocyte count myel Myeloblast count plasma Plasma cell count neutr Neutrophil count eosin Eosinophil count lymph Lymphocyte count baso Basophil count mono Monocyte txt Test results edit_name Doctor’s name fin_name Doctor’s name imp Impression
2.5 Knowledge Discovery In Databases (KDD)
[image:2.595.89.495.463.724.2]The data is subjected to the KDD processes to generate knowledge from it. The processes include Data Cleaning, Data Integration, Data Selection, Data Transformation, Data Mining, Generation of Patterns and Knowledge Interpretation.
In Data Cleaning the irrelevant data are removed from the collected data. In Data Integration data from multiple sources are combined into a data warehouse. The Data Selection process is involved with the selection of data relevant to the analysis and extracting them from the integrated data. The selected data is transformed to the appropriate form for the mining procedure.
The process of extracting useful and implicit information from the transformed data is referred to as Data Mining. In Pattern Evaluation interesting patterns are identified from the processed data. The discovered knowledge is visually presented to the user in the Knowledge Representation process.
2.6 Association Rule Mining (ARM)
ARM is used to find frequent patterns, associations and correlations among sets of items in databases and any other information repositories. Association Rule correlates the presence of one set of items with that of another set of items in the same transaction. The quality of an Association Rule is measured using its support and confidence values and several efficient methods are developed to generate association rules.
Let N be the number of records in a database, N(I) be the number of records with item set I, X be an item set with k elements X1, X2, …, Xk and Y be an item set with h elements Y1, Y2, …, Yh. An Association Rule X⇒Y can be generated if the support of X and that of Y is above the minimum support value and also the confidence of the rule X⇒Y is above the minimum confidence
specified.
Support S, of X is a probability that a transaction contains X and is given in (1) and (2).
S(X) = P(X) (1)
S(X) = N(X) / N (2)
Support of X⇒Y is a probability that a
transaction contains both X and Y as given in (3) and (4).
S(X⇒Y) = P(X ∪ Y) (3) S(X⇒Y) = N(X ∪ Y) / N (4)
Confidence C, of X⇒Y is a conditional
probability that a transaction that contains X contains Y also. Confidence can be calculated as in equations (5), (6) and (7).
C(X ⇒ Y) = P(X ∣ Y) (5)
C(X ⇒ Y) = N(X ∪ Y) / N(X) (6)
C(X ⇒ Y) = S(X ∪ Y) / S(X) (7)
Association Rule Mining consists of the two steps finding frequent item sets and generating association rules. The set of all item sets are called as candidate item sets. The item sets which occur frequently in a database are called frequent item sets. The frequent item sets satisfy the minimum support, min_sup specified by the user or designer. If the min_sup is 10%, then the item sets whose support % are greater than or equal to 10 are considered as frequent item sets.
The association rules are generated using the frequent item sets and they should satisfy the minimum confidence min_conf of 50%. Apriori algorithm is used to find frequent item sets in a database and to generate Association Rules from the frequent item sets. Apriori algorithm uses the apriori principle “All subsets of an infrequent item set are infrequent” and hence those subsets need not be considered for further processing.
2.7 Application Interface
The interface for this application to generate association rules between the attributes of the bone marrow analysis data are given in figure 3.
3. RESULTS AND DISCUSSION
3.1 Data Cleaning
The process of detecting and correcting or removing corrupt or inaccurate records from a record set, table, or database is Data Cleaning. The missing values or invalid values in the Bone Marrow data cannot be replaced by any other value and hence those records were eliminated from further process. 18,429 records out of 18,449 records were selected for further process as they have valid values.
3.2 Data Selection
rules and hence they are selected for further process.
3.3 Training And Testing Data
The cleaned and transformed data is divided into two data sets Training Data and Testing Data. The training data consist of 9212 records and testing data consist of 9217 records. The training data is used to generate association rules and the testing data is used to measure the quality of the association rules generated
3.4 Data Transformation
In the Data Transformation stage the data are transformed or consolidated in to forms appropriate for mining.
The ranges of values for the bone marrow component attributes are used to find out whether the value is low, normal or high. New attributes low, normal and high are generated for each of the attributes. Hence the individual attribute values are used to generate the status of the attributes as low, normal or high. A value 0 is stored for the normal values, 1 is stored for the high values and -1 is stored for the low values for the newly generated attributes depending on the values of the corresponding attributes.
The disease AML data is collected from the impression attribute and a new attribute is inserted for AML that can hold Boolean values 0 for the absence of the disease AML and 1 for the presence of the disease AML for that record. The flattened data is shown in figure 4 and figure 5. Also the excel data was converted into a SQL Data base.
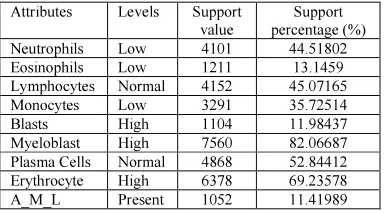
3.5 Attribute Combinations
The attributes have a normal, low and high support associated with them. Various combinations of these are considered for generating the association rules. The combination selected to produce association rules is shown in table 2.
3.6 Frequent Item Sets
[image:4.595.302.505.105.268.2]The minimum support value is set as 0.1% to include all the item sets including outliers for the association rule generation process. The number of frequent 1 item sets, 2 item sets, 3 item sets and 4 item sets generated are given in Table 3.
[image:4.595.305.500.308.485.2]Figure 4 Flattened Bone Marrow Numerical Data base – Sample Screenshot
[image:4.595.308.500.549.656.2]Figure 5 Flattened Bone Marrow Categorical Disease Data base – Sample Screenshot
Table 2 Combinations of Levels selected for attributes
Attributes Levels Support value
Support percentage (%) Neutrophils Low 4101 44.51802 Eosinophils Low 1211 13.1459 Lymphocytes Normal 4152 45.07165 Monocytes Low 3291 35.72514 Blasts High 1104 11.98437 Myeloblast High 7560 82.06687 Plasma Cells Normal 4868 52.84412 Erythrocyte High 6378 69.23578 A_M_L Present 1052 11.41989
Table 3 Frequent Item Set Generation Count
3.7 Association Rules Generated Without Disease Detail
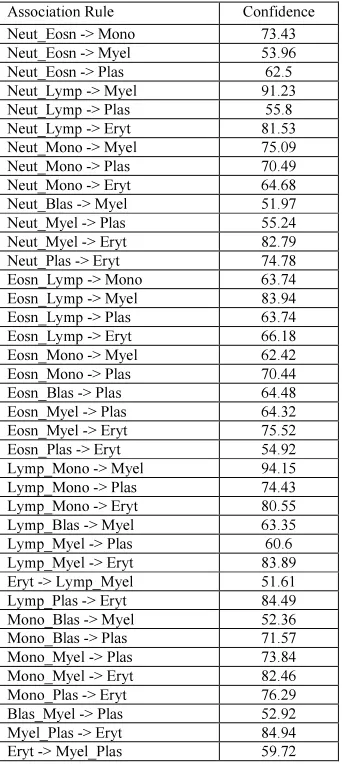
The minimum confidence is set as 50% to select strong association rules that are formed using the numerical attributes of the bone marrow data and the categorical disease data is not considered.
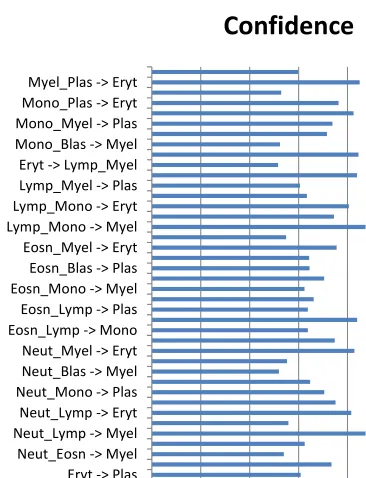
[image:5.595.328.515.172.559.2]The associations generated with 2 attributes are given in Table 4, with 3 attributes are given in Table 5 and are shown graphically in figure 6. The 4 attribute associations and the 5 attribute association rules have the confidence level lesser than the minimum confidence of the confidence level lesser than the minimum confidence of 50% and hence they are not discussed.
Table 4 Association rules with 2 Attributes and without Disease Details
Table 5 Association rules with 3 attributes and without disease details
3.8 Association Rules Generated With Disease AML
The minimum confidence is set as 50% to select strong association rules. The association rules are generated with the disease AML and other attributes of the bone marrow analysis data.
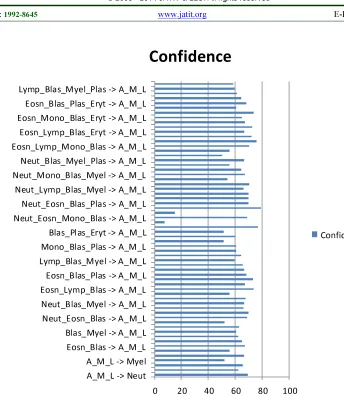
The associations generated with AML and 1 attribute is given in Table 6, 2 attributes are given in Table 7, with 3 attributes are given in Table 8. The 4 attribute ones are shown in Table 9 and all associations are shown in figure 7
Association Rule Confidence Neut_Eosn -> Mono 73.43 Neut_Eosn -> Myel 53.96 Neut_Eosn -> Plas 62.5 Neut_Lymp -> Myel 91.23 Neut_Lymp -> Plas 55.8 Neut_Lymp -> Eryt 81.53 Neut_Mono -> Myel 75.09 Neut_Mono -> Plas 70.49 Neut_Mono -> Eryt 64.68 Neut_Blas -> Myel 51.97 Neut_Myel -> Plas 55.24 Neut_Myel -> Eryt 82.79 Neut_Plas -> Eryt 74.78 Eosn_Lymp -> Mono 63.74 Eosn_Lymp -> Myel 83.94 Eosn_Lymp -> Plas 63.74 Eosn_Lymp -> Eryt 66.18 Eosn_Mono -> Myel 62.42 Eosn_Mono -> Plas 70.44 Eosn_Blas -> Plas 64.48 Eosn_Myel -> Plas 64.32 Eosn_Myel -> Eryt 75.52 Eosn_Plas -> Eryt 54.92 Lymp_Mono -> Myel 94.15 Lymp_Mono -> Plas 74.43 Lymp_Mono -> Eryt 80.55 Lymp_Blas -> Myel 63.35 Lymp_Myel -> Plas 60.6 Lymp_Myel -> Eryt 83.89 Eryt -> Lymp_Myel 51.61 Lymp_Plas -> Eryt 84.49 Mono_Blas -> Myel 52.36 Mono_Blas -> Plas 71.57 Mono_Myel -> Plas 73.84 Mono_Myel -> Eryt 82.46 Mono_Plas -> Eryt 76.29 Blas_Myel -> Plas 52.92 Myel_Plas -> Eryt 84.94 Eryt -> Myel_Plas 59.72
[image:5.595.84.255.352.734.2]Table 6 Association rules with AML and 1 Attribute
[image:6.595.100.280.223.316.2]Rule Confidence A_M_L -> Neut 69.29 Blas -> A_M_L 62.4 A_M_L -> Blas 65.49 A_M_L -> Myel 52.09
Table 7 Association rules with AML and 2 Attributes
Association Rules confidence Neut_Blas -> A_M_L 66.44 A_M_L -> Neut_Blas 55.89 Eosn_Blas -> A_M_L 66.97 Lymp_Blas -> A_M_L 64.88 Mono_Blas -> A_M_L 62.59 Blas_Myel -> A_M_L 60.48 Blas_Plas -> A_M_L 63.08 Blas_Eryt -> A_M_L 52.23
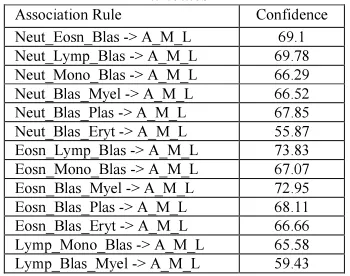
Table 8 Association rules Generated with AML and 3 Attributes
Association Rule Confidence Neut_Eosn_Blas -> A_M_L 69.1 Neut_Lymp_Blas -> A_M_L 69.78 Neut_Mono_Blas -> A_M_L 66.29 Neut_Blas_Myel -> A_M_L 66.52 Neut_Blas_Plas -> A_M_L 67.85 Neut_Blas_Eryt -> A_M_L 55.87 Eosn_Lymp_Blas -> A_M_L 73.83 Eosn_Mono_Blas -> A_M_L 67.07 Eosn_Blas_Myel -> A_M_L 72.95 Eosn_Blas_Plas -> A_M_L 68.11 Eosn_Blas_Eryt -> A_M_L 66.66 Lymp_Mono_Blas -> A_M_L 65.58 Lymp_Blas_Myel -> A_M_L 59.43
Lymp_Blas_Plas -> A_M_L 64.61 Mono_Blas_Myel -> A_M_L 60.47 Mono_Blas_Plas -> A_M_L 60.97 Mono_Blas_Eryt -> A_M_L 51.64 Blas_Myel_Plas -> A_M_L 60.06 Blas_Plas_Eryt -> A_M_L 51.35
4. CONCLUSION AND FUTURE WORK
The KDD steps for preprocessing were applied on the Bone Marrow Analysis Data and two sets of association rules were generated one without the disease details and another with the disease details. The association rules generated with the disease details were used to predict the disease AML. Eight bone marrow cell attributes in different ranges were considered for the generation of the association rules.
The combination that gives a good association rule is presented in this paper. The project can be extended to include all possible combinations of the cell attributes and a comparative study can be done.
The associations between various bone marrow cell structures are presented in this paper. They can be used for missing value imputation of attribute values.
The association rules can also be generated for the records with other diseases such as malaria, MMM and ALL.
Table 9 Association rules with AML and 4 attributes
Association Rule Confidence Neut_Eosn_Lymp_Blas -> A_M_L 77 A_M_L -> Neut_Eosn_Lymp_Blas 7.319 Neut_Eosn_Mono_Blas -> A_M_L 68.66 A_M_L -> Neut_Eosn_Mono_Blas 15.2 Neut_Eosn_Blas_Myel -> A_M_L 79.04 Neut_Eosn_Blas_Plas -> A_M_L 70.1 Neut_Eosn_Blas_Eryt -> A_M_L 69.81 Neut_Lymp_Mono_Blas -> A_M_L 69.85 Neut_Lymp_Blas_Myel -> A_M_L 66.01 Neut_Lymp_Blas_Plas -> A_M_L 70.3 Neut_Lymp_Blas_Eryt -> A_M_L 54.38 Neut_Mono_Blas_Myel -> A_M_L 67.45 Neut_Mono_Blas_Plas -> A_M_L 64.34 Neut_Mono_Blas_Eryt -> A_M_L 56.09 Neut_Blas_Myel_Plas -> A_M_L 66.66 Neut_Blas_Myel_Eryt -> A_M_L 50.23 Neut_Blas_Plas_Eryt -> A_M_L 55.9 Eosn_Lymp_Mono_Blas -> A_M_L 70.23 Eosn_Lymp_Blas_Myel -> A_M_L 75.86 Eosn_Lymp_Blas_Plas -> A_M_L 72.22 Eosn_Lymp_Blas_Eryt -> A_M_L 66.66 Eosn_Mono_Blas_Myel -> A_M_L 72.41 Eosn_Mono_Blas_Plas -> A_M_L 67.03 Eosn_Mono_Blas_Eryt -> A_M_L 65
Eosn_Blas_Myel_Plas -> A_M_L 73.49 Eosn_Blas_Myel_Eryt -> A_M_L 60.86 Eosn_Blas_Plas_Eryt -> A_M_L 68.42 Lymp_Mono_Blas_Myel -> A_M_L 64.64 Lymp_Mono_Blas_Plas -> A_M_L 61.26 Lymp_Blas_Myel_Plas -> A_M_L 59.55 Mono_Blas_Myel_Plas -> A_M_L 58.55
ACKNOWLEDGEMENT
[image:6.595.102.277.342.480.2] [image:6.595.309.502.483.553.2]REFERENCES
[1] A.D.A.M. Medical Encyclopedia:
http://www.ncbi.nlm.nih.gov/pubmedhealth/PM H0002276/
[2] Han J., Kamber M., Data Mining : Concepts and Techniques, 2nd Edition, Morgan Kaufmann Publishers, 2006
[3] Dunham M., Data Mining: Introductory and advanced topics”, Pearson Education, 2007. [4] Fayyad UM, Piatetsky-Shapiro G, Smyth P:
From Data Mining to Knowledge Discovery: An Overview. In Advances in Knowledge Discovery and Data Mining. Edited by Fayyad UM, Piatetsky-Shapiro G, Smyth P, Uthurusamy R. Menlo Park, California, USA , AAAI Press; 1996:1 -34.
[5] Frawley W, Piatetsky-Shapiro G, Matheus C: Knowledge Discovery in Databases: An Overview. AI Magazine 1992, 14(3):57 -570. [6] Agrawal R., Imielinski T., Swami A., “Mining
associations between sets of items in large databases”, Proc. of the ACM-SIGMOD 1993 Int'l Conference on Management of Data,
Washington D.C., pp. 207 – 216, 1993.
[7] Srikant R. and Agrawal R., “Mining generalized association rules”, Proceedings of the 21st International Conference on Very Large Data Bases, Zurich, Swizerland, September 1995 [8] Hipp J, Guntzer U, Nakhaeizadeh G:
Algorithms for Association Rule Mining - A General Survey and Comparison. SIGKDD Explorations 2000, 2(1):58 -564.
[9] Toussi M., et al, “Using data mining techniques to explore physicians' therapeutic decisions when clinical guidelines do not provide recommendations: methods and example for type 2 diabetes”, BMC Medical Informatics and Decision Making 2009; pp. 9-28, 2009.
[10] Dogan S. and Turkoglu I., “Diagnosing Hyperlipidemia using association rules”,
Mathematical and Computational Applications, Association for Scientific Research, vol.13, no. 3, pp. 193-202, 2008
[11] Ordonez C, Omiecinski E, Braal LD, Santana CA, Ezquerra N, TaAboada JA, Cooke D, Krawczynksa E, Garcia EV: Mining Constrained Association Rules to Predict Heart Disease. In Proceedings of the IEEE International Conference on Data Mining. San Jose, California ; 2001:433 -440.
[12]MA.Jabbar, Dr. Priti Chandra, B.L.Deekshatulu, Cluster Based Association Rule Mining for Heart Attack Prediction, Journal of Theoretical and Applied Information Technology, 31st October 2011. Vol. 32 No.2, pp.196 – 201.
[13]Goh D and Ang R. “An introduction to association rule mining: an application in counseling and help-seeking behavior of adolescents”. Behaviour Research Methods, vol. 39, no. 2, pp. 259-266, 2007.
[14]Minnie D, Srinivasan S, “Preprocessing and generation of association rules for automated blood cell counter data in haematology”,
Proceedings of RACSS 2012, April 2012, pp 27 – 32.
[15]El-Nasser, Ahmed Abd, Mohamed Shaheen, and Hesham El-Deeb, "Enhanced leukemia cancer classifier algorithm", Science and Information Conference (SAI), August 27-29,2014. IEEE, 2014, pp. 422-429
[16]Ordonez, Carlos. "Comparing association rules and decision trees for disease prediction,"
Figure 2 Sample Bone Marrow Analysis Data
[image:8.595.91.508.394.735.2]Eryt -> Plas
Neut_Eosn -> Myel
Neut_Lymp -> Myel
Neut_Lymp -> Eryt
Neut_Mono -> Plas
Neut_Blas -> Myel
Neut_Myel -> Eryt
Eosn_Lymp -> Mono
Eosn_Lymp -> Plas
Eosn_Mono -> Myel
Eosn_Blas -> Plas
Eosn_Myel -> Eryt
Lymp_Mono -> Myel
Lymp_Mono -> Eryt
Lymp_Myel -> Plas
Eryt -> Lymp_Myel
Mono_Blas -> Myel
Mono_Myel -> Plas
Mono_Plas -> Eryt
Myel_Plas -> Eryt
[image:9.595.119.485.135.613.2]Confidence
0 20 40 60 80 100 A_M_L -> Neut
A_M_L -> Myel Eosn_Blas -> A_M_L Blas_Myel -> A_M_L Neut_Eosn_Blas -> A_M_L Neut_Blas_Myel -> A_M_L Eosn_Lymp_Blas -> A_M_L Eosn_Blas_Plas -> A_M_L Lymp_Blas_Myel -> A_M_L Mono_Blas_Plas -> A_M_L Blas_Pl as_Eryt -> A_M_L Neut_Eosn_Mono_Blas -> A_M_L Neut_Eosn_Blas_Plas -> A_M_L Neut_Lymp_Blas_Myel -> A_M_L Neut_Mono_Blas_Myel -> A_M_L Neut_Blas_Myel_Plas -> A_M_L Eosn_Lymp_Mono_Blas -> A_M_L Eosn_Lymp_Blas_Eryt -> A_M_L Eosn_Mono_Blas_Eryt -> A_M_L Eosn_Blas_Plas_Eryt -> A_M_L Lymp_Blas_Myel_Plas -> A_M_L
Confidence
Confidence
[image:10.595.108.452.103.505.2]