BUS DEPARTURE INTERVAL OPTIMIZATION
CONSIDERING CROWING COST
YONGSHENG QIAN 1, JINBAO LUO 2, JUNWEI ZENG 3
1School of Traffic and Transportation, Lanzhou Jiaotong University, Lanzhou 730070, Gansu, China
2
School of Traffic and Transportation, Lanzhou Jiaotong University, Lanzhou 730070, Gansu, China
3
School of Traffic and Transportation, Lanzhou Jiaotong University, Lanzhou 730070, Gansu, China
ABSTRACT
The paper mainly studies the optimizing mathematical model of bus departure interval and its solution, and then work out the best bus departure interval. This paper establishes the optimizing mathematical model of bus departure interval, which takes crowding cost of passengers into account, including passengers’ on-the-bus time cost, passengers’ crowding cost and on-the-bus company cost. The paper uses the genetic algorithm to solve the problem. Reasonable bus departure interval will obtained quickly by this method. It can provide theoretical basis and technical support for bus enterprise scientific operation decision and ensure the development of urban public transportation efficiently.
Keywords:Public Transportation, Dynamic Dispatching, Departure Interval, Crowding Cost
1. INTRODUCTION
As public transportation is very important to urban life, the present unban public transportation can be promoted by improving the management of public transportation. Therefore, the scheduling optimization problem of bus becomes a very popular topic. Vehicle dispatching is a process to find the result for the function of aim under some restriction condition and to make sure the best sequence of behave based on finites resource. So an optimal schedule is characterized by minimal fleet size and waiting time for achieving maximal service.
The paper mainly studies the optimizing mathematical model of bus departure interval and its solution, and then work out the best bus departure interval. It can provide theoretical basis and technical support for bus enterprise scientific operation decision and ensure the development of urban public transportation efficiently.
2. LITERATURE REVIEW
Researchers have done a lot of related researches on the bus departure interval optimization, and they have attained some good outcomes.
At the starting stage, Furth and Wilson (1981) put forward the mathematical programming method of departure frequency and the departure schedule. The Wilson and Furth established the optimization
model of the objective function is to maximize the social interest, including cost of passenger and economized waiting time. Constraint condition is general subsidies, the number of buses and buses’ load factors [1]. Then relevant researches are done by Cender and Tal(1981), Ceder and Stern(1984), and Koutsopoulos et al.(1985). Koutsopoulos (1985) extended the objective function of the model by adding the crowded uncomfortable function and considering fluctuation of bus demand[2]. Ceder and
Stem (1984) took advantage of integer
programming and heuristic man-machine interactive process to solve this problem, transforming the problem into determining the departure schedule under constraint conditions of given number of buses[3]; In 1998 the United States Transportation Research Board published TCRP30 “Transit Seheduling: Basic and Advanced Manuals”, which described the main steps for bus scheduling problem, including a detailed instruction of the determination of the bus departure interval.
studied this problem from the perspective of road network, passenger transfer etc[10-13].
In summary, few papers transform passengers’ crowded feeling on the bus into cost,the paper is innovative.
3. THE INFLUENTIALS FACTORS OF BUS
DEPARTURE INTERVAL
Many factors influence the bus departure interval. The paper mainly chooses some important factors to establish the model, such as passengers’ demand, speed of bus, and cost of bus enterprise for a bus.
4. THE MODEL AND ALGORITHM
4.1 The Model
4.1.1 hypothesises of the model
Mathematic model simplify real world’s objective and make hypothesis in order to solve the problem, which is abstract real problem to a mathematical problem. A mathematical model is an abstraction of real problem. It facilitates understanding, communication and a predictive capability. In order to solve the bus dispatching problem, we make such hypothesis as follows: (1)In same bus line, all bus vehicles is the same type
;
(2)Operational time of bus vehicle is constant, that is to say, vehicle follows the principle that first depart, first arrive;
(3)All the bus on the line can always pass normally and can arrive on time;
(4)The same type buses are allocated by the
company;
(5)The passengers arrive as the uniform distribution independently in each time period with the same number in the same time period in different days.
4.1.2 The model notation and parameters
i--bus routes; k--station;
m--buses’ mark (m=1, 2,…) ;
k
r --Passengers random arriving rate for station k (person/min);
1 , k i m
p − -- The number of passengers of the m-th bus when depart from station k-1;
, k i m
p -- The number of passengers of the m-th bus when depart from station k;
H—The length of bus service time; h-- The bus departure interval;
1, k k
D− --The distance between station k-1 to
station k;
V-- The average speed of bus on route i;
k
q --The getting off rate of passengers in station k;
max i
s --The maximal departure interval on route i;
min i
s -- The minimal departure interval on route i;
1
c --The conversion coefficient of converting passengers’ waiting time into passengers’ cost;
2
c --The conversion coefficient of converting passengers’ crowding time into passengers’ cost;
3
c --The cost of bus enterprise for a bus running a trip in route i.
4.1.3 Objective function
The objective function is consisted of three portions: passengers’waiting cost, passengers’ crowding cost on the bus and the cost of bus enterprise.
(1) Passengers’ waiting cost
The number of passengers who wait in the station k is w :
k
w=r h (1) The average time of a passenger in station k is
w
T :
Tw=0.5h (2)
The waiting time of passengers in station k is
T:
2 0.5
w k
T =wT = r h (3) The cost of passengers in station k is as follows:
2 1 1
2 k
c
y = r h (4)
(2) Passengers’ crowding cost on the bus
The passengers’ crowding cost on the bus is produced by passengers’crowding feeling, so its cost equals with product of crowded time, the number of passengers on the bus and the cost of per unit crowding time.
The length of time travels frome station k-1 to
station k isDk1,k
V
− ,and the number of passengers
is ,1 k i m
p − . So the crowding time Tcis as follows:
1 1,
,
( k k ) k
c i m
D
T p
V
− −
= (5)
The crowding cost of passengers on the bus from station k-1 to station k is as follows:
1, 1
2 2( ) ,
k k k
i m
D
y c p V
− −
= (6)
(3)The cost of bus enterprise
The number of bus departed is H/h, so the cost of bus enterprise is as follows:
So the objective function of bus departure interval is as follows:
1 1, 2 , 2 1 3 ( )
2 ( )
k k k
i m
k
i k m i k m
D
c p
c V
Min r h
H c h − − + +
∑∑∑
∑∑∑
(8)Where . , 1(1 )
k k
i m i m k k
p = p− −q +r h, (9)
And Pi m1, =r h1 (10)
Constraint conditions:
The constraint condition is maximum and minimum bus departure interval. All departure interval between arbitrary two adjacent bus should meet the maximum and minimum departure interval constraint . As follows
min max
, ,
k k
i i m i m i
s ≤d −a ≤s ∀i k, (11) The model is a multivariate nonlinear problem, consisting of departure interval h. If we use the general exhaustive method to calculate, the time to calculate is very expensive. Therefore, this paper chooses the genetic algorithm which is powerful in searching ability and high efficiency to solve the model.
4.2 The Design of Algorithm
(1)Initializing population
The expression of gene: First the decision variables are coded into binary string. Due to the departure interval is [2, 7], and the value is integer times of 0.5. 5/0.5 = 10, 4
2 =16. We take 12 hour a day as bus service time, and every 2 hour has a
same departure interval . For 4*6=24, so the chromosome length is 24.
Initializing population:The population is consist of 80 individuals. Every individual is a string consisted of 0 and 1.
(2)Calculating fitness.
① Transforming the binary string into
decimalism number.
② Tansforming the number into corresponding departure interval, as follows:
If 0≤ ≤x 12, then h=5+0.5x; (12) If x≥12, then h=5+0.5(x-12). (13)
③ Calculating the value of objective function.
④ Transforming the value of objective function into fitness. As follows:
( )
F x =10000- f x( ), if 100000-f x( ) >0 (14)
( )
F x =0, if 100000-f x( ) ≤0 (15) (3)Genetic manipulation to produce next generation
①Selecting operation: Using method of roulette to choose high fitness individual as paternal population.
②Crossover operation. First we paire the
paternal population, then we randomly select crossing position to cross operation.
③Mutation opration.
(4) The judgment of the termination conditions. We set the population generation as 500. When calculating generation is 500, the calculating will stop.
4.3 Example
[image:3.612.214.397.546.618.2]We take a route of Lanzhou city as an example. This route has ten station. For convenience,the stations is called as 1, 2, 3,…, 10. The basic date of this route is as follows:
Table 1 : The Distance Of Stations
[image:3.612.160.451.641.716.2]Inte rval Distance( km) Inte rval Distance( km) (1,2) (2,3) (2,3) (3,4) (5,6) 0.9 0.8 0.9 1.0 1.1 (6,7) (7,8) (8,9) (9,10) 0.9 1.2 0.9 0.8
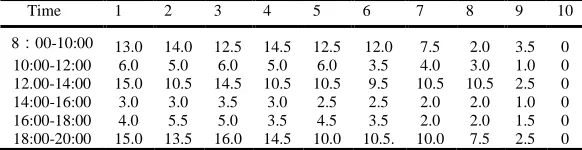
Table 2: The Arriving Rate Of Different Stations Of Different Times
Time 1 2 3 4 5 6 7 8 9 10
Table 3: The Getting Off Rate Of Different Stations
Station 3 4 5 6 7 8 9 1
0
The rate 1
0 1 5
2 0
2 5
2 0
1 5
2 0
1 00
The average value of per waiting time for citizens of Lanzhou city is calcumulated by Per Capita GDP of per time. The Per Capita GDP of Lanzhou city is 15953 RMB in 2011, namely 15953/ (365*24) =1.8211 RMB/h*person=0.0304 RMB/min*person.
4.4 Result Analysis
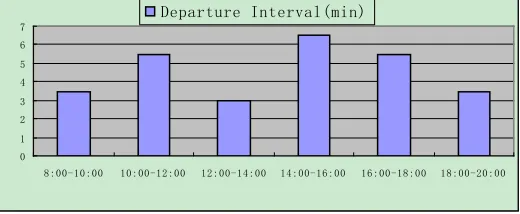
The bus departure interval is obtained by calcumating of computer. The minimum valueof objective function is 86278.43 RMB. The bus departure interval is as follows:
0 1 2 3 4 5 6 7
[image:4.612.185.445.219.326.2]8:00-10:00 10:00-12:00 12:00-14:00 14:00-16:00 16:00-18:00 18:00-20:00 Departure Interval(min)
Figure 1: The Departure Interval Of Different Time
As it is shown in the above figure, the departure is meet the regularity of passengers’ arriving rate. In the time 8:00-10:00, 12:00-14:00, and 18:00-20:00, passengers’ demand is higher, so the departure interval is smaller, while it is bigger in other time.
5. CONCLUSION
This paper adopts genetic algorithm to optimize the departure interval from the perspective of bus enterprise and passengers. It builds the model of bus departure interval and takes the crowding cost of passengers into consideration. Reasonable bus departure interval will obtained quickly by this method.
ACKNOWLEDGMENTS
This work is partly supported by the Humanities Social Sciences Programming Project of the Ministry of Education of Chinano. 10YJA630126 and the State Social Science Fund Projectno. 11CJY067 and the Natural Science Foundation of Gansu Province, China (Grant No. 1107RJYA070/1208RJZA164).
REFERENCE:
[1] Furth, P.G, Wilson, W.H.M, “Setting
frequeneies on bus routes: Theory and Practice”, Trans portation Researeh Board, Vol. 818, 1981, pp. l-7.
[2] Kousopoulos, H.N., Amedeo, R.O.doni,
Wilson, N.H.M, “Determination of headways as function of time varying charaeteristics on a transit network”, InComputer seheduling of public transport 2, 1985, pp. 192-220. [3] Ceder, Stern, H.I., “optimal transit tilnetables
for a fixed vehicle fleet”, On Transportation And Ttraffic Theory, 1984, pp. 331-355. [4] Benyahia I, Potvin J Y, “Decision support for
vehicle dispatching using genetic
programming,” IEEE Transaction on System, Man, and Cybernetics, Vol. 28 , No. 3, 1998, pp. 306-314.
[5] M. Spada, M. Bierlaire and T. Liebling,
“Decision-aiding methodology for the school bus routing and scheduling problem”,
Transportation Science, Vol. 39, No. 4, 2005,
pp. 477-490
[6] M.Banihashemi and A. Haghani, “Optimization model for large-scale bus transit scheduling problems”, Transportation Research Record, Vol. 33, No. 17, 2000, pp. 23–30.
[7] S.Y. Yan, C.J. Chi and C.H. Tang, “Inter-city bus routing and timetable setting under stochastic demands”, Transportation Research Part A –Policy and Practice, Vol. 40, No. 7, 2006, pp. 572-586.
[8] H. Wang and J. Shen, “Heuristic approaches for solving transit vehicle scheduling problem with route and fueling time constraints”,
Applied Mathematics and Computation, Vol.
[9] S.W. Lam, L.C. Tang, T.N. Goh, T. Halim, “Multiresponse optimization of dispatch rules for public bus services”, Computers & industrial Engineering, Vol. 56, No. 1, 2005, pp.77-86.
[10] Y.P.Lee, T.An, J.M.Hung, Y.Z.Fan, “Research on intelligent schedule of public traffic vehicles based on genetic algorithm”, Journal of Transportation Systems Engineering and Information Technology, Vol. 3, No. 1, 2003, pp.41-50.
[11] Hwe, S. K., Cheung, R. K., Wan, Y. W., “Merging bus routes in Hong Kong’s central business district: Analysis and models”,
Transportation Research Part A–Policy and
Practice, Vol. 40, No. 10, 2006, pp.918-935. [12] Qian Yongsheng,Shi Peiji, Zeng Qiong, Ma
Changxi, Yin Xiaoting, "Analysis of the influence of occupation rate public trasit vehicles on mixing traffic flow in a two-lane system", Chinese Physics B, Vol.18, No. 9, 2010, pp. 4037-4041.
[13]
![Assessment of Physiological Health Status in Relations to Different Anthropometric and Cardio respiratory Measures of Head Supported Load Carrying Male Porters of Sikkim, India [Article Retracted]](data:image/gif;base64,R0lGODlhAQABAIAAAP///wAAACH5BAEAAAAALAAAAAABAAEAAAICRAEAOw==)