Decision-theoretic Image Retrieval with Embedded Multi-resolution
Mixtures
Nuno Vasconcelos
CRL 2002/04
Decision-theoretic Image Retrieval with Embedded
Multi-resolution Mixtures
Nuno Vasconcelos
Cambridge Research Laboratory
Compaq Computer Corporation
Cambridge MA 02139
April 2002
Abstract
Author email:[email protected]
c Compaq Computer Corporation, 2002
This work may not be copied or reproduced in whole or in part for any commercial purpose. Per-mission to copy in whole or in part without payment of fee is granted for nonprofit educational and research purposes provided that all such whole or partial copies include the following: a notice that such copying is by permission of the Cambridge Research Laboratory of Compaq Computer Corpo-ration in Cambridge, Massachusetts; an acknowledgment of the authors and individual contributors to the work; and all applicable portions of the copyright notice. Copying, reproducing, or repub-lishing for any other purpose shall require a license with payment of fee to the Cambridge Research Laboratory. All rights reserved.
CRL Technical reports are available on the CRL’s web page at http://crl.research.compaq.com.
Compaq Computer Corporation Cambridge Research Laboratory
1
1
Introduction
An architecture for content-based image retrieval (CBIR) consists of three fundamental building blocks: 1) a feature transformation from the space of image observations (e.g. pixels) to a feature space with better retrieval properties, 2) a feature representation that compactly describes how each of the database image classes populates this space, and 3) a similarity function that allows ranking the database classes by similarity to a query. While significant attention has been devoted to each of these individual components, there have been significantly fewer attempts to investigate the interrelationships among them and how these relationships affect the overall performance of retrieval systems.
In fact, a significant fraction of the retrieval literature can be classified into two major groups, according to the emphasis placed on the design of the individual retrieval components. The first group contains solutions tailored for texture (to which we refer astexture-based retrieval) while the second contains solutions tailored for color ( color-based retrieval). Texture retrieval approaches tend to place all emphasis on the design of the feature transformation. The key idea, which can be explicit in the formulation of the problem [71, 75, 17] or only implicit [40, 45, 44, 46], is to finddiscriminantfeature transformations. These are transformations that best separate the feature distributions of the different image classes. Ideally, given small class overlap, simple similarity metrics such as the Euclidean or the Mahalanobis distance (MD) should guarantee good retrieval performance.
On the other hand, discrimination has not been a critical issue for color-based re-trieval, where the features are either the pixel colors themselves or color-ratios that guarantee different types of invariance [23, 26]. Instead significant work has been devoted to the feature representation, consisting mostly of variations on the color his-togram [68], e.g. the color coherence vector [52], the color correlogram [28], color moments [66], etc. Here, similarity metrics are usually norms and, among these,
the distance, also known as histogram intersection(HI) [68], has become quite
popular [68, 56, 58, 41, 59, 64, 66, 1].
While they have worked reasonably well in their specific domains, these represen-tations break down when applied to generic databases. On one hand, the discrimi-nant transformations proposed by texture-based approaches tend to be database spe-cific, e.g. discriminant features for a texture database are usually not discriminant for an object database, and it is therefore not clear that such approaches can be general-ized to the full-blown retrieval problem (where image content is unconstrained). On the other, color-based solutions are plagued by the exponential complexity of the his-togram on the dimension of the feature space, and are therefore only applicable to low-dimensional feature spaces (e.g. the space of pixel colors). Hence, they are unable to capture the spatial dependencies that are crucial for characterizing image properties such as texture or local surface appearance.
2 1 INTRODUCTION
and adopt the criteria ofminimizing probability of retrieval error(MPE). The decision-theoretic formulation has two major properties of interest. First, it leads togeneric
solutions which are optimal in a sense (MPE) that is meaningful for any type of visual databases, e.g. object databases, texture databases, databases of consumer photographs, and so forth. Second, it makes a vast body of existing decision-theoretic results relevant to the retrieval problem, simplifying the task of designing optimal systems.
One well known such result is that the optimal similarity function, in the MPE sense, is that associated with theBayes classifier: the posterior probability, under each database class, of the features vectors in the query. In this work, Bayesian similarity is 1) shown to generalize many of the similarity functions (Mahalanobis distance,
statistic, and minimum discrimination information, among others) in common use in the retrieval literature, and 2) used as a starting point for a decision-theoretic analysis of the trade-offs to be satisfied by the retrieval components, when the goal is to achieve end-to-end optimality. The main result of this analysis is that any retrieval system must indeed achieve a compromise between feature transformation and feature representa-tion, taking into account three conflicting constraints:
fine image discrimination requires the ability to capture local dependencies be-tween image pixels, which can only be achieved through spatially supported features, i.e. when the space of image observations is high-dimensional.
(MPE) optimal performance is only guaranteed for a restricted set ofinvertible feature transformations;
density estimates tend to be poor when the feature space is high-dimensional.
Because an invertible transformation can only map a high dimensional observation space into a high-dimensional feature space, where it is difficult to obtain reliable den-sity estimates, it follows that the design of decision-theoretic retrieval systems always requires either sacrificing the invertability of the transformation (allowing the feature space to be low-dimensional even when the observation space is not), or sacrificing the spatial support of the features (by relying on low-dimensional observation spaces).
Since either of these can have drastic consequences on retrieval accuracy, it is im-portant to base design decisions on a solid understanding of all the involved trade-offs. To obtain such understanding we introduce the notion of embedded feature spaces, which are the spaces obtained by sequential downward projection of a starting feature space. Embedded feature spaces are shown to be anintrinsiccomponent of retrieval systems with linear feature transformations, in the sense that any such transformation originates a sequence of embedded spaces with monotonically decreasing lower bound in probability of error and monotonically increasing density estimation error. In re-sult, for a given feature transformation, the probability of error is a convex function of the number of embedded subspaces considered in the retrieval operation. It follows that the problem of optimal feature design can be decoupled into two smaller subprob-lems: 1) finding the best invertible feature transformation, and 2) finding the subspace dimension where the probability of error achieves its minimum value.
3
the database. We show, however, that efficient solutions are possible whenever the set of transformations of interest is finite, the search restricted to sequences of em-bedded subspaces of a common transformation, and the Gauss mixture adopted for feature representation. The latter is a particularly interesting result due to the fact that Gauss mixtures exhibit three other properties that are appealing in the retrieval context: computational tractability in high-dimensional spaces, ability to approximate arbitrary densities, and compactness. Overall, this leads to the notion of a sequence of embed-ded mixture models. Given a mixture density defined on a starting feature space, this is simply the sequence of mixtures resulting from the projection into the associated embedded subspaces.
Once the Bayesian similarity criteria and the embedded mixture representation are in place, it remains to determine the best finite set of feature transformations to con-sider during feature design. Here we simply draw on what is known about the human visual system and consider the set of multi-resolution transforms. This leads to the no-tion ofembedded multi-resolution mixtures(EMM), which are families of embedded densities ranging over multiple image scales. EMMs are shown to generalize color his-tograms, complementing them with the ability to capture spatial image dependencies and allowing fine control over the invariance properties of the overall image represen-tation. We present a cross-validation algorithm for finding the best multi-resolution decomposition, and determining the associated optimal subspace dimension, that is computationally efficient and has good retrieval performance.
Overall, the retrieval architecture composed by the Bayesian similarity criteria, a multi-resolution feature transformation, and the embedded mixture representation achieves a good compromise between retrieval accuracy, invariance, perceptual rel-evance of similarity judgments, and complexity. We illustrate these properties with an extensive experimental evaluation on three different databases that stress different aspects of the retrieval problem: the Brodatz texture database, the Columbia object database, and the Corel database of stock photography. In all cases, the new approach outperforms solutions representative of the state-of-the-art both in terms of objective (precision/recall) and subjective (perceptual) evaluation.
4 3 DECISION-THEORETIC IMAGE SIMILARITY
2
Terms and notation
We start by introducing some notation. The basic element of image representation is animage observation. This can be a single pixel or a number of them located in a
pre-defined spatial neighborhood. We denote the space of observations by .
The scalar is always used to denote the dimension of the space . Observations are
mapped into feature vectors by alineartransformation
(1)
We refer to as thefeature space, and ! #"
afeature vector. Featuresare the elements of a feature vector. The matrix that defines the transformation
is denoted by$ .
Afeature representationis a probabilistic model for how each of the image classes in the database populates the feature space . We introduce aclass indicator
vari-able%'&)(#*#+,,-.+0/21 and denote the probability density function (pdf) of class 3 by 4658798;:
<=%<3
"
. This also illustrates the following conventions for notation: ran-dom variables are represented in upper-case while values appear in lower-case, vectors are represented in boldface while scalars appear in normal type. Whenever the mean-ing is clear from context we replace the expression above by the simpler458798
=3
"
. Finally, we frequently write:
&> to indicate that the random variable
:
takes values in .
Throughout this work we assume that feature vectors are independent and identi-cally distributed (iid), e.g.
4
5@?.ACBCBCBA5@D
+,-,-+EGF
"
F
H
IKJ
4
5
I
"
One distribution that we will encounter frequently is the Gaussian, of mean L and
covarianceM ,
4 5
"
ON
P+ELP+.M
"
*
Q
;RTSU"WV =MX=ZY#[
?
\
7C7]
[_^ 7C7
\ `
(2)
where
=a=bcL=d=efhg
ibjL "Ek
M
[
bcL
"
(3)
is the quadratic norm defined byM
[
. The Euclidean norm is the particular case in
whichMlnm. Another model that we will frequently refer to is thehistogram. The
histogram of a collection of feature vectorso is a vectorpq2(sr
+,,-,+trsu@1 associated
with a partition of the feature space into v regions(,w
+,,-,+Ewxu@1 , wherersy is the
number of vectors ino landing on cellwzy .
3
Decision-theoretic image similarity
In the CBIR context, image similarity can be formulated as a problem of statistical classification. Given the feature space , a retrieval system is simply a map
{
3.1 A unified view of image similarity 5
from to the index set of the / classes in the database. In this sense, it is natural
to adopt a decision-theoretic formulation of the retrieval problem, where the goal is to design systems that haveminimum probability of retrieval error, i.e. that are wrong as rarely as possible.
Definition 1 A minimum probability of error (MPE) retrieval system is the mapping
{
n}(#*#+,-,.+0/21
that minimizes
4 5A9
{
!:" <%
"
Under this definition, the optimal similarity function is well known [15].
Theorem 1 Given a feature space and a query , the similarity function that
min-imizes the probability of retrieval error is the Bayes or maximum a posteriori (MAP) classifier
{
"
T0 s
4975 3=
"
(4)
Furthermore, the probability of error is lower bounded by theBayes error
*b ]
T
4975 3=
"
+ (5)
where
]
means expectation with respect to4
5
"
.
Proof:See appendix A.1.
One way to implement the MAP classifier is with recourse to Bayes rule
{
"
T0 s
F
H
IKJ
465798
I
=3 "W4 9 !
<3
"
T0 s
F
IKJ d
4658798
I
=3 "U¡
d
4
9
3
"
+ (6)
where we have used the iid assumption for:
. Equation (6) is denoted byBayesian retrieval criteriaand image retrieval based on it asdecision-theoretic retrieval(DTR).
3.1
A unified view of image similarity
6 3 DECISION-THEORETIC IMAGE SIMILARITY
The assumptions/approximations required to derive several popular similarity func-tions from the Bayesian criteria are depicted in Figure 1. If an upper bound on the Bayes error of a collection of two-way classification problems is minimized instead of the probability of error of the original problem, the Bayesian criteria reduces to the
Bhattacharyya distance(BD). On the other hand, if the original criteria is minimized, but the different image classes are assumed to be equally likely a priori, we have the
maximum likelihood(ML) retrieval criteria. As the number of query vectors grows to infinity the ML criteria tends to theminimum discrimination information(MDI), which in turn can be approximated by the test by performing a simple first order Taylor
series expansion. Alternatively, MDI can be simplified by assuming that the underlying probability densities belong to a pre-defined family. Forauto-regressive sourcesit re-duces to theItakura-Saitodistance that has received significant attention in the speech literature. In the Gaussian case, further assumption of orthonormal covariance matri-ces leads to thequadratic distance(QD) frequently found in the compression literature. The next possible simplification is to assume that all classes share the same covariance matrix, leading to the MD. Finally, assuming identity covariances results in the square of theEuclidean distance(ED). We next derive in more detail all these relationships.
Bayes
2
χ
i
Σ = I
q
Σ = Σi
MDI
Itakura -Saito Gaussian
Σ orthonormal
Auto-regressive processes Equal priors
Quadratic
Mahalanobis Bhattacharyya ML
Euclidean Linearization
2-way bound
[image:10.612.196.465.340.644.2]Large N
3.1 A unified view of image similarity 7
3.1.1 Bhattacharyya distance
If there are only two classes in the classification problem, (5) can be written as [22]
]
¢d£
!4975!¤ =
"
+
4¥975 *¦=
"E"§
¨
4
5
"
¢a£
4¥975!¤ =
"
+
4975 *¦=
"§ #
¨ ¢d£
4¥579 =
¤¦"W4
9
!¤#"
+
4¥579 =©*
"W4
9
*
" #
ª
Q
4 9 ;¤#"W4 9
*
"
¨
g
46579« =
¤#"E4658798 =©*
"
#P+
where we have used the bound¢d£ ¬
+0
ª)®
¬
. The last integral is usually known as
the Bhattacharyya distance between4P579« =
¤#"
and4¥579 =©*
"
and has been proposed (e.g. [47, 11]) for image retrieval where, for a query density4
5
"
, it takes the form
{
"
< ~K¢a£
¨
g
4 5
"W4¥579 =3
"
#P (7)
The resulting classifier can thus be seen as the one which finds the lowest upper-bound on the Bayes error for the collection of two-class problems involving the query and each of the database classes.
Whenever it is possible to solve the minimization of the error probability on the multi-class retrieval problem it makes small sense to replace it by the search for the two class problem with the smallest error bound. Consequently, the above interpretation of the BD makes it clear that, in general, there is small justification to prefer it to DTR.
3.1.2 Maximum likelihood
It is a straightforward consequence of (6) that, when all image classes are a priori equally likely,4 9
3
"
h*°¯,/ ,
{
"
O T0P s
*
±
F
IKJ a
465798
I
=3
"
(8)
This decision rule is known as the maximum likelihood classifier. While class priors
4
9
3
"
8 3 DECISION-THEORETIC IMAGE SIMILARITY
3.1.3 Minimum discrimination information
If²
+E3@n*~+
R
+ are the hypotheses that is drawn from the statistical population with
density4
"
, theKullback-Leibler divergence (KLD) orrelative entropy[33, 13]
³ 4 " =a= 4 "§ O¨ 4 " a 4 " 4
" ~ (9)
measures the mean information per observation from4
"
for discrimination in favor of²
against ²
. Because it measures the difficulty of discriminating between the two populations, and is always non-negative and equal to zero only when 4
" 4 "
[33], the KLD has been proposed as a measure of similarity for various com-pression and signal processing problems [27, 36, 18, 10].
Given a density4
"
and a family of densities´ the MDI criteria [33] seeks the
density in´ that is the “nearest neighbor” of
4
"
in the KLD sense
4 " O T0 ¢d£ µ \¶ ]T·§¸~¹ ³ 4 " =d= 4 "§
If´ is a large family, containing
4
"
, this problem has the trivial solution4
" 4 "
, which is not always the most interesting. In other cases, a sample from4
"
is available but the explicit form of the distribution is not known. In these situations it may be more useful to seek for the distribution that minimizes the KLD subject to a stricter set of constraints. Kullback suggested the problem
4 " ~K ¢a£ µ \ ¶ ]T·¸~¹ ³ 4 " =d= 4 "§ subject to ¨ º "E4 " <» whereº "
is a measurable statistic (e.g. the mean whenº
"
¼ ) and» can be
computed from a sample (e.g. the sample mean). He showed that the minimum is 1) achieved by 4 " * ½ Y [¾ k ¶ ]T· 4 " where½
is a normalizing constant,½ ¿ Y [¾ k ¶ ]T· 4 "
# , andÀ a Lagrange
multi-plier that weighs the importance of the constraint; and 2) equal to
³ 4 " =a= 4 "§ b8À»Áb d ½
Gray and his colleagues have studied extensively the case in which4
"
3.1 A unified view of image similarity 9
The KLD has only been recently considered in the retrieval literature [78, 31, 56, 7, 16], where attention has focused on the unconstrained MDI problem
{ " < T0¢a£ ³ 4 5 " =a= 46579 =3 "§ + (10) where4 5 "
is the density of the query and 458798 =3
"
that of the 3§Â!à image class.
Similarly to the constrained case, it is possible to derive a connection between uncon-strained MDI and maximum likelihood. However, the connection is much stronger in the unconstrained case since there is no need to make any assumptions regarding the type of densities involved. In particular, by simple application of the law of large numbers to (8),
{ " T0P s ] a 46579« =3 "§ as± ÅÄ T0P s ¨ 4 5 " a 4658798 =3 " # T0P¢d£ ¨ 4 5 " a 4 5 " #ibƨ 4 5 " a 4¥579« =3 " # T0P¢d£ ¨ 4 5 " a 4 5 " 46579« =3 " # T0P¢d£ ³
4 5
" =a= 4¥579 =3 "§ + where ]
is the expectation with respect to the query density4
5
"
. This means that, independently of the type of densities, MDI is simply the asymptotic limit of the ML criteria as the cardinality of the query grows to infinity. This relationship is important for various reasons. First, it confirms that the Bayesian criteria converges to a meaning-ful similarity function between image densities as the cardinality of the query grows. Second, it makes it clear that while ML and MDI perform equally well for image-based queries, the Bayesian criteria has the added advantage of also enabling queries based on image regions. Finally, it establishes a connection between the Bayesian criteria and several similarity functions that can be derived from MDI.
3.1.4 6 test
The first of such similarity functions is the statistic. Using a first order Taylor series
approximation for the logarithmic function aboutÇÈ* ,
d
Ç
"É
ÇbÊ* , we obtain
10 3 DECISION-THEORETIC IMAGE SIMILARITY ¨ÌË 4 " b 4 "E4 " 4 " b 4 "U¡Í4 "WÎ ~ ¨ !4 " b 4 "E" 4 " ~P+
where we have used the fact that¿
4 " ~Ïh*~+K3¥*#+ R
. In the retrieval context, this means that MDI can be approximated by
{ "É T0¢d£ ¨ !4 5 " b 4¥579« =3 "K" 4¥5798 =3
" ~P (11)
The integral on the right is known as the statistic and the resulting criteria a
test [51]. It has been proposed as a metric for image similarity in [61, 7, 56, 35], among others. Since it results from the linearization of the KLD, it can be seen as an approximation to the asymptotic limit of the ML criteria. Obviously, this linearization can discard a significant amount of information and there is, in general, no reason to believe that it should perform better than DTR.
3.1.5 The Gaussian case
Several similarity functions of practical interest can be derived from the Bayesian cri-teria when the class likelihood functions are Gaussian. In this case, (8) becomes
{ " ~KP¢a£ a «=M = ¡ * ± V V bcL " k M [ V bcL " ~KP¢a£ a «=M = ¡ÑÐ Ò + (12) where Ð Ò * ± V V bcL " k M [ V bcL "
is thequadratic distance (QD) commonly found in the perceptually weighted com-pression literature [24, 38]. As a retrieval metric, the QD can thus be seen as the result of imposing two stringent restrictions on the generic ML criteria. First, that all im-age sources are Gaussian and, second, that their covariance matrices are orthonormal (=M
=~h*~+WÓ_3
"
. Furthermore, because
3.1 A unified view of image similarity 11 ÕÖ ¬Ø× Y M [ Ô M ] Ø¡ ´ + (13)
where>*s¯Ô ±hÙ
V
V and Ô
M ] h*°¯ ±hÙ V V bÈÔ ", V bÔ " k
are, respectively, the sample mean and covariance of
V and ´ Ô bcL " k M [ Ô bcL " k
the Mahalanobis distance, we see that the MD results from complementing Gaussianity with the assumption that all classes have the same covariance (M
]
)M
MÚ+Ó_3).
Finally, if this covariance is the identity (MÛÑm ), we obtain the square of the
Euclidean distance (ED) ormean squared error
Ü Ô bjL " k Ô ibcL " (14)
The MD, the ED, and variations on both, have been widely used in the retrieval litera-ture [64, 41, 1, 65, 49, 62, 54, 44, 53, 6, 56, 70, 59, 3].
3.1.6 Some intuition for the advantages of DTR
The analysis of the Gaussian case emphasizes why there is little justification to prefer any of the above three similarity metrics to the Bayesian criteria. Recall that while for the latter the similarity function is
{ " T0¢d£ a «=M = ¡ QD
Ý Þ.ß à
ÕÖ ¬Ø× Y M [ Ô M ] x¡O Ô bjL " k M [ Ô bjL " k
ß àÝ Þ
MD
+ (15)
all other three are approximations that arbitrarily discard covariance information. As shown in Figure 2, this information is important for the detection of subtle vari-ations such as rotation and scaling in feature space. In a) and b), we show the distance, under both QD and MD between a Gaussian and a replica rotated byȇ&
¤
+
S
. Plot b) clearly illustrates that while the MD has no ability to distinguish between the rotated Gaussians, the inclusion of the ÕÖ
¬Ø× Y M [ Ô M ]
term leads to a much more intuitive measure of similarity: minimum when both Gaussians are aligned and maximum when they are rotated byS
¯
R
.
As illustrated by c) and d), further inclusion of the term
d «=M
= (full ML retrieval)
penalizes mismatches in scaling. In plot c), we show two Gaussians, with covariances
M
]
2m andM
2â-m , centered on zero. In this example, MD is always zero, while ÕÖ ¬Ø× Y M [ Ô M ] ã
*s¯sâ penalizes smallâ and a =M = ã a
â penalizes largeâ . The
total distance is shown as a function of
a
âU in plot d) where, once again, we observe
an intuitive behavior: the penalty is minimal when both Gaussians have the same scale (
d â«
¤
), increasing monotonically with the amount of scale mismatch. Notice that if the
d «=M
= term is not included, large changes in scale may not be penalized at all.
3.1.7 norms
12 3 DECISION-THEORETIC IMAGE SIMILARITY
θ
0 0.1 0.2 0.3 0.4 0.5 0.6 0.7 0.8 0.9 1 0
2 4 6 8 10 12 14 16 18
θ/π
Distance
QD MD
a) b)
i=σ2I Σx
Σ
= I
−1.5 −1 −0.5 0 0.5 1 1.5 2 2.5 −1
0 1 2 3 4 5
log σ2
Distance
ML MD QD
c) d)
Figure 2: a) A Gaussian with mean;¤
+
¤#"
k
and covariance#3
¬
{
!ä
+
¤
R#å~"
and its replica rotated by » . b) Distance between the Gaussian and its rotated replica as a function
of»¦¯
S
under both the QD and the MD. c) Two Gaussians with different scales. d) Distance between them as a function of
a
[image:16.612.184.483.217.511.2]13
theP norm of the difference between densities
{
;:X"
T0¢d£
Ëz¨
=
4 5
"
b
4¥579 =3
"
=
#
Î
?
æ
(16)
These norms are particularly common in the color-based retrieval literature as similar-ity metrics for color histograms. Definingç to be the histogram ofè query vectors,
andé
the histogram of4
vectors from the3Â!Ã image class, (16) reduces to
{
!:"
< ~Ká¢a£ ëê
yíì
ì
ì
ì
î
y
è
bï
y
4
ì
ì
ì
ì
Tð
?
æ
+
As shown in [68], when the histograms are normalized (Ù
y
î
yñ¯Tè
Ù
y
ï
y
¯
4
*#+Ó_3), the minimization of the distance is equivalent to the maximization of the HI
{
!:"
~KP T
Ù
y
¢d£
î
y~+
ï
y
"
è
(17)
While (8) minimizes the classification error, (16) implies that minimizing pointwise similarity between density estimates should be the ultimate retrieval criteria. Clearly, for any of the two criteria to work, it is necessary that the estimates be close to the true densities. However, it is known (e.g. see Theorem 6.5 of [15]) that the probability of error of rules of the type of (8) tends to the Bayes error orders of magnitude faster than the associated density estimates tend to the right distributions. This implies that accurate density estimates are not required everywhere for the classification criteria to work.
In fact, accuracy is required only in the regions near the boundaries between the different classes, because these are the only regions that matter for the classification decisions. On the other hand, the criteria of (16) is clearly dependent on the quality of the density estimates all over . It, therefore, places a much more stringent
require-ment on the quality of these estimates and, since density estimation is know to be a difficult problem [76, 63], it is unlikely that it will perform better than (8). This is indeed confirmed by the experimental results presented in section 7.
4
Decision-theoretic guidelines for image representation
One of the interesting properties of the DTR formulation is that it enables the de-sign of systems where all components are optimized with respect to a common criteria (probability of retrieval error). We next analyze how the feature transformation and representation impact the overall system optimality.
4.1
Feature transformation
14 4 DECISION-THEORETIC GUIDELINES FOR IMAGE REPRESENTATION
Theorem 2 Given a retrieval system with observation space and a feature
transfor-mation + then ò ó (18) where ó and
are, respectively, the Bayes errors on
and . Furthermore,
equality is achieved if and only if
is an invertible transformation.
Proof:see appendix A.2.
The last statement of the theorem is a worst-case result. In fact, for a specific retrieval problem, it may be possible to find non-invertible feature transformations that do not increase Bayes error. What is not possible is to find 1) a feature transformation that will reduce the Bayes error, or 2) a universal non-invertible feature transformation guaranteed not to increase the Bayes error on all retrieval problems.
4.2
Feature representation
While a necessary condition, low Bayes error is not sufficient for accurate retrieval since the actual error may be much larger than the lower bound.
Theorem 3 Given a retrieval system with a feature space , unknown class
probabil-ities4
9
3
"
, class densities4¥5798 =3
"
, and a decision function
{ " ~K T Ð ï 579 =3 " Ð ï 9 3 " + (19)
the actual probability of error is upper bounded by
4 { ;:X" % " ª ¡ ¨ô= 4¥5798 =3 "E4 9 3 " b Ð ï 5798 =3 " Ð ï 9 3 "
=#P (20)
Proof:see appendix A.3.
In the remainder of this work we assume that the classes are a-priori equiprobable, i.e.4
9
3
"
*s¯/+Ó3. This leads to the following corollary.
Corollary 1 Given a retrieval problem with equiprobable classes, a feature space ,
unknown class conditional likelihood functions4P579« =3
"
, and a decision function
{ " T0 s Ð ï 579 =3 " + (21)
the difference between the actual and Bayes error is upper bounded by
4 { ;:X"« O% " b ªõö A (22) where õö A ³
4¥579 =3 " =a= Ð ï 579« =3 "§ + (23)
4.3 Strategies for image representation 15
Proof:see Appendix A.4.
In summary, the difference between the actual probability of retrieval error and the Bayes error is upper bounded by the error in the density estimates. This implies that, if the Bayes error is small, accurate density estimation is a sufficient condition for high retrieval accuracy. In particular, good density estimation will suffice to guarantee optimal performance when the feature transformation is invertible.
4.3
Strategies for image representation
The two theorems are convenient tools for analyzing the balance between feature trans-formation and representation achieved by any retrieval strategy. We now proceed to do so for two strategies in widespread use in the literature.
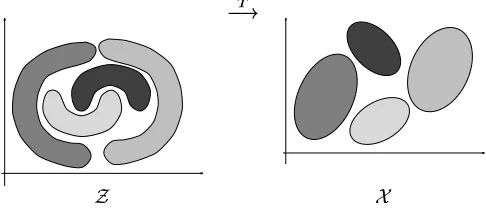
4.3.1 The color strategy
The theorems suggest that all that really matters for accurate retrieval is good density estimation. Since no feature transformation can reduce the Bayes error, there seems to be no advantage in using one. This is the rationale behind Strategy 1 (S1): avoid feature transformations altogether and do all the estimation directly in . As Figure 3
illustrates, the main problem with this strategy is that density estimation can be difficult in . Significant emphasis must therefore be given to the feature representation which
is required to rely on a sophisticated density model. One possible solution, that has become a de-facto standard for color-based retrieval [68, 56, 58, 41, 59, 64, 66, 1], is the histogram. This solution is illustrated in Figure 3 b).
[image:19.612.173.386.439.531.2]a) b)
Figure 3: Example of a retrieval problem with four image classes. a) In the space of image observations, the class densities can have complicated shapes. b) Strategy 1 is to simply model the class densities as accurately as possible.
While they work reasonably well when is a low-dimensional space, e.g. the 3-D
16 4 DECISION-THEORETIC GUIDELINES FOR IMAGE REPRESENTATION
[image:20.612.227.441.160.233.2]cannot capture the spatial dependencies that are crucial for fine image discrimination. This is illustrated by Figure 4.
Figure 4: Two images that, although visually very dissimilar, have the same color histogram.
4.3.2 The texture strategy
Because accurate density estimation is usually a difficult problem, a feature transfor-mation can be helpful if it makes estitransfor-mation significantly easier in than what it is
in . The rationale behind Strategy 2 (S2) is to exploit this as much as possible: find
a feature transformation that clearly separates the image classes in , rendering
esti-mation trivial. Ideally, in , each class should be characterized by a simple parametric
density, such as the Gaussians in Figure 5, and a simple classifier should be able to guarantee performance close to the Bayes error.
k
b_
[image:20.612.211.454.420.527.2]
Figure 5: Example retrieval problem with four image classes. Strategy 2 is to find a feature transformation such that density estimation is much easier in than in .
Strategy S2 has become prevalent in the texture literature, where numerous feature transformations have been proposed to achievegood discriminationbetween different texture classes [64, 41, 54, 44, 55, 17, 45, 73, 57, 69, 9, 71]. These transformations are then combined with simple similarity functions, like the Mahalanobis and Euclidean distances or variations of these, that assume Gaussianity in . More recently it has
17
of Gaussians in ,without compromising Bayes error. This is usually not possible and,
for acceptable levels of Bayes error, feature densities tend to have non-trivial shapes, e.g. are multi-modal. Assuming a Gaussian model on can therefore lead to poor
density estimates and significant penalties in retrieval precision.
5
Optimal retrieval systems
The two standard strategies can be seen as two ends of a continuum: while S1 is intran-sigent with respect to any loss in Bayes error and therefore asks too much of the feature representation; S2 constrains the representation to trivial models, expecting the feature transformation to do the impossible. It seems that a wiser position would be to stand somewhere in between. Since the overall probability of error is upper bounded by the sum of the Bayes and estimation errors, we need to consider the twosimultaneously.
5.1
Optimal feature representation
With respect to the feature representation, Theorem 3 shows that (whatever the feature transformation may be) there are no guarantees of small probability of error if the density estimates are inaccurate. The quality of these estimates is determined by two factors: the choice of probabilistic model, or feature representation, and the estimation of the parameters of this model.
5.1.1 Parameter estimation
The following lemma shows that, for a given parametric density family, the optimal parameters are obtained by standard maximum likelihood estimation.
Lemma 1 Consider a retrieval problem with equiprobable classes, a feature space ,
a decision function
{
P÷Ké
"
< T0 s
4658798 =3t÷Eé
"
+ (24)
where4¥579« =30÷Ké
"
is a pdf parameterized byé
, and a sequence of samples
(-
+K3& *#+,,-+0/21 , where
contains ±
iid feature vectors from the 3Â!Ã image class in the
database. Then the upper bound on the density estimation error
õö
A
³
4¥5798 =3
"
=d= 4¥579
=30÷Ké
"§
+ (25)
is minimized if
é
< ~K T
ø
*
±
F
ù J
d
4¥5798
A
ù
=3t÷Ké
"
(26)
Proof:see Appendix A.5
18 5 OPTIMAL RETRIEVAL SYSTEMS
5.1.2 Parametric density families
We have seen in the previous section that the Gaussian and histogram models can im-pose strong limitations on retrieval accuracy. There are, however, several more so-phisticated density models including vector quantizers [25], decision-trees [8], mix-tures [72], and kernel-based representations [63]. While all of the latter overcome the main limitations of the former, they introduce some problems of their own.
For example, kernel-based density estimates do not provide a compact description of the underlying density (their complexity is proportional to the number of feature vectors in the training set) and lead to a similarity function (8) that is too complex for most retrieval applications. On the other hand, vector quantizers and decision-trees assume a partition of the feature space into mutually exclusive cells that can originate significant fluctuations of the density estimates in the presence of small variations of the true density [80]. In fact, these representations can be seen as generalizations of the histogram that, while overcoming the problem of exponential complexity in the dimension of the space, still exhibit all the limitations associated with a partition of the feature space into non-overlapping cells. Such limitations are avoided by mixture models.
Definition 2 A mixture density is a density of the form
4
5
"
ú
û
J
4657üÆ =ý
"W4
ü
ý
"
+ (27)
where( 4¥57ü
=ý
"
1
ú
û
J
is a sequence of mixture components.
Mixture models are particularly well suited for the retrieval problem due to four main properties. First, because the mixture inherits the complexity of its components, it is tractable in high dimensions whenever the components are. In the Gaussian case, complexity is only quadratic in the dimension of the space (linear for Gaussians of diagonal covariance). Mixtures are therefore significantly more tractable than his-tograms. Second, like histograms, mixtures can approximate arbitrary densities. In fact, because they rely on smoother kernels, approximations based on mixtures can be significantly better than those possible with histograms, vector quantizers, or decision trees [63, 39, 37]. Third, as is clear from (27), the complexity of a mixture is linear in the number of componentsþ , which is usually small. Hence, unlike kernel-based
methods, mixtures provide a compact representation of the underlying density. In this sense, mixtures combine the good properties of the Gaussian, histogram, and kernel-based models: computational tractability, smoothness, and expressiveness. A fourth property, which is particularly relevant in the context of this work, is that once a set of parameter estimates is available for a density defined on , the corresponding
parameters on a sequence of important subspaces are automatically determined. We will return to this issue in section 6.
5.2
Optimal feature transformations
5.2 Optimal feature transformations 19
impact on the Bayes error is direct (the Bayes error depends uniquely on the feature transformation), the impact on the estimation error is more subtle. It derives from the phenomena known as the curse of dimensionality: for a given amount of training data, the quality of density estimates degrades as the dimension of the feature space increases. The design of an optimal feature transformation must, therefore, account for both the Bayes and estimation errors. To understand the associated trade-offs we introduce the notion of embedded feature spaces.
5.2.1 Embedded feature spaces
Definition 3 Given two vector spacesÿ and
V ,
, such that#3
ÿ " and#3 V "
an embedding is a mapping
ÿ Å
V (28)
which is one-to-one.
A canonical example of embedding is the zero padding operator for Euclidean spaces
V ÿ ÿ ' V (29) where V ÿ " P+ " ,c& ÿ
, and&
V
[
ÿ
.
Definition 4 A sequence of vector spaces(°
+,-,-+0
1 , such that#3
" f#3 " , is called embedded if there exists a sequence of embeddings
+3P*#+,,-+Kqbf*#+ (30) such that < .
The inverse operation of an embedding is a submersion.
Definition 5 Given two vector spaces
ÿ and
V ,
, such that#3
ÿ " and#3 V "
a submersion is a mapping
V
ÿ (31)
which is surjective.
A canonical example of submersion is the projection of Euclidean spaces along the coordinate axes S V ÿ V ÿ (32) whereS V ÿ Ç +-,-+EÇ_ÿ+KÇzÿ +,,-,+KÇ V " Ç +,-,-+EÇzÿ " .
20 5 OPTIMAL RETRIEVAL SYSTEMS
Theorem 4 Let
Å Ê +
be a linear feature transformation. Then,
S
"
+K3P*~+-,,,+KqbÊ* (33)
is a sequence of embedded feature spaces such that
?
ª
(34)
Furthermore, if :
Ñ(
:
+-,-,+
:
1 is a sequence or random variables such that
:
&i
,
:
S
!:"
+K3h*~+,-,+0 (35)
and(
{
"
1
a sequence of decision functions
{
"
< T0 s
ù
Ð
ï
5
79 =
"
(36)
then
õ ö
? A
?
ò
õ ö
A
(37)
Proof:see Appendix A.6.
It follows that, in general, it is impossible to minimize the Bayes and estimation errors simultaneously. On one hand, given a feature space
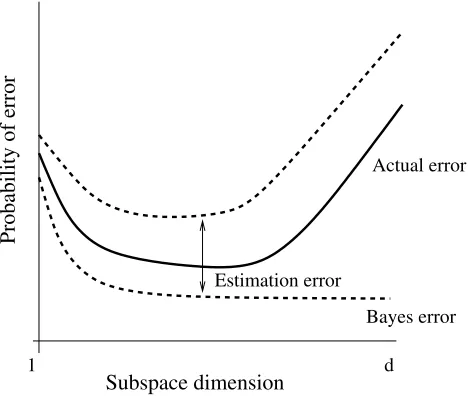
it is usually possible to find a subspace where density estimates are more accurate. On the other, the projection onto this subspace will increase the Bayes error. The practical result is that there is always a need to reach a compromise between the two sources of error. This is illus-trated by Figure 6 which shows the typical evolution of the upper and lower bounds on the probability of error as one considers successively higher-dimensional subspaces of a feature space .
Since accurate density estimates can usually be obtained in low-dimensional spaces, the two bounds tend to be close when the subspace dimension is small. In this case, the probability of error is dominated by the Bayes error. For higher-dimensional subspaces the decrease in Bayes error is canceled by an increase in estimation error and the actual probability of error increases. Overall, the curve of the probability of error exhibits the convex shape depicted in the figure, where an inflection point marks the subspace dimension for which Bayes error ceases to be dominant. To achieve optimality, in the MPE sense, aretrieval system must therefore operate on the inflection point with the smallest probability of error.
5.2.2 Optimality criteria
It is straightforward to show (see (52) in the proof of Theorem 1) that a retrieval system with class densities4579
=3
"
, and decision function (19) has probability of error
4
{
!:" <%
*b
5 4¥975
% ~KP s
I
Ð
9@75 =
"
= "§
21
d Estimation error
1
Subspace dimension
Probability of error
Actual error
[image:25.612.161.396.125.323.2]Bayes error
Figure 6: Upper bound, lower bound, and probability of error as a function of subspace dimension.
Nevertheless, because this equation depends on the unknown4579« =3
"
, it is impossi-ble to minimize the probability of error explicitly. One solution is to assume that the estimates Ð
ï
58798 =3
"
are good approximations to the true densities, in which case
4
{
!:X"« %
É *b
5q T
Ð
ï
975 3.=
"§
(39)
In this regime, it follows from the law of large numbers that, given a training sample of image observations (
+-,-+ F 1 , the optimal feature transformation is
T0 s
*
±
F
ù J
T
Ð
ï
975
3= !
ù
"§
(40)
6
Embedded feature representations
In general, (40) can be a complicated problem since the optimal feature transformation depends on the density estimates49@75
3= !
ù
"§
which, in turn depend on the feature space . Hence, the optimization must resort to an iterative procedure where densities
22 6 EMBEDDED FEATURE REPRESENTATIONS
6.1
Embedded mixture models
A simpler alternative is to consider only sequences of embedded subspaces of a mon transformation. The next lemma shows that this can significantly reduce the com-plexity of density estimation.
Lemma 2 Let be a feature space,(°
I
1 a sequence of embedded subspaces
accord-ing to (33), and:
a sequence of random vectors according to (35). If, under class3,
:
is distributed according to the Gaussian mixture density
4¥579« =3 " ú J S A N P+EL A +tM A " (41) then,Ó &*~+,-,+0 , 4¥5-798 =3 " ú J S A N P+ I L A + I M A I " k + (42) where I m I [ I
, is the projection matrix associated withS
I , m I the identity matrix, and [ I
a matrix of zeros.
Proof:see appendix A.7.
The lemma shows that once a set of parameter estimates is obtained for , the
sequence of density estimates in the embedded subspaces
I
is automatically known. The collection of densities in (42) is denoted by the family ofembedded mixture models
associated with:
. Notice that once an estimate is available for (
S A +EL A +.M A 1 the
parameters of 4¥5 798 =3
"
are obtained by simply extracting the first
components of the mean vectorsL
A
and the upper-left !
sub-matrix of the covariancesM
A
.
Hence, it is not necessary to repeat the density estimation for each subspace dimension and the overall complexity is really just that of finding the optimal feature transform in
.
In fact, the lemma suggests an efficient cross-validation procedure to find the opti-mal subspace dimension of a given transformation
. The basic idea is to select a set of query images"(#"
+-,,-+"%$1 , establish the associated retrieval ground truth, and
use this set to infer the optimal subspace dimension. An algorithmic description of this procedure is given in Figure 7. It remains to determine how the feature transformation
can itself be found. One possibility, that we explore next, is to restrict the search to a finite dictionary of transformations that satisfy some properties known to be important for visual recognition, e.g. invariance to certain image mappings or plausibility under what is known about human perception.
6.2
Embedded multi-resolution mixture models
6.2 Embedded multi-resolution mixture models 23
subspacedim
"z+
+( 4¥5879
=3
"
+K3h*~+,-,+t/21
"
for each query image"'&«& " :
– apply the transformation
to a collection of observations from"(& to obtain
a set of query feature vectors)&(-*&
A
+-,,,+E*&
A
Fº1
– for each subspace dimension
*~+,-,-+K
+
for each image class3¥h*~+,-,+t/
,
apply (42) to obtain the embedded mixtures4P5
798 =3
"
,
compute
ï
&
A
I
*
±
F
ù J a
4¥5-798S
I
*&
A
ù
"
=3
"
+
sort the
ï
&
A
I by decreasing value and, based on the resulting order,
evaluate some measure of retrieval performance (e.g. precision at some level of recall)v-&
A
I
.
average the retrieval measure across queriesv
I
h*°¯="=
Ù
&
v.&
A
I
return the subspace dimension
T0P s
I
v
I
and associated performance scorev
I0/
.
Figure 7: Algorithm for determining the optimal subspace dimension for a re-trieval problem with feature transformation
, and class densities ( 4P5798
=3
"
+E3> *#+,,-+0/21 .
approximated by a multi-resolution representation localized in space and frequency, and several “biologically plausible” models of early vision are based on this princi-ple [60, 42, 4, 21, 67, 5].
A space/space-frequency representation is obtained by convolving the image with a collection of elementary filters of reduced spatial support and tuned to different spa-tial frequencies and orientations. Several elementary filters have been proposed in the literature, includingdifferences of Gaussians[42],Gabor functions[55, 21], and dif-ferences of offset Gaussians [42], among others. More recently, it has been shown that filters remarkably similar to the receptive fields of cells found in V1 [50, 2] can be learned from training images, by imposing requirements of sparseness [20, 50] or independence [2] in the space/space-frequency coefficients.
When the feature transform
24 6 EMBEDDED FEATURE REPRESENTATIONS
50 100 150 200 250 300 350 20
40 60 80 100 120 140 160 180 200
220 020 40 60 80 100 120 140 160 180 200 220 1000
2000 3000 4000 5000 6000 7000 8000 9000
x1
20 40 60 80 100 120 140 160 180 200 220 0
0.005 0.01 0.015 0.02 0.025 0.03 0.035 0.04
x1
60 80 100 120 140 160 180 −150
−100 −50 0 50 100 150
[image:28.612.197.469.124.336.2]x1 x2
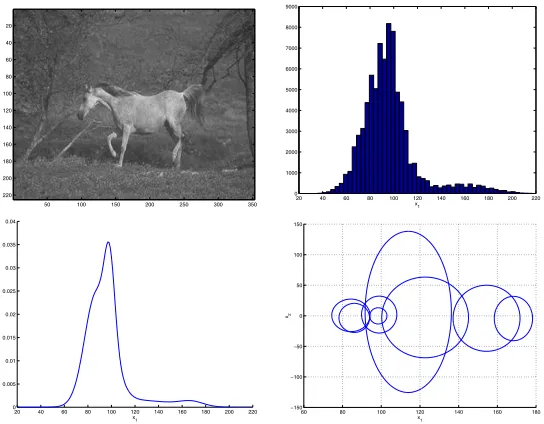
Figure 8: An image from the Corel database (top left), its histogram (top right), and projections of the corresponding1
ä
-dimensional embedded mixture onto the DC sub-space (bottom left), and the subsub-space of the two lower frequency coefficients (bottom right).
The embedded multi-resolution mixture(EMM) model (embedded mixtures on a multi-resolution feature space) can thus be seen as ageneralization of the color his-togram, where the additional dimensions capture the spatial dependencies that are crucial for fine image discrimination (as illustrated in Figure 4). This generalization also enables fine control over the invariance properties of the representation. Since the histogram is approximately invariant to scaling, rotation, and translation, when only the DC subspace is considered the representation is invariant to all these transforma-tions. As high-frequency coefficients are included, invariance is gradually sacrificed. Of course, invariance can always be improved by including the proper examples in the training sample used to learn the parameters of the model.
6.3
Optimal features
Given a finite collection 2l(
¶
·
+,-,-+
¶3
·
1 of multi-resolution transformations,
the optimal transformation can be found by exhaustive search based on the algorithm of Figure 7. In this case, the only non-trivial issue is how to efficiently estimate the densities (
4¥5798 =3
"
+E3Å*~+-,-+0/21 on the different feature spaces. Notice that if
¶54
·
Ñ
¶54
·
and
¶
ÿ
·
¶
ÿ
·
are two invertible transformations in 2 ,
then the transformation ¶4
A
ÿ
·
¶
ÿ
·)6
¶54
·
"
[
maps ¶54
·
into
¶
ÿ
·
. It follows, using arguments similar to those of the proof of Lemma 2, that if in
¶4
·
6.4 Multi-resolution feature transforms 25
optimal transform
"z+2
"
1. select a reference transformation in2 , e.g.
¶
·
;
2. for each image class3P*~+-,-+0/ , use a standard maximum likelihood
estima-tion technique, e.g. the expectaestima-tion-maximizaestima-tion algorithm [14], to determine the mixture parameters of4 587
?:9 79
=3
"
;
3. for each transformationrX
R +,-,+; let ¶ A<ñ· ¶ <ñ· 6 ! ¶ · " [
compute, for each image class 3 *~+,-,+t/ , the parameters of
4 5 75= 9 79 =3 "
using (45) and (46).
let < +Kv < " subspacedim "+ ¶ <-· +,( 4 5 75= 9 79 =3 " +E3P*#+,-,+t/21 "
4. letr
[image:29.612.107.452.402.550.2] < T0 s < v < and < / ; 5. return ¶ < / · I / S I / ! ¶ < / · "
Figure 9: Algorithm for determining the best feature transformation, and subspace dimension for a retrieval problem with transformation dictionary2 .
distribution is, for class3,
4 587?> 9 79 =3 " ú J S A N P+KL 4 A +.M 4 A " (43) then, on ¶ ÿ · , 4 587A@ 9 79 =3 " ú J S A N P+KL ÿ A +.M ÿ A " (44) where L ÿ A $ ¶54 A ÿ · L 4 A (45) M ÿ A $ ¶54 A ÿ · M 4 A $ ¶4 A ÿ · " k (46)
Therefore, it suffices to perform density estimation on a reference subspace, e.g.
¶
·
, in order to obtain the mixture parameters associated with all transformations in2 . The
search for the optimal feature transformation can thus be performed with the algorithm of Figure 9.
6.4
Multi-resolution feature transforms
For a feature transformationôone can define an inverse, reconstruction,
mapping
26 6 EMBEDDED FEATURE REPRESENTATIONS
The columns of the associated matrixB are called basis functions of the
transforma-tion. WhenB2$
k
the transformation is orthogonal. Various popular space/space-frequency representations are derived from orthogonal feature transforms.
Definition 6 The Discrete Cosine Transform (DCT) [32] of size is the orthogonal
transform whose basis functions are defined by:
3t+ ¦"
DC
3
"
C
Ø"FE
G
ZR
Ç
¡
*
"
3
S
R
E
G
ZRsÁ¡
*
":#S
R
+
¤
ª
3t+
+KÇU+
H (47)
whereC
Q
*s¯# for3P
¤
, andCc
Q
R
¯# otherwise.
The DCT is widely used in image compression, and previous recognition experiments have shown that DCT features can lead to recognition rates comparable to those of many features proposed in the recognition literature [77]. It is also possible to show that, for certain classes of stochastic processes, the DCT converges asymptotically to the following transform [32].
Definition 7 Principal Components Analysis (PCA) is the orthogonal transform
de-fined by
$hJI
[
K0ML
k
+ (48)
whereL
I
L
k
is the eigenvector decomposition of the covariance matrix #
k
.
It is well known (and straightforward to show) that PCA generates uncorrelated fea-tures, i.e.
k
'm. In this context, PCA is the optimal redundancy reduction
transform, i.e. the one that produces the most parsimonious description of the input observations. For this reason, PCA has been widely used in both compression and recognition [74, 48].
While they originate spatial/spatial-frequency representations, the major limitation of the above transforms as models for visual perception is the arbitrary nature of their spatial localization (enforced by arbitrarily segmenting images into blocks). This can result in severe scaling mismatches if the block size does not match that of the image detail. Such scaling problems are alleviated by the wavelet representation.
Definition 8 A wavelet transform (WT) [43] is the orthogonal transform whose basis
functions are defined by
3t+ Ø"
®
R
ù 4:NO
R
ù
Çbc3QP NO
R 4
b
PSR'T
ù
A
4VUWXY
\
V
¶
R
A
R
·
T
¶
A
I
·
U6¶ 0Z
A
>·
(49)
whereN
Ç
"
is a function (wavelet) that integrates to zero.
27
Definition 9 Independent Component Analysis (ICA) [10] is a feature transform such
that
4
5
"
H
4
5
"
(50)
where:
\[
+,-,,+
[
"
is the random process from which feature vectors are drawn.
The exact details of ICA depend on the particular algorithm used to learn the basis from a training sample. Since independence is usually difficult to measure and enforce if is large, ICA techniques tend to settle for less ambitious goals. The most popular
solution is to minimize a contrast function which is guaranteed to be zero if the inputs are independent. Examples of such contrast functions are higher order correlations and information-theoretic objective functions[10]. In this work, we consider representa-tives from the two types: the method developed by Comon [12], which uses a contrast function based on high-order cumulants, and the FastICA algorithm [30], that relies on the negative entropy of the features.
7
Experimental evaluation
In this section, we present an experimental evaluation of DTR and a comparison against various retrieval techniques in common use. In the retrieval context, it is desirable to rely on a generic representation that can achieve equally good performance for di-verse types of imagery. For this reason, we conducted experiments on three different databases: the Brodatz texture database, the Columbia object database, and a subset of the Corel database of stock photography. While Brodatz provides a good testing ground for texture retrieval, color-based methods tend to do well on Columbia. Corel contains generic imagery and requires retrieval algorithms that can account for both color and texture. In each case, we surveyed the literature to identify a competing technique that is representative of the state of the art in each area.
7.1
Databases and performance evaluation
The *¤~¤^]
images in the Brodatz database were divided into two subgroups: aquery database of *#*
R
, and a retrieval database of ]`_
1 images. Various previous
stud-ies have identified the combination of 1) the coefficients of the least squares fit of a
multi-resolution simultaneous auto-regressive(MRSAR) model to each texture and 2) the Mahalanobis distance, as a top performer in this database [54, 40, 41]. Follow-ing [45, 40, 44], the MRSAR features were computed usFollow-ing a window of sizeR
*
>R
*
sliding over the image with increments of two pixels in both the horizontal and vertical dimensions. Each feature vector consists of 4 SAR parameters plus the error of the fit achieved by the SAR model at three resolutions, in a total of*
å
dimensions.
The Columbia database was also split into two subsets: a query database containing a single view of each of the *
¤~¤
objects available, and a retrieval database containing
_
views (separated byä#¤ba
28 7 EXPERIMENTAL EVALUATION
by finding the bounding box for all the points in the query and retrieval databases and then dividing each axis in bins. This leads to'c cells. Experiments were performed
with different values of . Retrieval was based on HI.
From Corel we selected *
å
image classes1leading to a total of
*#+ å~¤~¤
images. Of these,R~¤bd
were used on the query database, leaving the remaining]~¤bd
for retrieval. In addition to the texture and color-based approaches, retrieval performance was com-pared against those of two other approaches that are representative of the state of the art in the joint modeling of the two attributes: the color correlogram [28] and the linear combination of color and texture distances. To combine color and texture distances linearly we started by evaluating all the distances between query and database entries according to both HI and MRSAR/MD. For each query, we then normalized all dis-tances by their mean and variance, clipped all values with magnitude larger than three standard deviations, and mapped the resulting interval into¤
+,*
. An overall distance was then computed for each entry in the database, according to
*bý "e
¡
ý
Â
where and
Â
are, respectively, the normalized distances according to HI and MR-SAR/MD, andý a pre-defined weight.
On Corel and Columbia images were converted from the original RGB to the YBR color space. The feature space had1
ä
dimensions per color channel, and features from the different channels were interleaved according to the pattern YBRYBR... Mixtures of]
Gaussians were used for the Brodatz and Corel databases and *f1 for Columbia.
Diagonal covariances were used for all Gaussians, and all the mixture parameters were learned with the EM algorithm [14]. Each image in the database was considered as an independent class. A series of experiments were designed with the goal of evaluating the performance of the individual components of the DTR architecture.
7.2
Similarity function
The first series of experiments was designed to compare the performance of the Bayesian retrieval criteria with that of the, more commonly used, MD or HI similarity functions. In order to isolate the contribution of the similarity function from those of the features and the feature representation, the comparison was performed with the feature sets and representations discussed above for the Brodatz and Columbia databases: color-based retrieval was implemented by combining the color histogram with (8) and texture-based retrieval by the combination of the MRSAR features with (15).
Figure 10 presents precision/recall (PR) curves for the two databases. As expected, textubased retrieval (MRSAR) performs better on Brodatz while color-based re-trieval (color histogramming) does better on Columbia. However, when the appro-priate features and representation are used for the specific database, ML always leads to a clear improvement in retrieval precision. In particular, for the texture database, combining ML with the MRSAR features and the Gaussian representation leads to an
1“Arabian horses”, “auto racing”, “coasts”, “divers and diving”, “English country gardens”, “fireworks”,
7.2 Similarity function 29
10 20 30 40 50 60 70 80 90 100
0.1 0.2 0.3 0.4 0.5 0.6 0.7 0.8 0.9 1
Recall
Precision
MRSAR/MD MRSAR/ML H64/I H64/ML H192/I H192/ML
10 20 30 40 50 60 70 80 90 100
0.2 0.3 0.4 0.5 0.6 0.7 0.8 0.9 1
Recall
Precision
[image:33.612.162.395.177.553.2]H64/I H64/ML H512/I H512/ML H1728/I H1728/ML SAR/MD SAR/ML