warwick.ac.uk/lib-publications
A Thesis Submitted for the Degree of PhD at the University of Warwick
Permanent WRAP URL:
http://wrap.warwick.ac.uk/108599
Copyright and reuse:
This thesis is made available online and is protected by original copyright.
Please scroll down to view the document itself.
Please refer to the repository record for this item for information to help you to cite it.
Our policy information is available from the repository home page.
CAVITATION ASSOCIATED
LOW-FREQUENCY FLUCTUATION
by
ShengcaiU
Self-guided Research Thesis submitted to
Department of Engineering, University o f Warwick, U. K. for
Degree of Doctor o f Philosophy
THE BRITISH LIBRARY
D O C U M E N T SUPPLY C E N T R EB R IT IS H T H E SE S
N O T I C E
The quality of this reproduction is heavily dependent upon the quality of the original thesis submitted for microfilming. Every effort has been made to ensure the highest quality of reproduction possible. If pages are missing, contact the university which granted the’ degree.
•
Som e pages may have indistinct print, especially if the original pages were poorly produced o r if the university sent us an inferior copy. Previously copyrighted materials (journal articles, published texts, etc.) are not filmed.
Reproduction of this thesis, other than as permitted under the United Kingdom Copyright Designs and Patents A ct 1988, o r under specific agreement with the copyright holder, is prohibited.
T H IS THESIS H A S B E E N M IC R O F IL M E D E X A C T L Y A S R E C E IV E D
T H E B R IT IS H r LIBRARY
D O C U M E N T S U PP LY C E N T R E Boston Spa, W etherby W e st Yorkshire, LS23 7B Q
SUMMARY
This self-guided thesis presents the research results of the Cavitation Associated Low-frequency Fluctuation, i. e. one part of the long-term research project on Statistical Characteristics o f Cavitation Bubble Collapse Pulses. Associated Low-frequency Fluctuations and Flow Noise which was initiated and carried out by the author in USA. China and UK successively over last 9 years.
The background and the objectives of the long-term project is introduced in the thesis through a broad review of the development of the cavitation research in the fields relevant to the project.
Then, the observed phenomenon of Cavitation Associated Low-frequency Fluctuation in the venturi cavitating flow of the University of Michigan ( USA ) is explained in detail.
A one-dimensional linear physical model based on the theorem of the interaction between the cavita tion cloud of the homogeneous liquid-vapour/gas mixture and the surrounding liquid portion in the flow system is proposed to describe the mechanism of the phenomenon. The appearance of this low-frequency fluctuation is an association nature of the cavitating flow, which could be regarded as an alternatively indirect indicator of cavitation inception especially in such sort of cavitating flow systems. When the natural frequencies for both the cavitation cloud and the surrounding liquid portion coincide, the low- frequency pressure fluctuation component reaches its maximum, which is defined as Cavitation Resonance.
A numerical verification of the frequency response characteristics, using the hydraulic impedance approach, of this venturi system is presented as well.
u
-PREFACE
The cavitation phenomenon involved in hydraulic machinery has been strongly holding the author's interest. In 1960's, the author as an university student at Peking Institute of Water Resources ( China ) started the research on the cavitation problem of hydraulic turbine which was a specially arranged 3-year research project. It included: the investigation into the possible approach for the improvement of the machine's cavitation performance; the theoretical analysis ( using the approach of successively conform able transformation ), the experimental simulation ( by means of the hydro-electric simulate ) and the numerical verification of the double-raw cascade flows. As the result, a runner structure of double-row cas cade ( i.e. flap structure ) was proposed by the author to improve the cavitation performance of hydraulic turbines/pumps. The above work formed author's Graduation Thesis ( 1964, PhD equivalent; but without the title of PhD due to the absence of the degree structure within China at that lim e). Later on. the concept of using flap structure to improve cavitation performance has been proved by the model test on a axial flow pump in early 1980's and by the Norwegian ( Kvacrncr Brug A/S ) made Francis turbines ( unit capacity 130 MW ) for the Lubuge Power Station ( China) in late 1980’s.
No matter how much effort has been pul into the improvement of the cavitation performance of the machines for avoiding the occurrence of cavitation, the cavitation still occurs very often in hydraulic machinery due to various causes such as the off-optimum operations, minor errors of design/manufacture/repair or some special purposes/requirements ( e.g. the cavitation performance/erosion tests on model/prototype machines ). The cavitation and its effects seem to be unavoidable in the hydraulic machinery. Therefore, the investigation of the characteristics of cavitation/cavitaiing flows must be put in the same important position as the research woik for avoiding their occurrence. But due to the complexity of the phenomenon, cavitation is still not well understood despite about 100 years of research. Usually, the cavitation phenomenon has following features.
1) It is a collective behaviour of the all bubbles involved.
2) It often occurs under a dynamic flow conditions, i. e. the ambient flow conditions ( velocity, pres sure and their gradients/variations ) would have strong influences on the behaviour of cavitation, and vice versa. Therefore, there must be some sort of interaction existing between the cavitation region ( or cavitation cloud ) and the surrounding liquid portion.
3) It is a highly stochastic behaviour even under very carefully controlled conditions.
An investigation of the cavitation behaviour taking into account the above features through some suitable approach would make a significant improvement of our knowledge of cavitation phenomenon. Having realized this fact, in 1981, the author as a Visiting Scientist working at the Cavitation and Multiphase Flow Laboratory ( University of Michigan, USA ) initialed the long-term research project Statistical Charac teristics o f Cavitation Bubble Collapse Pulses, Associated Low-frequency Fluctuations and Flow Noise.
After the two year research, this project has been continued in the Hydraulic Machinery Laboratory ( North China Institute of Water Conservancy and Power, China ) o f which I am in charge.
Since 1989, I have been invited as a SERC ( Science and Engineering Research Council, U. K. ) Principal Research Fellow to help set up cavitation research, which closely follows my above long-term research work, at the Department of Engineering ( University of Warwick, U.K. ). Meanwhile, considering the need for an official title of PhD in my international activities, I decided to take the opportunity of being at the Department to write pan of my previous findings o f the long-term project in PhD thesis form ( by self guidance ) for obtaining the PhD title. My above request was kindly understood and approved by the University Higher Degree Committee, and the special arrangement was thus offered accordingly. This self-guided thesis tilled Cavitation Associated Low-frequency Fluctuation is thus submitted for the Degree of Doctor o f Philosophy. Therefore, I would like to express my special thanks to the Department and the University for their understanding and the special arrangement.
Li, Shengcai
Table of Contents
SUMMARY________________________________________________________ (i) PREFACE__________________________________________________________ (ii) TABLE OF CONTENTS __ (iii) ACKNOWLEDGMENT__ _____________________________________________(via)
DECLARATION... (ix)
NOMENCLATURE__________________________________________________ (x) LIST OF FIGURES AND TABLES... .(xviii)
CHAPTER 1. INTRODUCTION_______________________________________ 1 1.1 Discovery of Cavitation Phenomenon ... 1
1.2 Development of Cavitation Research... 5
1.2.1 Rayleigh’s Analysis ...— ... 5
1.2.2 Single Bubble D ynam ics... 9
1.2.3 Acoustic Emission of Single Bubble ... 29
1.2.4 Acoustic Emission o f Cavitation Bubbles... 31
1.2.5 Mutual Influences between Bubbles — Multi-bubble Behaviour... 39
1.2.6 Cavitation Erosion... 42
1.3 Cavitation Caused Pressure Pulsation... 49
1.3.1 Description of Phenomenon ... 49
1.3.2 Investigation Origin — Author’s Understanding of Cavitation... 50
CHAPTER 2. EXPERIMENTAL METHOD______________________________ 54 2.1 Cavitation Venturi L oop...'....--- 54
i v
-2.1.1 System Configuration ... 54
2.1.2 Venturi Test Section ... 55
2.1.3 Instrumentation... 56
2.1.4 Data Acquisition System ... 57
2.2 Test Method ... 60
2.2.1 Test Procedure ... 60
2.2.2 Test Range... 60
2.2.3 Sampling Parameters ... 61
CHAPTER 3 OBSERVED PHENOMENON AND THEORETICAL ANALYSIS _________________________________________________________ 63 3.1 Phenomenon Features ... 63
3.1.1 Features of Analogue Signals..._...____... 63
3.1.2 Features of Spectra...i...*... . 66
3.2 Theoretical Analysis... 69
3.2.1 Wave Propagation in Bubbly Medium ... 69
3.2.2 Natural Frequency of Cavitation C loud... 74
3.2.3 Physical Model ... 76
4.2 Schematization of Row System... ... 89
4.2.1 Venturi Section... 89
4.2.2 High- and Low Pressure Tanks... 89
4.2.3 Orifice__________________________________________________________ 89 4.2.4 Centrifugal P u m p ... 90
4.3 Numerical Results and Discussion... ... 91
4.3.1 Results_________________________________________________________ 91 4.3.2 Discussion ... 92
CHAPTER 5. PRACTICAL APPLICATIONS — CAVITATION ASSOCI ATED FLUCTUATION IN HYDRAULIC MACHINERY SYSTEMS... ... 93
5.1 Cavitation Row in Draft Tube of Francis Turbine ... 93
5.1.1 Importance and Complexity ... 93
5.1.2 Author’s R em ark... 98
5.2 Experimental S tu d y ... 99
5.2.1 Experimental D esign... 99
5.2.2 Observation... 103
5.2.3 Analysis and D iscussion... 106
CHAPTER 6 SUGGESTIONS FOR FURTHER RESEARCH _________ 112 CHAPTER 7. CONCLUSIONS_________________________________________ 114 REFERENCES_______________________________________________________ 116 APPENDICES________________________________________________________ i A. Programs for Numerical Study of Frequency Response of Venturi Loop ... i B. Data Acquisition Program s_________________ ...._________ _____ ________ ix C. Programs for Frequency Response of HL-160-25 Hydraulic Turbine System
-- -
vii-ACKNOWLEDGMENT
The work presented in this thesis is part of the author’s long-term research project
on Statistical Characteristics o f Cavitation Bubble Collapse Pulses, Associated
Low-frequency Fluctuations and Flow Noise. This long-term project has been carried out sub
sequently in the University of Michigan ( USA ), the North China Institute of Water Con servancy and Power ( China ), and the University of Warwick ( UK ) under following research funds:
National Science Foundation Grant No. ENG 75-2315 ( USA ) Internal University of Michigan Funds ( USA )
National Research Grant No. 87022190 of Water and Power ( China )
Internal Research fund. Department of Power Engineering, North China Institute of Water Conservancy and Power ( China )
SERC Principal Research Fellowship Grant ( UK )
Civil Engineering Research Fund, Dept, of Engineering, University of Warwick ( UK )
I would like to give my deepest thanks to all the parties above for their significantly financial supports; and also to express my sincere thanks to:
My Chinese colleagues, Mr. D. X. Chen, Mr. J. Z. Bai, Mr. H. F. Zhou, Mr. Z C. Pan and Mr. Z. Y. Pei of the Hydraulic Machinery Lab ( NCIWCP, China ), for their assistance in exercising the cavitation test on HL-160-25 model runner; My British colleague. Dr. A. P. Boldy of the Engineering Department ( University of Warwick, U.K. ), for polishing the English language o f the final version of the thesis.
viii
-1* .
DECLARATION
I declare that:
A. This thesis presents one part of the results from my own long-term research project
on Statistical Characteristics o f Cavitation Bubble Collapse Pulses, Associated
Low-frequency Fluctuations and Flow Noise which was initiated by me in 1981 and
thenceforth has been carried out by me over last 9 years. Although at one time some others as the co-operators joined the long-term project, I as the chief investi gator throughout the course of the research have set up the objectives of the research; guided its direction and determined the methods adopted in the research; undertaken the major job of the actual research work such as the design of the experiment, conducting the experiment, programming and computation, and writing the publications.
B. The work presented in the thesis, i.e. the mechanism proposed for the phenomenon of cavitation associated low-frequency fluctuations and its application to the study of cavitating flows in the hydraulic machinery systems, was originally developed from my own idea and achieved by me as the chief investigator and the other co- operators; and these results have been incorporated in several publications, of which I am the first author, such as Statistical Characteristics o f Cavitation Bubble Col
lapse Pulses, Associated Low-frequency Fluctuations and Flow Noise ( J. Hyd.
Research, Vol.24, 1986, No.2 ) and Statistical Considerations on Pressure Pulses
from a Cavitating Venturi ( Proc. Instn. Mech. Engrs. Vol.200, No.C6 ).
X
-NOMENCLATURE
A - cross-section area o f conduit - cross-section area o f throat
â - average amplitude over the frequency range o f the spectrum
a, « amplitude o f the fluctuation a. ■ guide vane opening
b. ■ height o f guide vane
b. ■ relative height o f guide vane
C = capacitance o f the liquid in the pipe; capacitance o f cavity
CQ = velocity distribution coefficient
C, » correction coefficient for circulation evaluation C, « volumetric coefficient
C * cavity compliance
c ; c t = sound speed in liquid/water c . * sound speed at infinity
D = diameter o f conduit D, = diameter o f turbine runner
De = diameter o f cavitated vortex rope
Dt = thermal diffusivity in gas
D, = thermal diffusivity in liquid
de = small perturbation o f the diameter De o f the cavitated vortex rope
E = expectation o f statistical distribution; elastic modulus
xi
-l--LoUap.4Mc = acoustic energy emitted during bubble collapse
= acoustic energy emitted during bubble growth
Efo, ■ total potential energy of a collapsing bubble
e = volume dilation, e thickness of conduit wall
F = vector of mass force
F(o>) = power spectrum of random pulse train
F„(co) = power spectrum for the bubbles with the average radius
Fi.Fa.Fi = frequency bands of the fluctuations in the draft tube of the HL-160-25 turbine
F/ = characteristic frequency of the low-frequency fluctuation / = Darcy-Weisbach factor
fimbbu = natural frequency of air bubble
f c„ = first harmonic frequency of cavitation cloud / / = fluctuation frequency
fuq = first harmonic frequency of the series pipeline /m« = maximum frequency of the harmonic components
f , = sampling frequency
G i = dimensionless driving frequency
G2 = dimensionless parameter in respect of thermal diffusivity in gas
g(ou) = complex spectrum ( Fourier Transform ) of the function describing the waveform of the n th pulse
H= hydraulic head
H = equilibrium hydraulic head
H .= atmosphere pressure at the site ( in terms o f hydraulic head )
xii
-H, * suction head o f turbine
H , - vapour pressure in terms o f hydraulic head
IIB = Brinell hardness
h ’ = small oscillation o f hydraulic head
Icsv ■ power o f cavitation pulses
l.n = power operative in the erosion process
IP - incubation period
K - complex quantity describing the all thermal effects associated with the small- amplitude gas-bubble oscillations
K, = equivalent bulk modulus o f the elasticity o f the liquid in the container
K, = elasticity modulus o f liquid
k = polytropic exponent; coefficient characterizing the linear relation between the ampli tude e, and the time parameter t , o f n th pulse
L = latent heat o f evaporation; inertance o f the liquid in the pipe
Lem, = cavitation cloud length
U = n th pipe length
M = molecular weight o f gas; Mach number = maximum o f Mach number
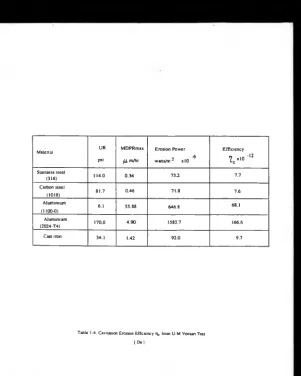
MDPR = mean depth o f penetration rate
MDPRnu = m aximum mean depth o f penetration rate
m = number of pipes in series
N = number o f sampling points
n 'i = unit speed o f turbine
- xiii •
P = pressure
PM * the slope o f th e pump characteristic curve at the operating point
p - pressure
pe = cut-off pressure
p , = gas pressure
Pu**, = maximum o f gas pressure
Pi = internal pressu re o f bubble
Pi,9 = equivalent internal pressure o f bubble
pm = amplitude o f collapse pulse Pm.« = maximum v alu e of pressure p
Pmn = minimum th ro a t pressure
pr - reference pressure
p , = vapour pressure
p (R ) ■ the pressure a t the wall o f the bubble p_ = the pressure a t infinity
Q = initial partial pressure of gas content in the bubble; flow rate
Q = equilibrium flo w rate
Q 'i - unit discharge o f turbine
Q0 = zero-swirling discharge rate
q ’ = small oscillation o f flow rate
R = radius o f cavity/bubble; linearized resistance per unit length o f pipe; radius o f the straight part o f the draft tube
R .j - Reynolds n u m b er at the venturi throat
x iv
-R, * initial radius from which bubble starts collapsing
Rmu = maximum value of radius
Rm» = minimum value of radius
R . « initial radius o f bubble
r ■ radial distance
S - wave speed in the liquid considering the properties o f the conduit wall
Sem = sound speed in cavitation cloud ( liquid-vapour/gas m ixture )
S. = sound speed in liquid-gas mixture
s * complex frequency
s, ■ initial value o f complex frequency s
Aj = correction to the complex frequency s
T = temperature; dominant time interval; tim e interval between successive sampling points
= maximum o f gas temperature
T. = initial gas temperature
TS = ultimate tensile strength r . = absolute temperature at infinite
TM = the slope o f turbine H-Q performance c u rv e at the operating point AT = average time interval
i = time
(« = time at which the n th stochastic event ap p ears
U = the radical component o f the velocity o f th e bubble wall
u - radical component o f velocity
Vcn - cavity volume
V = mean value of the liquid in the container
Vomì = throat velocity
V = velocity vector
WtCO = differential distribution function of the time parameter x »W.H'n&O.H'Gi) = statistical distribution function of the time intervals
W, = statistical distribution of the amplitude density
WM(X) = statistical distribution of the required times for completing M number of collaps
ing bubbles Z = hydraulic impedance Zc = characteristic impedance
* = relative volume of bubble, *=(^-)J; axial coordinate of draft tube
o = void fraction
P = relative radius of bubble, P=^-; damping constant; empirical exponent in respect of the acoustic energy emitted from collapsing bubble; diffusive angle o f draft tube
Paccrue = acoustic component of damping constant
Pitarmai = thermal component of damping constant
Phkow = viscous component of damping constant r = circulation o f vortex rope
y = adiabatic exponent; propagation constant
bs = step length o f frequency scan
-
xvi-1\ * dimensionless pressure amplitude used for the model of the nonlinear gas-bubble oscillations
il* - cavitation erosion efficiency
q. = hydraulic efficiency of hydraulic turbine at zero-swirling operating condition ©n = characteristic function of the stochastic variable of time interval between two suc
cessive pulses X, ■ wave length of sound in gas ti = dynamic viscosity tu = effective " thermal " viscosity
v, = random variable with mean value of zero, describing the stochastic feature of event occurrences
p = water density
P o = density of cavitation cloud pf = gas density
p; = liquid density p = mixture density
p « equilibrium vapour density at temperature T
p_ = density at infinity
o = surface tension; square root of variance; cavitation number oe = cavitation number
Où, = cavitation number for inception
oy = installation cavitation number of turbine
• xvii
-<t» = velocity potential
= small perturbation of velocity potential
♦c« = additional velocity potential caused by the volumetric variation of the cavitated vortex rope
(o = angular frequency
to« = angular frequency of m th harmonic
(a. = natural frequency of bubble; rated angular speed o f turbine
xviii
-LIST OF FIGURES AND TABLES
CHAPTER 1
Figure 1-1. Rayleigh Analysis
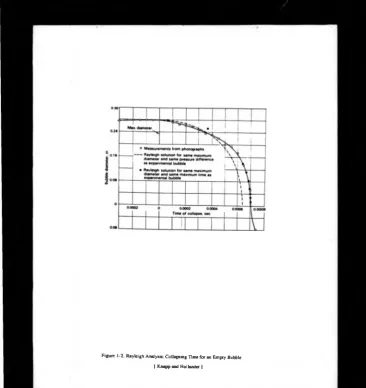
Figure 1-2. Rayleigh Analysis: Collapsing Time for an Empty Bubble
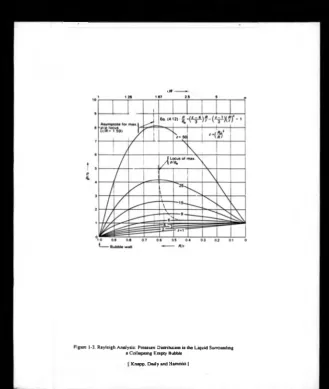
Figure 1-3. Rayleigh Analysis: Pressure Distribution in the Liquid Surrounding a Col lapsing Empty Bubble
Figure 1-4. Growth of a Spherical Bubble in an Incompressible Liquid with and without Viscosity and Surface Tension
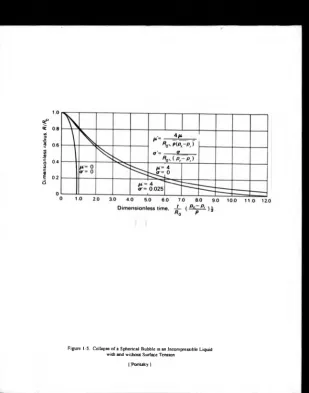
Figure 1-5. Collapse of a Spherical Bubble in an Incompressible Liquid with and without Surface Tension
Figure 1-6. Damping Constant p for Small-amplitude Oscillation of Air Bubble in Water as a Function of Driving Frequency
Figure 1-7. Logarithmic Decrement Per Cycle for Small-amplitude Free Oscillation of an Air Bubble in Water as a Function of Equilibrium Radius R0
Figure 1-8. Variation of Effective Polytropic Exponent k for Diatomic Gas ( y=y) and Monatomic Gas ( y=-j ) with G i and G2
Figure 1-9. Numerical Results for Transient Motion of Gas Bubble in Oscillating Pres sure Field ( ): (a) 11=1.5,^=0.154 (b) q=5,^=1.54
Figure 1-10. Response Curves for Steady Oscillations of an Air bubble of Equilibrium /?o=lO~3 (cm) in Water as a Function of Ratio of Driving Frequency us to Natural Fre quency d)o: (a) T1=0.4 (b) T1=0.5 (c) T1=0.6 (d) ti=0.7 (e) ri=0.8
and Surface Tension.
Figure 1-12. Size versus Time of a Collapsing and Rebounding Bubble Figure 1-13. Variation of Minimum Radius with Relative Gas Content
-fi-Figure 1-14. The Relation of Ecol^r, , *c Vs. ft
-Figurc 1-15. Statistical Distribution of Time Interval for a Random Pulse Train of Pois son Process
Figure 1-16. Influence of Periodicity on Power Spectra
Figure 1-17. Comparison of Theoretical Analysis of Spectra of Pulse Amplitude with Experimental Results from U-M venturi
Figure 1-18. Variation of Maximum Collapse Pressure Pm Resulting from the Interaction of Different Shock Waves, under Different Initial Radius.
Figure 1-19. Flattening and Micro-jet Formation of Air (a) and Hydrogen (b) Bubble Impinged by Shock Waves.
Figure 1-20. Three Cavities ( diameter 3 mm, 6 mm ap art) Parallel to the Shock Wave S. Interframe Time ■ 0.96 p s.
Figure 1-21. Chain Reaction Effect of Shock Wave Interaction. Cavity Diameter = 3 mm, Interframe Time=4.25 p s.
Figure 1-22. Typical Erosion Curve with S-shape Figure 1-23. Statistical Distribution of WM(X)
Table 1-1. Comparison of Incompressible- with Compressible Approach Table 1-2. Test Values of Exponents n
Table 1-3 Test Values of Exponents n
X X
-CHAPTER 2
Figure 2-1. Venturi Cavitating Loop, University of Michigan ( U-M ) Figure 2-2. U-M Venturi Test Section and Transducer Position Figure 2-3 (a). Schematic Cavitating Venturi Facility
Figure 2-3 (b). Venturi Tunnel Facility ( Data Processing Portion: Real Time Computer System)
Figure 2-4. U-M Venturi Static-pressure Profile. Normalized Pressure vs. Axial Position ( Sonic Initiation )
Figure 2-5. Comparison of Cavitation Number vs. Throat Reynolds Number for Various Degrees of Cavitations ( U-M venturi )
Figure 2-6 Calibration Curve of Orifice Device with Plate No. T478211 Figure 2-7. Responses of Kistler 601 A to Underwater Spark Bubble. Figure 2-8. Flow Chart of Main Program
Table 2-1. Characteristics of Kistler Model 601 A
CHAPTER 3
Figure 3-1. Typical Waveforms of Three Components
(a) Flow Noise Waveforms Extracted from Test with y=38.4 m/s, o=1.12 (b) Cavitation Pulse Waveforms Extracted from Test with V=38.4 m/s, o=0.65 (c) Low-frequency Fluctuation Waveforms Extracted from Test with V=38.4 m/s, o=0.74
Figure 3-2. Waveforms of Overall Pressure Pulsations at Different Flow Stages, y=38.4 m/s
xxi
-(b ) 0=0.65
(C) 0=0.74
Figure 3-3 (a). Statistical Distributions of Pressure Pulsations, 0=1.12,0.65 Figure 3-3 (b). Statistical Distributions of Pressure Pulsations, o=0.93,0.84,0.74 Figure 3-4. Waveforms of Overall Pressure Pulsations. VrtrM1= 28 m/s,
0=1.12,0.93,0.74,0.69,0.65 (a) 0=1.12
(b) 0=0.93 (C) 0=0.74
(d ) 0=0.69
(e) o=0.65
Figure 3-5. Waveforms of Overall Pressure Pulsations. ^,*^,=35 m/s, o=1.12,0.84,0.74,0.65 (a ) o = l.l2
(b) 0=0.84 (C) 0=0.74
(d ) o=0.65
Figure 3-6. Frequency Spectra ( Linear P lot), V*,**=38.4 m/s Figure 3-7. Frequency Spectra ( Semilog P lot), V*™«=38.4 m/s Figure 3-8. Non-dimensional Amplitude Q — versus o
Figure 3-9. Sound Speed S, in Water-gas Mixture as Function of o and p
Figure 3-13. Schematic of Venturi Loop at Cavitating Flows
CHAPTER 4
Figure 4-1. Schematization of U-M Venturi System Figure 4-2. Schematization of U-M Venturi Section Figure 4-3. Schematization of High- and Low pressure Tanks Figure 4-4. Hydraulic Impedance of Centrifugal Pump Figure 4-5. Modulus of Z 12 vs. Angular Frequency
Figure 4-6. Mode Shapes and Im pedance Profiles for (»=385.16,917.94,2156.50
CHAPTER 5
Figure 5-1. Schematic of Vortex Rope in the Draft Tube Figure 5-2. Mechanism of Excitation ir the Elbow
Figure 5-3. Cavitation Test Stand (photo) ( Hydraulic Machinery Lab, NCIWCP, China ) Figure 5-4. Schematic Cavitation Test Stand, NCIWCP, China
Figure 5-5. Model Runner HL-160-25
Figure 5-6. Schematic Draft Tube for HL-160-25 Model Runner Figure 5-7. Photograph of Data Acquisition and Processing System Figure 5-8. Schematic Data Acquisition and Processing System
Figure 5-9. Installation of the Piezoelectrical Pressure Transducers on the Inlet of Spiral Case and Draft Tube
Figure 5-10. Photo of PT-80 Piezoelectrical Transducers Figure 5-11. Testing Range of H L-160-25
-Figure 5-13. ( Cavitated ) Central Vortex Filament, air 10 mm, *i'=5l.03 rpm, o ,«1.235 Figure 5-14. ( Cavitated ) Spiral Vortex Rope. ao*10 mm, n!'=81.6S rpm, o ,«1.156 Figure 5-15. ( Cavitated ) Inversely Conic Cavity, ao=7.8l mm, m'=66.34 rpm, o,=1.32 Figure 5-16. Dispersive Liquid-vapour/gas Flow, ao=5.6 mm, m'=45.93 rpm, o,=l.09 Figure 5-17. Waveforms and Spectra of F\ component at ao=5.6mm, /i|'=66.34 rpm,
a ,-1.18
Figure 5-18. Waveforms and Spectra of F 2Component for ao=5.5 mm, n i'=45.93 rpm, o,-1.32
Figure 5-19. Waveforms and Spectra of Component Fj for ao=12.54 mm, «i'=51.03 rpm,
a , =1.59
Figure 5-20. Schematization of HL-160-25 Cavitation Test Stand
Figure 5-21. Approximation of Natural Frequencies for H L-160-25 Cavitation Test Stand Figure 5-22. Vibration Shape Modes, of HL-160-25 System for ji—0.8+126.92 and
i 2—0.364-1393.75
Figure 5-23. Dependence of F2 Frequency on Unit Speed n /
Figure 5-24. Waveform and Spectra foratf=7.81 mm, a t -56.13 rpm, o,=1.285
Figure 5-25. Amplitudes ( at Different Positions of System ) of F 2Component vs. Guide-vane Opening
Table 5-1. Quasi-Dynamic Calibration Results of PT-80 Piezoelectrical Pressure Trans ducers
-1. INTRODUCTION
This chapter is organized as follows. The discovery of cavitation phenomenon and its research development, especially the major achievements contributing to the basic knowledge of cavitation ( such as the bubble dynamics ) and relevant to the author’s research on the long-term project Statistical Characteristics o f Cavitation Bubble Col
lapse Pulses, Associated Low-frequency Fluctuations and Flow Noise ( such as the
acoustic emission of single bubble collapse, acoustic emission of cavitation multi-bubble collapses etc. ), are reviewed.
The reasons are apparent. Firstly, the topic of Cavitation Associated Low-frequency
Fluctuations is only one part of the results from the long term project. Secondly, the
objective of the long-term project is to view the cavitation as the stochastic multi-bubble behaviour considering the mutual influences between bubbles and between the micro- attribution ( growth, collapse, acoustic emission etc. ) of cavitation and the macro attribution ( pressure fluctuation, instability etc. ) of cavitation cloud/flow field. There fore, a broad review of the relevant fields is thus made so that the background and the ini tiative of this research on Cavitation Associated Low-frequency Fluctuation can be well understood.
1.1. Discovery of Cavitation Phenomenon
2
-vapour-bubble dynamics of sub-cooled and super-heated liquids 15]. Sometimes, it would be difficult, especially for cavitation in liquids other than cold water, to make a clear dis tinction between the two types of phenomena.
In 1893, the first important engineering occurrence of cavitation was discovered and investigated by Charles Parsons due to the failure of the propeller on a British high speed warship (2). In 1895, Parsons established the first water-tunnel used for cavitation research, and discovered the relationship between cavitation and its damage on the pro peller [3]. The first analysis of a problem in cavitation bubble dynamics was performed by L. Rayleigh in 1917, who solved the problem of the collapse o f an empty cavity in a large mass of liquid [4]. The above two historical events have underlain the cavitation research theoretically and experimentally. Since then, more than ten thousand research articles and several technical books on cavitation have been published. Nevertheless, our understanding of cavitation and its effects is still very limited.
3
-4
-effcct of cavitation on the guidance of the liquid by the boundary surface is to limit or lessen the force that can be applied to the liquid by the surface [7). Additionally, the cav itation appears to be a highly unsteady phenomenon even though the external flow was originally steady [1], sometimes, the cavitation has the nature of a periodic process. Therefore, some sort of unsteady dynamic effect will be thus introduced into the sur rounding liquid ( even in the whole flow system) due to the formation of cavitation. On the other hand, as the cavitation process ( i. e., the behaviour of bubbles ) is strongly dominated by the flow conditions (such as the pressure/velocity fields, pressure/velocity gradients and their time-dependent variations ), the above modification of the flow pat tern induced by cavitation will thus inversely affect the cavitation itself, i. e., an interac tion or mutual influence between cavitation and surrounding liquid portion/flow system results, which adds further complexity to the cavitation phenomenon. All three factors mentioned above make our understanding of cavitation mechanism very limited and even obscure in some fields.
From the view point of engineering design, there are basically two questions about cavitation which must be answered. Firstly, will cavitation occur in a particular engineer ing practice? Secondly, if the cavitation is unavoidable, can a given design still function properly? To answer these two challenging problems, extensive new approaches, consid ering more factors of cavitation nature such as the stochasticity rather than the single bubble theory, are being introduced into contemporary research of cavitation. As one of these efforts, the long term project on Statistical Characteristics o f Cavitation Bubble
Collapse Pulses, Associated Low-frequency Fluctuations and Flow Noise, or abbreviated
-5
-1.2. Development of Cavitation Research
1.2.1. Rayleigh’s Analysis
The analysis for the collapse of an empty cavity in an infinite field of liquid was performed by L. Rayleigh in 1917 [8). Actually, in 1859, W. Besant already formulated the problem in the following physical model: " an infinite mass of homogeneous incompressible fluid acted upon by no forces is at rest, and a spherical portion o f the fluid is suddenly annihilated; it is required to find the instantaneous alteration of pressure at any point of the mass, and the time in which the cavity will be filled up, the pressure at an infinite distance being supposed to remain constant. Besant used a straight forward application of momentum and continuity equations. That is ( refer to Figure 1-1 )
du du _ 1 dp
where:
(1-2-1) (1-2-2)
u =radial component of velocity at any radial distance r ( >R, the radius of cav ity w all)
p =pressure at distance r and time i
Thus, the velocity of the cavity wall at time / will be
(1.2-3) But, Besant did not elaborate upon his solution and apply it to the cavitation case as did Rayleigh later. In 1917, Rayleigh quoted Besant’s above formulation, then he solved this problem in a different way using the energy approach.
Rayleigh assumed a spherically symmetrical flow field, which is an irrotational flow. Therefore, it has the velocity potential 4», defined by
-Equating Eq.( 1.2-11) to Eq.(1.2-12) yields
If and substitute ^ for U, performing integration for Eq.(1.2-13) gives the time i required for a cavity to collapse from R0 to R :
(1.2-14)
If p=0, the time t for a complete collapse can be evaluated from Eq.(1.2-14),
f 0 9 U 6 K « ,j£ j ^ (1.2-15) A complete collapse for an empty bubble based on Eq.(1.2-14) is shown in Figure 1-2.
Due to the assumption of a empty cavity, equation (1.2-13) shows that the velocity
U would increases to infinite when R reduces to zero. To avoid this, Rayleigh calculated a cavity filled with the gas which behaved isothermally. Thus, the work done as given by Eq.(1.2-12) is equal to the sum of the kinetic energy of the entire liquid expressed by Eq.(1.2-ll) and the work of the gas compression, which equals 4jtG/?din(^), where Q is the initial gas pressure. That is
7 $ ‘" T O M « and U=0 when
P - ^ —Q\ni=0, (1.2-17)
here, *=j j- This means that for any real ( i. e., positive ) value of Q, U comes again to zero before complete collapse, and if Q >pm the first movement of the boundary is out ward. The boundary oscillates between two positions, of which one is the initial.
and with r » R, the general equation of pressure, p ( r j ) , is
p(rj-H > -+ P-\ £ ( Z - 4 ) - £ i ( Z - 1)1 (1.2-18) And, the maximum value forp(/) is p ^ r j ) .
(1.2-19) appearing at
The corresponding pressure distribution in the liquid according to Eq.(1.2-18) is shown
Rayleigh’s above work has be regarded as an important milestone for the cavitation research in the sense of:
A. The collapsing procedure of an empty spherical bubble and the induced pressure distribution have been described in a concisely analytical form;
B. Although Rayleigh’s analysis was based on some approximations, such as incompressible and inviscous liquid, constant pressure p_ and negligence of surface tension etc., the resolution explains the substance of bubble collapsing very well, not only qualitatively but also quantitatively. The variation of bubble size during collapsing, as shown in Fig. 1-2, calculated by Rayleigh theory coincides very well with the measured curve ( from photographs such as done by Knapp et’al 1970 ); collapsing quicker by about 10 % than the measured. The pressure profile during the collapsing ( shown in Fig. 1-3 ) answers the following questions clearly: why the violent pressure will be induced during bubble collapsing; when and whereabouts it appears. And, the oscillation of the bubble boundary following the collapsing as described by Eq.(1.2-17) also gives a very good picture and explanation of the bub ble rebouncing although the decay effect is neglected due to the assumptions of inviscous liquid and no energy dissipation.
9
-Rayleigh’s analyses have formed the most important basic o f cavitation research especially for single bubble dynamics.
1.2.2. Single Bubble Dynamics
Instead of assuming an empty bubble collapsing, most of the progress in under standing the single bubble behaviour has been achieved by considering the dynamic equilibrium of a spherical bubble containing vapour and non-condensible gas in a vari ably ambient pressure field of a liquid with viscosity and surface tension.
If the bubble is static, the interior pressure p, can be expressed as
P.=P.+P*=P(*
where:
p, =vapour pressure
p, =gas pressure o=surface tension
That is, the introduction of surface tension makes the interior pressure in static condition greater than the external pressure o f bubble-wall.
The viscosity also induces further pressure difference. In general, viscosity appears in two terms of the Navier-Stokes form of the momentum equation as follows,
p (1.2-20)
where:
^velocity vector p=dynamic viscosity
r ’- r - i v & f r £ where:
p =mean pressure
p .(e y
<r=volume dilation i=«l+<2+Cj
In the problem of the symmetrical motion of a spherical bubble, the rate of strain becomes
relations with the principal normal rate of strains as follows
because the radial direction is a principal axis. Thus, the pressure p(R) at the bubble wall in the liquid can be expressed as follows
dR p u n - p .- *
For incompressible liquid, i. e., ^-=0,
dR
i^ jf- d.2-21)
or, with surface tension,
dR
pOn-p.-tu^H--2? (1.2-22)
11
-(1.2-23) Here, the pressure at the bubble wall, p, , may be a function of the time, and the pressure at infinite , p_, may also be a function of time.
Shu, S. S. 110) theoretically proved that bubble motion without surface tension leads to an infinite collapsing time if the parameter
exceeds a critical value, i. e., p'20.46, where R0 is the initial radius of bubble. However, as a matter o f fact, the time of collapsing can always be shown to be finite if the effect of the surface tension is included.
The influences of viscosity and surface tension on the growth and collapse of bubble according to Eq.(1.2-23) can be seen from Figs. 1-4 and 1-3, in which R0 is the initial radius of bubble and o' is the other parameter describing the property of surface tension,
As to the problem of the bubble content, the modem investigation of bubble dynam ics arranges itself under two basic categories: One is the Gas Bubble Dynamics in which the bubble interior consists mostly o f the permanent gas. The other is the Vapour Bubble
Dynamics in which the bubble interior is composed almost entirely o f the vapour of the
surrounding liquid. The vapour bubble dynamics can be further divided into the vapour- bubble dynamics in a subcooled liquid and the vapour-bubble dynamics in a superheated
liquid [4]. The former is the case in which the vapour density is so small that the bubble
-
12-ihe vapour bubble motion is controlled by the latent heat flow rather than the liquid iner tia, e. g., the boiling.
Gas Bubble Dynamics
It is assumed that the medium filling the cavity is basically a permanent, noncon densable gas and all the effects of the vapour present in the bubble is neglected due to the small partial pressure of the vapour ( compared with the gas pressure ).
For the analysis of the small-amplitude oscillation o f gas bubble, the linearization method is adopted, which has been summarized by Plesset and Prosperetti [4J. Usually, the small-amplitude radial oscillation is induced when the gas bubble is immersed in a sound field of a wavelength large compared with the bubble radius. Such a driving pres sure perturbation can be approximated as
P-U )=/>-(l+e costa/) (1.2-24) where:
/’^average ambient pressure
o>=angular frequency of driving pressure or sound frequency e=small dimensionless amplitude of perturbation, lei « 1
Thus, the bubble radius can be expressed as
where:
x(/)=a small quantity of order e, lx(/)l « 1
R„ equilibrium radius
p.^f =average internal pressure or the internal pressure at equilibrium The internal pressure p>(t) is linearized about its equilibrium pressure p ,^ as follows
* (/)= * o(H x(0) (1.2-25)
1 4
-p/=liquid density Thus, the natural frequency is
and the viscous, thermal and acoustic damping constants can be respectively identified as
The dependence o f the damping constant p ( =P„„co«i +puur»M/+pac0w«i ) on the driving fre quency can be seen clearly. Except for extremely small bubbles as mentioned above, the low-frequency damping is mainly controlled by thermal effect, and the high-frequency damping by acoustic effects. An example of forced oscillation of an air bubble in water for two different equilibrium radius, *o=10-J and 10-4 cm respectively, are shown in Fig ure 1-6, in which the circle denotes the resonant frequency of bubble.
As to the relation of the damping constant p with the bubble size R0, Figure 1-7 shows the results of Chapman and Plesset [51] demonstrating the logarithmic decrement of an air bubble in water, which is based on the physical model of the free oscilla tions of a gas bubble taking into account the surface tension, viscosity, thermal conduc tion in the gas, and acoustic radiation. The acoustic contribution which did not appear in Eq.( 1.2-28) is here approximated as
In the range of /?o=lO~‘ -4x10-* cm, the thermal component p * ,^ , represented by the
c
con 1 5 con
-tributions to the energy dissipation. From Figure 1-7, it is also can be seen that for extremely small bubbles, such as j?0<1.5xiO-* cm, viscosity plays a very important role in energy dissipation.
The dependence of the effective polytropic exponents * on the driving frequency u of the pressure perturbation was also demonstrated by Prosperetti 150] as
where:
K =complex quantity describing all the thermal effects associated with the gas bubble, which is a function of to, Ra and the properties of the liquid and the gas 150]
If Ci is designated as the dimensionless driving frequency,
° «
where:
M =molecular weight of gas
D, =thermal diffusivity of gas
R, universal gas constant
7 _=absolute temperature of the liquid at a distance from the bubble y=adiabatic exponent, y=y for diatomic gas
And, G 2 denotes a dimensionless parameter in respect of thermal diffusivity of gas,
Then, the relation of the polytropic exponent k with the frequency o> can be expressed in terms of G, and C2,
1 6
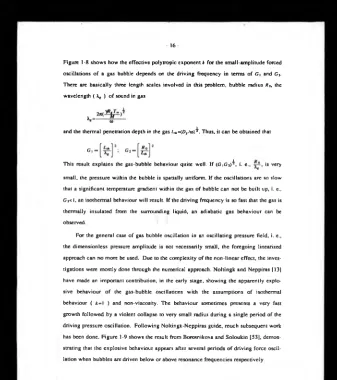
-Figure 1-8 shows how the effective polytropic exponent k for the small-amplitude forced oscillations of a gas bubble depends on the driving frequency in terms of G i and G2. There are basically three length scales involved in this problem, bubble radius R0, the wavelength ( X, ) of sound in gas
small, the pressure within the bubble is spatially uniform. If the oscillations are so slow that a significant temperature gradient within the gas of bubble can not be built up, i. e., G2<1, an isothermal behaviour will result. If the driving frequency is so fast that the gas is thermally insulated from the surrounding liquid, an adiabatic gas behaviour can be observed.
For the general case of gas bubble oscillation in an oscillating pressure field, i. e., the dimensionless pressure amplitude is not necessarily small, the foregoing linearized approach can no more be used. Due to the complexity of the non-linear effect, the inves tigations were mostly done through the numerical approach. Noltingk and Neppiras [13] have made an important contribution, in the early stage, showing the apparently explo sive behaviour o f the gas-bubble oscillations with the assumptions of isothermal behaviour ( *=1 ) and non-viscosity. The behaviour sometimes presents a very fast growth followed by a violent collapse to very small radius during a single period of the driving pressure oscillation. Following Noltingk-Neppiras guide, much subsequent work has been done. Figure 1-9 shows the result from Borotnikova and Soloukin [53], demon strating that the explosive behaviour appears after several periods of driving force oscil lation when bubbles are driven below or above resonance frequencies respectively. and the thermal penetration depth in the gas Lo,=(Dt /w)^. Thus, it can be obtained that
[image:42.383.17.354.13.393.2]1 7
-Assuming the polytropic gas behaviour and neglecting the thermal and acoustic energy dissipation, the forced oscillations of a spherical gas bubble in an incompressible, viscous liquid can be expressed in the following nonlinear ordinary differential equation [13], which is sometimes called the RPNNP ( Rayleigh, Plesset, Noltingk-Neppiras and Poritsky )-bubble model.
where:
p,=vapour pressure remaining basically constant
For the numerical computation, p(i) is often expressed in the sinusoidal form,
p(/)= -Ti/*- cos ov
where:
il=dimensionless pressure amplitude, which is not necessarily small (o=angular frequency which should not exceed certain value to ensure that the wavelength of the external pressure oscillation is much larger than the bubble radius and the value of the pressure p(t) at the bubble-wall can be treated as uniform
In the 1970’s, Lauterbom [52] undertook an extensive numerical work on the solu tion of Eq.( 1.2-32). He calculated three cases of the gas-bubble oscillations for /?«=10"3,10-* and 10-5cm respectively. The normalized " amplitude "
(1.2-32)
where:
Amu=maximum value of the radius during the steady oscillations
-
18-cm in water at 20°C ( p=0.998 g cm’*, p=O.01 g cm-1 sec-1. a= 72.5 dyn cm-1 ) under a static pressure /*«=! bar for several values of the pressure amplitude are shown in Figure 1-10. The fractions on the resonance peaks denote the order of the resonance, i. e., indicates that the period of the bubble oscillation is m times of the driving-pressure period and n
times of the bubble free-oscillation period ( ). The variation of the resonances shown in Figure 1-10 illustrates very clearly how the nonlinear effects of large pressure oscillation affect the characteristics of bubble oscillations, e.g. the Spring Softening effect of the nonlinear system that the resonance peak of the buble oscillations is gradu ally leaning towards the lower frequency region with the increase of the driving-pressure amplitude.
In Figure 1-10, it is also shown that some discontinuities appear on the steady-state response curves due to the instability of the small-amplitude oscillation in a frequency region in which the response curve is multivalued. The subharmonic bubble oscillation behaviour is also observed in Figure 1-10, which is denoted by the fraction of -j at the peak at the frequency of
Cavitation Bubbles
Dominated by the dynamic pressure effect, a bubble composed mainly of vapour ( which usually originates from small gas nucleus) grows to many times of its initial size so fast that the mass-diffusion effect can be neglected, and the gas content plays an unim portant role in the dynamics except near the end of the collapse. According to the impor tance of the thermal effect, this sort of bubble can be further divided into two categories:
Cavitation Bubbles and Boiling Bubbles. Plesset and Prosperetti [4] have given an expla
-
19-where:
L =latent heat of evaporation
p„^(7)=equilibrium vapour density at water temperature T
This energy is acquired through a drop A7' in temperature of the surrounding liquid layer of thickness of the order of the diffusion length (D,i)^, where is the thermal dif-fusivity in the liquid. Therefore, the heat energy supplied is
4kRHD,i) ^pc,AT
Equating the above two energy expression, the temperature drop AT can be evaluated as follows
¿ r = j (1.2-33)
To show the influence of water temperature T on vapour bubble behaviour, two extreme examples are examined by Plesset and Prosperetti [4J. For water at 15*C, with /?=0.l cm, /=10-J sec, p,>Jf=1.3xiO-5i cm-3, AT can be evaluated as =0.2°C. This temperature drop causes a reduction of the equilibrium vapour pressure only of the order of 1%, therefore has little effect on the bubble growth. Whereas for the water with the temperature of 100®C, the equilibrium vapour density p,^(100*C) becomes about 46 times its value at is*c, i. e.,
p.^*(100*C)=46xp¥-t(15*C) resulting a large temperature drop,
Ar=13*C
- 2
0-corresponding change rate of the equilibrium vapour pressure Pv„(T) with the tempera ture. The first case is usually referred as Cavitation Bubble, and the second as Boiling
Bubble. Similarly, for collapse process, the internal pressure of a cavitation bubble will
remain basically constant until the final stage of the collapse, whereas for boiling bubble, the vapour pressure will play a much greater role. The dynamics of the cavitation bubble is further briefly introduced as follows.
For the cavitation bubble, the approximations are made that the internal pressure P.(0 is considered as a0 >=P» (' )=constant, the ambient pressure is p_(f )=constant, and the viscous effect is neglected.
Substituting
The above result (Eq. 1.2-34) gives important information of cavitation bubble behaviour as follows.
If the initial pressure, pv, is greater than the ambient pressure p -, the wall velocity,
R, will approach an asymptotic value when the bubble grows to a fairly large size. That is, if p, >p„ and when R » R 0,
This velocity limitation means that all the work performed by the pressure forces, p„ and p _ is transformed into the kinetic energy of the flow.
into the following generalized Rayleigh equation
it can be integrated, yielding the following solution for bubble growth:
where:
If p, <p- and the surface tension is neglected, the bubble will stop growing when it reaches a maximum radius, A?™,,,
K n » .= |l+ -jP ¿ ¿ ( p --p ,)_1j Ko
For the bubble collapse, a similar solution of the generalized Rayleigh equation can be obtained,
<'.J-35)
where:
R, =initial radius from which bubble starts collapsing and at which initial wall velocity equals zero
If the surface tension is neglected, the time required for the complete collapse can be computed from Eq. 1.2-35,
This result is also obtained by Rayleigh.
2 2
-EfTect of Liquid Compressibility
When the collapsing velocity at the final stage of collapse is large enough to com pare with the sound speed in liquid, the compressibility of liquid becomes important and functions in both retarding the collapse velocity and changing the collapsing energy into the acoustic energy emitted outwards in the liquid.
Trilling’s work 1111 considering the liquid compressibility for a gas filled bubble collapse is based on the following assumptions. The liquid with a linear relation between pressure and density is assumed and the velocities are small compared with the sound speed. Then, he used the following acoustic equation as the governing equation for the diverging spherical waves
where:
0=velocity potential
c =sound speed in liquid
This implies that the quantity r*t> is propagated through the liquid with sonic velocity c.
So, his approach is regarded as an acoustic method with first-order correction for compressibility of liquid. Since the shocks are weak ( ^£=0.1 ), he also follows the treat ment that the velocity behind the reflected spherical shock is small compared with the velocity ahead of it and that the gas behind the reflected shock is at sensibly constant density. Based on the above approach, Trilling treated the adiabatic collapse and rebound of a bubble filled with nonconducting nonviscous perfect gas.
2 3
-calculated a bubble collapsing in water under a constant pressure difference, ¿>.-¿>¿*0.517 atm. The result is shown in Figure 1-11, which is compared with the Rayleigh’s incompressible solution and Herring/Trillings’ first-order compressible/acoustic approach. In the Figure, Rayleigh’s result is an incompressible solution for an empty cav ity, Schneider’s result is obtained through the numerical integration to solve the partial differential equations for compressible flows. It has been revealed [3] that when the Mach number is above 0.3, the effect of liquid compressibility becomes remarkably important; when relative radius, reaches to the value o f 0.1, the bubble- wall collapsing velocity calculated through Gilmore’s compressible approach is only 40% of that evaluated by classical hypothesis ( Rayleigh theory ). In Scheider’s numerical computation, he used the incompressible solution at ^=0.08, which was obviously too high, as the initial condition. This is presumably the cause introducing the discrepancy at the range of ^-=0.08-0.02 with the Gilmore’s analytical result as shown in Fig. 1-11.
Gilmore’s analysis neglected the effect of the variation of the gas content on the bubble behaviour, which has the functions of retarding collapse and reducing maximum collapsing velocity ( it will be discussed in following part of this section ). The calcula tion performed by Ross [3] show that only in the rare case in which the partial pressure of gas content Q is lower than 1% of the surrounding pressure P~, i. e., -^2-<0.01, the above effect of the liquid compressibility just becomes significant and not negligible. However, it is just the liquid compressibility that enables the bubble collapsing energy to be par tially changed into the acoustic energy emitting outwards in the liquid.
Effect o f G as Content in Bubble
2 4
-increase of the partial pressure of gas, the kinetic energy of collapsing is partially being changed into the potential energy, in pressure energy form, of the compressed gas result ing in retarding the collapse velocity ( which vanishes at a finite minimum radius of the bubble instead of a complete collapse ); subsequently, the reserved potential energy in compressed gas during the collapse course will causes the successive rebounding and oscillation.
A typical procedure of the collapse and successive rebound of a partially gas filled bubble is shown in Figure 1-12, in which the volume of the cavity on first rebound is about 65% of that of the initial bubble, that is, the total loss of mechanical energy for the first period is about 35% of the total energy due to the dissipation as a shock wave in liquid, viscous friction, entropy increase through the nonreversible processes in the gas or vapour. But, many investigators’ calculations [7] show that for the common case in which the cavitation occurs in a liquid of low vapour pressure and low dissolved gas con tent, the total amount of mass contained in the cavity is capable of storing only a small fraction of the total energy. Practically, the major part of the collapse energy must there fore be stored in the compression of the surrounding liquid. But, if either the vapour pres sure or the gas content in the bubble is high enough, a considerable pan of collapse energy would be stored in the potential energy form by the bubble content and the col lapse pressure would also be reduced accordingly.
L. Rayleigh is the first person who realized the imponant role of gas content in retarding collapse especially for the final stage. He assumed an isothermal process and derived the wall-velocity of collapsing bubble-wall, i. e. Eq.(1.2-16),
where:
2 5
-From Eq.(1.2-16), the minimum value of radius Rmu, is approximated as
(1.2-36) and the corresponding maximum pressure of gas content, p is
(1.2-37) It should be noticed that if the ratio of gas partial pressure Q to infinite pressure /*. becomes too small, for say 2%, the peak value of p, would be over-estimated too much. If
unacceptable |3).
Noltingk and Neppiras [13] improved Rayleigh’s work by assuming an adiabatic process of gas content instead of the assumption of isothermal process which is much closer to the actual gas behaviour especially during the final stage of collapse. The Nol tingk - Neppiras approach is demonstrated by Ross [3] in a more accurate way as fol lows:
Remaining the assumption of an incompressible and inviscous liquid, the general ized Rayleigh equation takes following form
the collapsing velocity and acceleration of the bubble-wall can be respectively calculated as
ji*-=2%, ptJHa, would be over-evaluated as /»-xlO20 which is obviously unpractical and
where:
Q=initial partial pressure of gas content, i.e. gas pressure at R=R0
Y=adiabatic exponent Using the identity
2 6
-and
The minimum radius is
*--*•(
fJ
ht] ^ ' ‘d h i] ^
and, the maximum partial pressure of gas at R=Rm is
Ross (3J calculated the minimum of the radius R ^ against the gas content £ for two
different gases with adiabatic exponents of 1.4 and y=y respectively ( shown in Figure 1-13).
The maximum gas temperature ( Kelvin scale °K ) based on the adiabatic process is
where:
Tosinidal gas temperature, i. e., temperature at R=R0, (**)
Due to the assumption of incompressible liquid, the Noltingk-Neppiras theorem would also over-estimate the temperature and the collapsing velocity. For example, if Q <0.1/*., the maximum temperature of gas content TIJmM^ K ) would exceed one thousand Kelvin.
From Eq.( 1.2-38), the maximum velocity of bubble-wall during collapse is
<>.2-39>
Thus, the maximum Mach number can be evaluated
It has been pointed by Ross [3] that for the cases of ^ 5 . <0.25, i. e.t corresponding to
2 7
-be approximately expressed in terms of the ratio of R ^ to R0 as follows
« „ . ^ 0 . 0 1 5 ^ 1 * (1.2-40) where:
/*-.^surrounding pressure expressed in the unit of atmosphere
Through the investigation of the relation of with -ft-, Ross [3] found that the validity of the assumption of a incompressible liquid mainly depends on the values of
P-a and -fi-. For /»„¿«l, the validity still remains even when the value of -ft- reduces down to 1%; whereas for /*_^=10, -ft->4% is required. For most of the practical cavitation problems, these requirements are met except for some extreme cases in which the gas content is very low. Therefore, the incompressibility assumption is practically accept able.
As has been mentioned before, the function of compressibility is retarding collaps ing, resulting in both the increase of the minimum radius A?™« and the reductions of the maximum collapsing pressure and temperature. Hickling and Plesset [14) made an analysis of a gas bubble collapsing in a compressible liquid using the Gilmore’s approach. It was found that for a given gas, the minimum radius R ^ depends firstly on the ratio of the gas pressure Q to the collapsing pressure /*_, then secondly on the value of /»-. Their results are compared with those from Noltink-Neppiras’ incompressible approach, shown in Table 1-1. It has been shown again that if the ratio of -ft- is greater than 1%, the incompressible results agree quite well with the compressible ones.
Nonspherical Collapsing
2 8
-a nonspheric-al sh-ape.
There arc basically iwo categories of departures from the smooth spherical shape. One is the general deformation of the bubble shape, i. e., the shape just becomes flattened as the bubble collapses in the wall proximity and in the flow field with certain pressure gradient. Usually, the flattened side is at the higher pressure side in the pressure field and/or the off-side to the solid boundary. Sometimes, the flattened side will continue to dimple and to penetrate into and through the cavity, and to form a jet, which is called micro-jet.
This nonspherical behaviour and the formation of jet was firstly assumed by Kom- feld and Suvarov [42] as early as in 1940’s. But, it was about 20 years later that this phenomenon was firstly clearly observed and its mechanism was theoretically explained using the second perturbation approach by Naude and Ellis [15]. From their analytical fluiddynamic analysis ( neglecting gravity and assuming the constant pressure within the hemispherical cavity attached to the solid boundary during collapsing ), a jet velocity in the order of 102—103 feet/sec was predicted. According to the spherical collapse hypothesis, the maximum collapsing pressure of a typical bubble near solid boundary is only about 100 bar which is unlikely to cause damage except for very soft aluminimum. Whereas, the nonspherical collapse hypothesis, i. e., the formation of high speed micro jet, gives a very good explanation why the collapse of a bubble near the solid boundary can cause the damage to the material.
2 9
-cavity due to the asymmetric influence of pressure gradient.
The second sort of nonspherical deformation is the appearance of the irregular sur face at the interface between gas/vapour and liquid. Usually, this is the case of the rebounding bubbles. The formation of the rough surface due to the instabilities of inter face and the sphere ( at the end of the collapse) will disintegrate into a number of smaller bubbles of various sizes and closely neighbouring centres. Plesset has given a detailed discussion on the instability of the plane and curvature interfaces based on Taylor's theoretical analysis. He concludes that when wall radius R becomes very small, the sur face distonion amplitude oscillates at increasing frequency and amplitude, i. e., increas ing instability. Therefore, for the collapsing bubble and the rebounding bubble, the dis tortions are mostly likely to occur at the final stage of collapse and the beginning of the rebound.
1.2.3. Acoustic Emission of Single Bubble
The acoustic emission from the cavitation bubble could be well approximated by the acoustic model where the bubble is treated as a simple sound radiator which has a spherical shape and pulsates in volume producing the acoustic wave transmitting out wards. This approximation is quite close to the actually physical phenomenon because the scale of the acoustic source, i. e., the bubble, is very small compared with the wavelength.
Acoustic Energy
Acconling to sound theory, the emitted acoustic energy £* from a simple acoustic sphere could be expressed in terms of the volumetric acceleration V as well as the acous tic pressure p ( i) , i. e.,
3 0
-V=4r(2/W?j+ä jä)
Emtakes following form
(2RR'+R'RŸ ¿n
The total potential energy E ^ for a collapsing bubble with the initial radius R0 ( i. e., the maximum radius of a growing bubble from the gas nucleus ) is
/^surrounding pressure under which the bubble collapses
The acoustic energy emitted during bubble growth, Einw0ltK,is very small compared with the potential energy £ Usually,
Therefore, the acoustic emission during bubble growth phase is negligible.
The acoustic emission mainly occurs at the collapse stage. The approach evaluating the acoustic energy is suggested [3] based on that the volumetric ( bubble-wall) accelera tion is approximately calculated by Rayleigh’s theory and the minimum radius R ^ is determined by Noltingk-Neppiras theory. Thus,
where:
where:
R
K.
If ^< 10% , considering the maximum velocity of bubble-wall evaluated by Eq.( 1.2-40),