ORIGINAL RESEARCH
BRAIN
Evaluation of Normal Changes in Pons Metabolites due to
Aging Using Turbo Spectroscopic Imaging
A. Yang, X.h. Xiao, and Z.l. Wang
ABSTRACT
BACKGROUND AND PURPOSE: To date, MRS study of both normal and pathologic brains have focused mainly on the supratentorial regions; few studies have investigated the infratentorial regions. However, the pons, an important structure of the brain, is associated with many neurodegenerative diseases and is often damaged by brain trauma. For MRS study of pontine disease, one must obtain MRS reference data on normal metabolite levels in the pons, including data on how these levels vary with age. The aim of this study was to analyze normal, age-related, metabolic changes in the pons by using turbo spectroscopic imaging.
MATERIALS AND METHODS: Seventy-eight healthy subjects with ages ranging from 5 days to 78 years were included in this study. NAA/Cr, Cho/Cr, and Cho/NAA ratios were measured by using turbo spectroscopic imaging. The 78 cases were divided into 4 groups by age: 0 –5, 6 –20, 21–50, and older than 50 years. The metabolite levels were compared with observed age-related changes among the groups.
RESULTS:The normal mean pontine metabolite ratios obtained for the combined age groups were NAA/Cr, 2.44⫾0.45 (mean); Cho/Cr, 1.93⫾0.25; and Cho/NAA, 0.83⫾0.28. Statistically significant differences were found in the NAA/Cr between the 0- to 5- and 6- to 20-year-old groups, and among the 6- to 20-, 21- to 50-, and older than 50-year-old groups. A statistically significant difference was found in Cho/Cr between the 0- to 5- and 6- to 20-year-old subjects; however, no differences were found among the 6- to 20-, 21- to 50-, and older than 50-year-old groups. Statistically significant differences in Cho/NAA were also found among the 4 age groups. The NAA/Cr at birth was low, it rose rapidly at 0 –5 years, reaching a peak at approximately 10 –20 years, and then gradually decreased. The Cho/Cr decreased rapidly at 0 –5 years, then continued to decline, and was stable after 20 years of age.
CONCLUSIONS: Turbo spectroscopic imaging is a good method for analyzing normal changes in the pons metabolites during growth, maturation, and aging.
ABBREVIATION:TSI⫽turbo spectroscopic imaging
P
roton MR spectroscopy of the human brain is being increas-ingly used for both research and clinical applications.1Todate, most spectroscopic studies of both normal and pathologic brains have focused mainly on the supratentorial brain re-gions.2-10In contrast, few studies have investigated the
infraten-torial regions and brain stem.11-13
The pons is part of the brain stem and is an important struc-ture of the human brain. It contains various motor and sensory nuclei and bundles. The upper pons and midbrain tegmentum are
the main components of the ascending reticular activating sys-tem. Many neurodegenerative diseases, such as Parkinson disease and olivopontocerebellar atrophy, are associated with the pons. In addition, as a central axis structure, the pons can be easily dam-aged by brain trauma.13-16
Different brain structures have varying metabolite levels, which change with age.6-8To study pontine diseases, one must
obtain MR spectroscopy reference data on normal metabolite lev-els in the pons, including data on how these levlev-els vary with age. MR spectroscopy studies of the pons have been challenging be-cause the structure is relatively small and surrounded by bones; this anatomy makes it difficult to acquire a homogeneous mag-netic field.
Chemical shift imaging is a multivoxel MR spectroscopy tech-nique that can be used to subdivide the spectral frequency infor-mation from a large MR spectroscopy volume into smaller MR
Received April 20, 2014; accepted after revision May 11.
From the Medical Imaging Center, Affiliated Zhongshan City Hospital of Sun Yat-sen University, Zhongshan City, Guangdong Province, China.
Please address correspondence to Ang Yang, MD, Medical Imaging Center, Affili-ated Zhongshan City Hospital of Sun Yat-sen University, Sun Wendong Rd No. 2, Zhongshan City, Guangdong Province, China; e-mail: [email protected]
spectroscopy volumes within the volume of interest and to obtain the average spectral frequency information within the VOI. A spectroscopic imaging technique called turbo spectroscopic im-aging (TSI) applies fast spin-echo imim-aging to obtain chemical shift imaging data rapidly without the loss of spatial resolution, and it is less sensitive to susceptibility effects.9,10,17In this study,
we aimed to develop a proton MR spectroscopic data base of normal pons metabolite levels in vivo that could be used to study pontine lesions in the future. We applied TSI to measure metab-olite levels in normal pontine tissues and to examine the varia-tions of these levels with age.
MATERIALS AND METHODS
SubjectsSeventy-eight healthy subjects, ranging from 5 days to 78 years of age, underwent TSI. Among these subjects, there were 45 males and 33 females. The subjects were divided into 4 groups by age: 0 –5 (20 cases), 6 –20 (15 cases), 21–50 (21 cases), and older than 50 years (22 cases). For statistical reasons, for subjects younger than 1 year of age, the age in months was divided by 12 and rounded. The inclusion criteria were subjects with no history of neurologic abnormalities and no abnormal findings on routine scans. Permission was granted by the institutional review board of Affiliated Zhongshan City Hospital of Sun Yat-sen University, and informed consent of all subjects or their parents was obtained.
MR Imaging and Data-Processing Methods
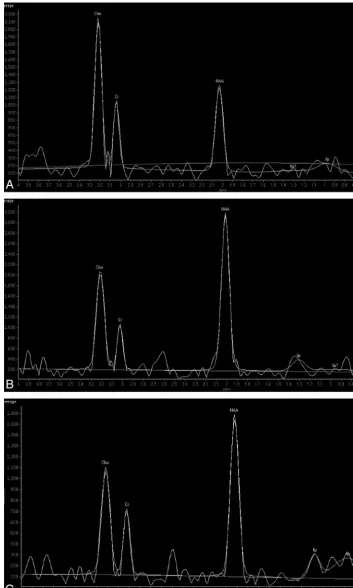
All subjects were scanned in a quiet state and were observed for any movement during the localizing and routine scans. A 1.5T MR imaging scanner (Intera; Philips Healthcare, Best, the Neth-erlands) equipped with a standard 8-channel head coil was used. Conventional transversal and sagittal T2-weighted images were obtained. The scan parameters for TSI were as follows: FOV, 230⫻180 mm; spatial resolution, 1⫻1⫻15 mm; sample, 256; reconstruction matrix, 24⫻24; sensitivity encoding acceleration factor, 2; TSI acceleration factor, 3; TR, 1600 ms; TE, 288 ms. The total TSI scan time was approximately 1 minute 20 seconds. For the scanning positioning methods, the conventional transversal and sagittal T2WI was used as the reference, and the TSI was positioned parallel to the frontal cranial fossa. The collected spec-tral data were transferred to a postprocessing workstation equipped with Achieva software, Version 2.6.3.5 (Philips Health-care). The SpectroView software package was used for data pro-cessing, which involved selecting LongTeBrain_csi, laying out the VOI in the pons with its manual outlining function, and then selecting the “display average.” The average metabolite ratio value for each of the voxels in the VOI was then accessed (Fig 1).
Statistical Analysis
Data are presented as the mean⫾SD for normal data and as the median/quartile for skewed data. For normally distributed data, 1-way analysis of variance was conducted among groups. For skewed data, the nonparametric rank sum test for 2 independent samples was applied. A difference with aPvalue⬍.05 was con-sidered statistically significant. Scatterplots were graphed to observe changes in metabolite levels with age.
RESULTS
For the 78 cases, the mean pontine NAA/Cr was 2.44⫾0.45. The mean choline-containing compounds/Cr in the pons was 1.93⫾ 0.25, and the mean Cho/NAA was 0.83⫾0.28. Figure 2 shows the pons MR spectroscopy results for the different age groups.
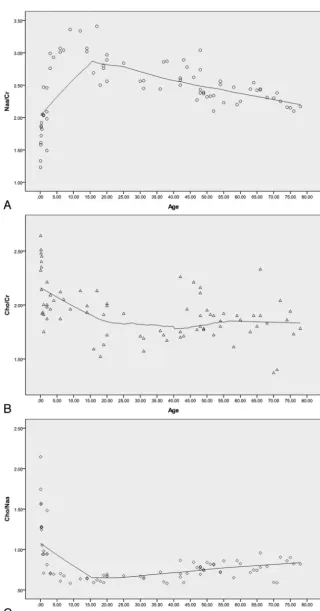
Curve fitting was performed on the NAA/Cr, Cho/Cr, and Cho/NAA scatterplots (Fig 3). The NAA/Cr at birth was low, it rose rapidly at 0 –5 years, reaching a peak at approximately 10 –20 years, and then it gradually decreased (Fig 3). The Cho/Cr de-creased rapidly at 0 –5 years, then continued to decline, and was stable after 20 years of age. The Cho/NAA decreased rapidly at 0 –5 years, then continued to decline, and finally rose after 20 years of age.
The pontine NAA/Cr ratios were compared among the groups of 0 –5, 6 –20, 21–50, and older than 50 years as shown in Table 1. There was no statistically significant difference between the 0- to 5- and older than 50-year-old subjects. In contrast, there were statistically significant differences among the other age groups. Compared with the 0-to 5-year-old subjects, the NAA/Cr was higher in the 6- to 20-year-old subjects. In addition, the NAA/Cr of the older than 50-year group was lower than that in the 21- to 50-year group.
The Cho/Cr ratios of the groups were also compared as shown in Table 2. There were no statistically significant differences among the groups of 6 –20, 21–50, and older than 50 years . There were statistically significant differences between the 0- to 5-year-old group and the other 3 age groups. Compared with the 0- to 5-year-old group, the Cho/Cr was lower in the groups 6 –20, 21– 50, and the older than 50 years. The Cho/Cr ratios were⬎1 in all groups.
The Cho/NAA ratios of the groups were compared as shown in Table 3. There were statistically significant differences among all the groups. Compared with the 0- to 5-year-old group, there was a decline in Cho/NAA in the 6- to 20-year-old group. There was a slow rise in Cho/NAA from 21–50 years to older than 50 years.
DISCUSSION
To develop a proton MR spectroscopic data base of in vivo changes in pons metabolite levels during aging, we used the TSI technique to analyze 78 healthy subjects. These data on normal pontine metabolite levels may be applied in future studies of pon-tine lesions. The results showed that a short TSI scan time could be used to produce good reconstructed spectra for clinical analysis. Our results indicate that the NAA/Cr in the pons rose rapidly in the 0- to 5-year-old group, reached a peak in the 10- to 20-year-old group, and then gradually decreased. The Cho/Cr decreased rapidly in the 0- to 5-year-old group, then continued to decrease, and remained stable after 20 years of age. The Cho/NAA de-creased rapidly in the 0- to 5-year-old group, followed by a decline in the 6- to 20-year-old group, then the ratio slowly rose after 20 years of age.
Currently, MR spectroscopy analysis of normal brain tissue has focused on the frontal, temporal, and occipital lobes, and there are few relevant data for the pons.6This lack of data is due to
for MR spectroscopy because it requires a uniform magnetic field. The TSI technique used in this study provides a solution to the above problems. Unlike ordinary MR imaging techniques that
use frequency and 1 phase direction for spatial encoding, chem-ical shift imaging usually uses 2 phase directions for spatial coding, which leads to a relatively longer acquisition time;
[image:3.594.73.516.50.630.2]faster acquisitions typically require the sacrifice of spatial resolution.10
Compared with a standard 2D point-resolved spectroscopic
sequence, TSI uses an additional 180° pulse (like fast spin-echo) to obtain an additional phase-encoding data-acquisition window, thus reducing the acquisition time. Also like the FSE sequence,
[image:4.594.117.471.47.636.2]with its multiecho technique, TSI is less sensitive to B0 inhomogeneity. Moreover, TSI can be combined with sensitivity en-coding to further shorten the scan time and be more insensitive to susceptibility effects.10,17 The major disadvantage of
TSI is that it sacrifices spectral resolution because there is insufficient time between the 2 successive refocusing pulses to read the signal. However, by using TSI, 4.4-Hz spectral resolution can be obtained on a 1.5T system, which is sufficient to resolve NAA, Cr, Cho, and lactate spectra. How-ever, for short TE metabolites such as glu-tamate and glutamine and myo-inositol, the signal rapidly decays with increasing TE, rendering the long echo spacing (at least 100 ms) of TSI impractical for their detection.9,10In this study, the TSI scan
time was reduced to approximately 1 minute 20 seconds, the baseline of the re-constructed spectrum was flat, the metab-olite peaks were sharp, and the NAA, Cho, Cr spectra were well-resolved.
The levels of various metabolites in the pons vary with age as the human brain undergoes a maturation process. In a ne-onate’s brain, the Cho level is at its high-est, and the NAA level is at its minimum. NAA mainly exists in mature neuronal cells, and its levels rise with the develop-ment of the brain. Cho is the precursor to phosphatidylcholine, which is the main component of cell membranes. During brain development, the maturation of myelin and the synthesis of cell mem-branes cause rapid consumption of Cho, and its level declines.11,18,19The decline of
the Cho/Cr may also be related to the in-crease of Cr after birth, but Cr is mainly stable after the first year of life and can be used as an internal reference.18 In this
study, the NAA levels increased rapidly in the 0- to 5-year-old group and the Cho levels declined rapidly, in support of the above viewpoint. The Cho/Cr value in the pons is relatively high (⬎1). The pons is characterized by a high attenuation of white matter because it contains many as-trocytes and oligodendrocytes, which have a higher Cho content than neurons. This condition is similar to the higher Cho levels observed in the centrum semi-ovale compared with the cortex.12,20,21
A previous MR spectroscopy study on a healthy population of subjects 4 – 88 years of age showed that the NAA/Cho of
[image:5.594.52.373.42.654.2]the white matter in the centrum semiovale increased rapidly in the first decade of life, reached a maximum by the second-to-third decades of life, and then declined steadily.11Although most
mat-uration events in the human brain occur within the first few years of life, the brain is still establishing functional neuronal intercon-nections until puberty, and this maturation process is associated with significant alterations in the biochemical composition of the brain. As an example, the increase in the number of neuronal cells in the centrum semiovale reaches its peak by approximately 6 months after birth, but maturational changes continue to occur after infancy, with significant increases in the number and size of axonal and dendritic fluctuations.8,11In this study, the NAA and
Cho levels in the pons reached a relatively stable phase by 10 –20 years of age, which may correspond to the full maturation of the pons. NAA/Cr continued to decline in the 21- to 50- and the older than 50-year-old groups. This change implies that NAA decreases gradually after puberty. There were few changes in the Cho/Cr among the groups of 6 –20, 21–50, and older than 50 years, im-plying that Cho is relatively stable after puberty. This result is similar to that reported previously by Moreno-Torres et al.13The
reduction in the level of NAA may be due to diminished neuronal attenuation and/or neuronal loss in the aged brain and also a
diminished concentration of NAA in neurons.21With the
excep-tion of neurons, Cho is widely present in various types of cells, particularly glial cells, which undergo less dramatic changes with aging than neurons. The minimal changes in Cho levels after pu-berty may also be explained by the release of Cho compounds related to membrane breakdown during the aging process.13,21
There are some limitations of this study. First, the population sample enrolled in this study was relatively small, and more data should be collected in future studies to correct possible bias. How-ever, the age range examined in this study was wide, with subjects from 0 to 78 years of age. In particular, we examined subjects during the first 5 years of life, which is a critical period for the developing brain, despite the difficulty in collecting data from children without sedation. Second, the regions of interest in TSI do not cover the whole pons. We attempted using 3D MR spec-troscopy but the time required was not acceptable and the larger coverage to include the lower parts of the pons caused more dif-ficulty in shimming. Therefore, we chose the region of interest covering as much of the pons as possible.
CONCLUSIONS
Our findings indicate that TSI is an appropriate method for de-tecting changes in metabolites in the pons. We observed signifi-cant alterations in NAA/Cr and Cho/Cr in the pons in the 0- to 5-year-old group and noted that these ratios reached a plateau by 20 years of age, which may correspond to the maturation of the pons. After 20 years of age, the NAA/Cr decreased slowly and the Cho/Cr was relatively stable. These data may serve as a basis for studies of normal human neurochemistry and studies of meta-bolic alterations in diseases of the pons.
REFERENCES
1. Soares DP, Law M.Magnetic resonance spectroscopy of the brain: review of metabolites and clinical applications.Clin Radiol2009; 64:12–21
2. Tedeschi G, Bertolino A, Massaquoi SG, et al.Proton magnetic res-onance spectroscopic imaging in patients with cerebellar degener-ation.Ann Neurol1996:39:71–78
3. Pouwels PJ, Frahm J.Regional metabolite concentrations in human brain as determined by quantitative localized proton MRS.Magn Reson Med1998;39:53– 60
4. Hetherington HP, Pan JW, Mason GF, et al.Quantitative 1H spec-troscopic imaging of human brain at 4.1 T using image segmenta-tion.Magn Reson Med1996;36:21–29
5. Michaelis T, Merboldt KD, Bruhn H, et al.Absolute concentrations of metabolites in the adult human brain in vivo: quantification of localized proton MR spectra.Radiology1993;187:219 –27
6. Haga KK, Khor YP, Farrall A, et al.A systematic review of brain metabolite changes, measured with 1H magnetic resonance spec-troscopy, in healthy aging.Neurobiol Aging2009;30:353– 63 7. Chang L, Ernst T, Poland RE, et al.In vivo proton magnetic
reso-nance spectroscopy of the normal aging human brain.Life Sci
1996;58:2049 –56
8. Saunders DE, Howe FA, van den Boogaart A, et al.Aging of the adult human brain: in vivo quantitation of metabolic content with pro-ton magnetic resonance spectroscopy. J Magn Reson Imaging
1999;9:711–16
9. Yahya A, Fallone BG.Detection of glutamate and glutamine (Glx) by turbo spectroscopic imaging.J Magn Reson2009;196:170 –77 10. Martin AJ, Liu H, Hall WA, et al.Preliminary assessment of turbo
[image:6.594.54.286.58.122.2]spectroscopic imaging for targeting in brain biopsy.AJNR Am J Neuroradiol2001;22:959 – 68
Table 1: Comparison of NAA/Cr among different age groups
Age
Groups (yr) Mean No. PValue
0–5 2.14⫾0.25 20 .001,a⬍.001b
6–20 1.90⫾0.20 15 .468,c.261d
21–50 1.85⫾0.19 21 .665e
Older than 50 1.82⫾0.20 22 ⬍.001f
a
Comparison between 0 to 5- and 6 to 20-year-old subjects.
b
Comparison between 0 to 5- and 21 to 50-year-old subjects.
c
Comparison between 6 to 20- and 21 to 50-year-old subjects.
d
Comparison between 6 to 20- and older than 50-year-old subjects.
e
Comparison between 21 to 50- and older than 50-year-old subjects.
f
[image:6.594.54.285.197.262.2]Comparison between 0 to 5- and older than 50-year-old subjects.
Table 2: Comparison of Cho/Cr among different age groups
Age
Groups (yr) Mean No. PValue
0–5 2.14⫾0.25 20 0.001,a⬍.001b
6–20 1.90⫾0.20 15 0.468,c.261d
21–50 1.85⫾0.19 21 .665e
Older than 50 1.82⫾0.20 22 ⬍.001f
aComparison between 0 to 5- and 6 to 20-year-old subjects. b
Comparison between 0 to 5- and 21 to 50-year-old subjects.
cComparison between 6 to 20- and 21 to 50-year-old subjects. d
Comparison between 6 to 20- and older than 50-year-old subjects.
eComparison between 21 to 50- and older than 50-year-old subjects. f
Comparison between 0 to 5- and older than 50-year-old subjects.
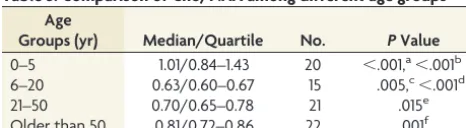
Table 3: Comparison of Cho/NAA among different age groups
Age
Groups (yr) Median/Quartile No. PValue
0–5 1.01/0.84–1.43 20 ⬍.001,a⬍.001b
6–20 0.63/0.60–0.67 15 .005,c⬍.001d
21–50 0.70/0.65–0.78 21 .015e
Older than 50 0.81/0.72–0.86 22 .001f
a
Comparison between 0 to 5- and 6 to 20-year-old subjects.
b
Comparison between 0 to 5- and 21 to 50-year-old subjects.
c
Comparison between 6 to 20- and 21 to 50-year-old subjects.
d
Comparison between 6 to 20- and older than 50-year-old subjects.
e
Comparison between 21 to 50- and older than 50-year-old subjects.
f
[image:6.594.53.286.337.401.2]11. Kadota T, Horinouchi T, Kuroda C.Development and aging of the cerebrum: assessment with proton MR spectroscopy.AJNR Am J Neuroradiol2001;22:128 –35
12. Jacobs MA, Horska´ A, van Zijl PC, et al.Quantitative proton MR spectroscopic imaging of normal human cerebellum and brain stem.Magn Reson Med2001;46:699 –705
13. Moreno-Torres A, Pujol J, Soriano-Mas C, et al.Age-related meta-bolic changes in the upper brainstem tegmentum by MR spectros-copy.Neurobiol Aging2005;26:1051–59
14. Carpentier A, Galanaud D, Puybasset L, et al.Early morphologic and spectroscopic magnetic resonance in severe traumatic brain inju-ries can detect “invisible brain stem damage” and predict “vegeta-tive states.”J Neurotrauma2006;23:674 – 85
15. Paus T.Functional anatomy of arousal and attention systems in the human brain.Prog Brain Res2000;126:65–77
16. Young GB, Pigott SE.Neurobiological basis of consciousness.Arch Neurol1999;56:153–57
17. Duyn JH, Moonen CT.Fast proton spectroscopic imaging of human brain using multiple spin-echoes.Magn Reson Med1993;30:409 –14 18. Dezortova M, Hajek M.1H MR spectroscopy in pediatrics.Eur J
Radiol2008;67:240 – 49
19. Urenjak J, Williams SR, Gadian DG, et al.Specific expression of N-acetylaspartate in neurons, oligodendrocyte-type-2 astrocyte pro-genitors, and immature oligodendrocytes in vitro. J Neurochem
1992;59:55– 61
20. Branda˜o LA, ed.MR Spectroscopy of the Brain.Philadelphia: Lippin-cott Williams & Wilkins; 2003:10