Abstract—The purpose of this study is to suggest an appropriate menu structure of IVIS, to be implemented on the instrument cluster panel, using Taguchi’s parameter design.
The research consists of three steps: (1) select a set of functions that are appropriate to control through the instrument cluster among existing functions of current IVISs by quantitative evaluation of ergonomic principles; (2) extract menu structure alternatives by investigating priorities to those functions selected; and (3) evaluate menu structure alternatives through an experiment and suggest the most appropriate one by applying Taguchi’s parameter design. Taguchi method plays a significant role in this research in terms of planning an experiment and evaluating alternatives. The experiment was structured as Taguchi method suggested, i.e., the use of inner and outer arrays.
SN ratios were calculated and evaluated for all alternatives in order to find the most proper one. The most appropriate menu structure for the instrument cluster IVIS was finally suggested among the alternatives and the usefulness of Taguchi’s parameter design was discussed. It is expected that the results of this research could provide a guideline to the instrument cluster IVIS and Taguchi’s parameter design could be suggested as an effective method for evaluating menu design alternatives.
Index Terms—Driver information system, Driver performance, Menu structure design, Taguchi parameter design
I. INTRODUCTION
As electronic technologies evolve, the number of functions to be implemented on vehicles has drastically increased, so has the number of functions of the IVIS (In-Vehicle Information System). Automobile manufacturers around the world put more emphasis on how to easily and efficiently control those highly sophisticated functions, despite inevitably increasing drivers‟ workload[1][4].
The main stream of recent IVIS design largely consists of a display located in the upper dashboard or central center fascia, and a controller set on the center console or center fascia, especially in high grade vehicles of the passenger car segment.
However, these IVISs cause the driver serious performance degradations in terms of driver‟s visual and motor distractions.
In a normal driving posture, the location of the display is not Manuscript received December 24, 2009.
Seung P. Hong is with the Korea University, Department of Information Management and Security, Seoul, South Korea (corresponding author to provide phone: 010-2720-4256; e-mail: honganim@ korea.ac.kr).
Eui S. Jung is with the Korea University, Division of Information Management Engineering, Seoul, South Korea (e-mail: [email protected]).
Jaeho Choe is with the Daejin University, Department of Industrial Management Engineering, Pocheon, South Korea (e-mail:
Jae H. Kim is with the Korea University, Department of Information Management and Security, Seoul, South Korea (e-mail:
near the line of sight or within the main visual field. Also, the controller may not be blindly controlled even when it is located on the center console. Such difficulties often cause intense workload to drivers. Thus, there have been a few attempts to develop a new type of IVIS which displays the information on the instrument cluster with a full scale LCD panel and places the controller on the steering wheel in order to keep driver‟s attention as close as possible. Although there are several studies on designing of an ergonomically sound menu interface for the prior type of IVIS [5], the new type of IVIS has not been fully researched. Therefore, a design guideline to the menu structure of the new type of IVIS is in need to provide a proper menu interface.
Reference [2] shows that it is hardly valid to apply existing menu structuring guidelines to the development of a new menu structure under the situation where there is a spatial restriction on the display and input device such as the ones in mobile devices and the level of breadth and depth of a menu must be carefully determined through a series of experiments and simulations to guarantee effective control of the menu.
In this research, several levels of the breadth and depth of IVIS menu were studied to find the most appropriate one for drivers. First, a set of functions which can be manipulated on the instrument cluster IVIS was determined and then those functions were used to structure menu alternatives which have various levels of breadth and depth.
In order to find the best menu structure of an IVIS, multivariate statistical analyses are often used for the experimental data acquired from the settings that simulate the use of the system while driving. However, situations that the driver encounters or the designer must consider while using the system greatly vary, so does the driver‟s workload.
Although statistical analyses are theoretically valid in identifying the differences among alternatives even when the sources of variations are great, those methods have a limitation in finding the most robust alternative under greatly varying situations. In this research, Taguchi‟s parameter design was used as a method to both usability testing of alternatives and finding of the most robust one. In other words, the purpose of Taguchi method is to find a robust one apart from effects of multiple noises factors. Especially, it is expected to be useful in this type of research that finds the breadth and depth of a menu, independent of driver‟s varying workload from diverse driving conditions.
II. RESEARCH METHODS
The main goal of Taguchi‟s parameter design is designing or improving a product‟s quality or characteristic robust to certain noises such as changing environment, superannuated
Design of a Menu Structure for the Instrument Cluster IVIS using Taguchi Method
Seung P. Hong, Eui S. Jung, Jaeho Choe, Jae H. Kim
components, and incomplete manufacturing [10]. This method has been mainly used in manufacturing factory in order to maintain low error rates for quality control. However, this method that allows finding of sturdy design parameters regardless of noise factors has a potential to be employed in other areas beyond production line.
In actual driving situations where the driver uses IVIS placed on the instrument cluster, every road condition and a series of functions that the driver choose will be different trial by trial. These changing environments and functions are critical elements which have a strong effect on driver‟s workload, while the experimenter or designer of IVIS has no control over those elements‟ effects [9].
In this research, those two elements, road condition and driver‟s task, are chosen as noise factors of Taguchi‟s parameter design, located in outer array. In inner array of Taguchi design, the breadth of IVIS menu and the location of menu on the instrument cluster are located as design factors of Taguchi‟s parameter design. Then, SN (Signal to Noise) ratio was calculated for every alternative and the most robust alternative was selected based on comparing SN ratios, as suggested.
III. DERIVATION OF MENU ALTERNATIVES
Prior research on menu‟s breadth and depth focuses mainly on finding a better alternative between narrow-deep and broad-shallow menus in a hierarchical structure. However, those studies have certain limitation in applying the results of those studies directly to real products because a rectangular form of menu structure such as 4x6, 6x2 and 8x3 forms are hardly practical. Most menu of actual products usually have various depths within each branch. So, the functions adequate to control in an instrument cluster IVIS were first derived in order to find alternatives that could directly apply to actual products. Then, priorities were given to those functions through a survey and menu alternatives were defined based on the breadth level of the menu according to the priorities.
A. Selecting functions for menu alternatives
First, all the potential functions being used in passenger cars were first collected through a survey of existing IVISs of passenger cars in cooperation with car manufacturers in Korea.
Second, selected functions were categorized by three exclusive characteristics, as listed in Table 1. As shown in Fig.
1, functions in each category were then evaluated quantitatively by ergonomic criteria [7].
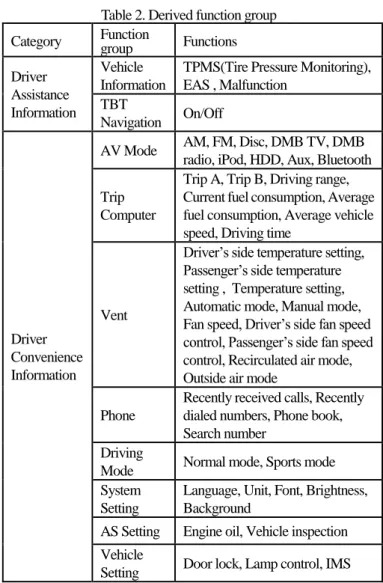
Based on the scores calculated by the quantitative analysis, the functions to be implemented in the instrument cluster IVIS were finally obtained and redefined again in detail. Table 2 shows a total of 46 functions. No function from the category of safety specific information was included in finally selected functions through the evaluation.
B. Determining function priority
Finally, 46 functions selected were grouped by 10 groups:
Vehicle information, TBT(Turn by Turn) navigation, AV mode, Trip computer, Vent, Phone, Driving mode, System setting, AS setting, and Vehicle setting. A survey were conducted to determine the priority of those groups which set the order of each group to be the first level of menu hierarchy
according to the number of breadth (as menu alternatives). In the survey, subjective estimations of the frequency of use for each group were asked in 9-point scale to twenty voluntary respondents (20 to 30 years of age, 12 men and 8 women).
According to the result of survey in Fig. 2, a group which obtained higher frequency and preference scores was given higher priority to be included in the first level of menu hierarchy.
Table1. Function classification criteria Category Evaluation criteria
Safety Specific Information
- Required response time - Degree of potential danger if misinterpreted
- Control usability of related function Driver
Assistance Information
- Frequency of use - Utility of function
- Degree of potential danger if misinterpreted
Driver Convenience Information
- Frequency of use - Level of convenience
- Degree of potential inconvenience if misinterpreted
Table 2. Derived function group Category Function
group Functions Driver
Assistance Information
Vehicle Information
TPMS(Tire Pressure Monitoring), EAS , Malfunction
TBT
Navigation On/Off
Driver Convenience Information
AV Mode AM, FM, Disc, DMB TV, DMB radio, iPod, HDD, Aux, Bluetooth Trip
Computer
Trip A, Trip B, Driving range, Current fuel consumption, Average fuel consumption, Average vehicle speed, Driving time
Vent
Driver‟s side temperature setting, Passenger‟s side temperature setting , Temperature setting, Automatic mode, Manual mode, Fan speed, Driver‟s side fan speed control, Passenger‟s side fan speed control, Recirculated air mode, Outside air mode
Phone
Recently received calls, Recently dialed numbers, Phone book, Search number
Driving
Mode Normal mode, Sports mode System
Setting
Language, Unit, Font, Brightness, Background
AS Setting Engine oil, Vehicle inspection Vehicle
Setting Door lock, Lamp control, IMS
Fig.1. An example of quantitative evaluation criteria: Driver assistance information
Fig.2. Result of a survey: estimation of frequency of use for 10 function groups
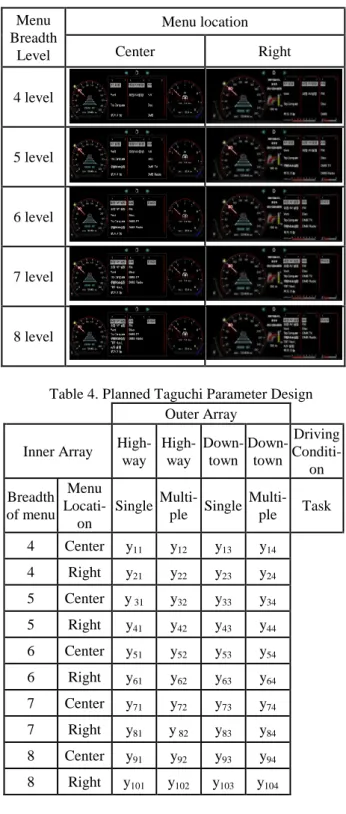
C. Determining the breadth level of menu alternatives In this research, each level (number) of breadth becomes a menu alternative. The size of instrument cluster used in the experiment is 110mm which is commonly used in commercial vehicles, and font size and line spacing were determined to 8mm and 4mm respectively in order to guarantee the readability [8]. According to those dimensional limitations, the maximum level of breadth was fixed to 8.
Reference [3] recommended a broad-shallow menu over a narrow-deep menu. Menu alternatives in which the breadth level is less than 3 has more than 7 levels of depth, which is too much in terms of keystrokes to reach a function of interest.
Thus, the number of menu alternatives or breadth level was determined to be 4 to 8 for experimental purpose. For each level of breadth being each menu alternative, the same number of groups with the highest priority was selected. The functions of the rests of groups were included to other first level groups by its similarity.
D. Determining the location of display on the instrument cluster
Location of display is a matter of decision on the part of vehicle manufacturers. In this research, two locations on the display were chosen: center and right side. The center of instrument cluster is commonly used in current commercial vehicles. The right side location was also chosen because the compatibility of display and control in higher. In this research, the control was assumed to be mounted on the right side of steering wheel for allowing drivers to manipulate complex control with their right hand, since right-handed people and right-hand side driving are a majority.
IV. EXPERIMENT A. Apparatus
Apparatus for the environment consisted of a seating buck including pedals, a beam projector, 19 inch LCD monitor(SAMSUNG 19N-KSA), and a steering wheel with four-directional keypad mounted on the right side. Two different driving videos were used: downtown and highway.
Menu alternatives on the instrument cluster were made by Adobe Flash 8.0. An experimental setting was shown in Fig.
3.
B. Design of experiment
Following the Taguchi Parameter Design, two design factors, menu breadth level and menu location, were set to the inner array. In the outer array, driving condition and complexity of menu control task were set as noise factors, which can affect the driver‟s workload but cannot be controlled by designers of IVIS. The level of two design factors was 5 x 2 (five levels for menu breath level and two levels for menu location respectively). The driving condition had two levels of highway and downtown driving conditions and the menu control task also had two levels: single and multiple tasks. An example of the single task was; “Choose Track 10 in CD 4.” An example of the multiple task was;
“Reset average fuel consumption in trip computer, Select Track 18 from external HDD, and Dial „Hong‟ from the phone book.” Downtown driving and multiple task were assumed to be more demanding to the driver.
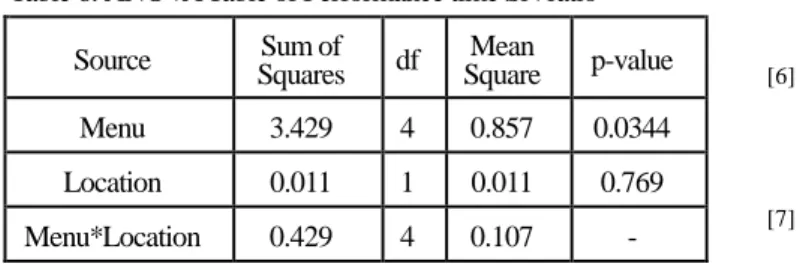
Objective measure used in this research was the task completion time that was recorded automatically by the computer program. The experimental design was a within-subject design and all alternatives were presented to the subject randomly. Table 4 shows the planned parameter design suggested by Taguchi. Twenty subjects whose ages ranged from 20 to 30 with an average of 26 participated in the experiment on a voluntary basis. Their average year of driving was 3.42.
Fig.3. an experimental setting using a seating buck
C. Procedure
Subjects were asked to seat on the seating buck and to drive using the steering wheel and pedals following the driving video clips which were presented on the wall in realistic size.
While performing driving tasks, they performed menu control tasks with a 4-directional keypad mounted on the steering wheel. Menu alternatives and tasks were randomly balanced and training sessions were given to each subject to get familiarized with the new type of control and display.
V. RESULT
In this research, Taguchi‟s parameter design was used to plan and to analyze the data in order to find the most robust
alternative from noise factors which emerge in driving situations. Reference [7] suggested a procedure for designing the parameter design.
1. After designing an experiment, repeatedly obtain observed values for each experimental condition
2. Calculate SN ratios, according to the situation suggested by Taguchi: larger the better, smaller the better or On-target from repeatedly observed values
3. Find significant design factors by the analysis of variance of SN ratios
4. Find the optimal level of design factors being the combination that creates the largest SN ratio
5. Perform another confirmation experiment in that level, if the optimal level cannot be attained from the experiment
Since the completion time is a „smaller the better‟ attribute, the following equation is used to calculate the SN ratio. Table 5 shows the Taguchi‟s parameter design with calculated SN ratios for the completion time.
1 ) log{
10
1
2
n
j
i yij
SN n
where yij is an observed data in i-th row and j-th column, and n is the number of repetition in one experimental point.
Analysis of variance was then performed to see the power of influence of design factors. The result of ANOVA is shown in Table 6. Since ANOVA of SN ratio had no repetitions, an interaction between menu and location was pooled to the error term, p-values were then calculated. Menu breadth level was derived as a significant design factor and the breadth level of 7 was shown to be the smallest completion time according to the SN ratio
Table 3. Menu alternatives Menu
Breadth Level
Menu location
Center Right
4 level
5 level
6 level
7 level
8 level
Table 4. Planned Taguchi Parameter Design Outer Array
Inner Array High- way
High- way
Down- town
Down- town
Driving Conditi-
on Breadth
of menu Menu Locati-
on
Single Multi-
ple Single Multi- ple Task 4 Center y11 y12 y13 y14
4 Right y21 y22 y23 y24 5 Center y 31 y32 y33 y34 5 Right y41 y42 y43 y44 6 Center y51 y52 y53 y54
6 Right y61 y62 y63 y64 7 Center y71 y72 y73 y74 7 Right y81 y 82 y83 y84 8 Center y91 y92 y93 y94 8 Right y101 y102 y103 y104
Table 5. Taguchi‟s parameter with calculated SN ratios for the completion time
Outer Array
Inner Array
1 1 2 2
1 2 1 2 SN
Ratio 1 1 10.58 14.79 31.72 46.03 -29.36 1 2 10.62 14.97 32.51 44.19 -29.23 2 1 10.75 14.37 34.73 42.91 -29.25 2 2 11.09 14.12 31.29 40.24 -28.63 3 1 9.43 12.01 32.55 40.49 -28.65 3 2 9.18 11.60 29.82 39.87 -28.29 4 1 8.38 12.17 28.36 33.55 -27.30 4 2 8.94 11.84 28.44 37.29 -27.82 5 1 8.81 11.33 30.18 39.72 -28.28 5 2 9.17 11.81 29.87 41.92 -28.56 Total=-285.38
VI. DISCUSSION AND CONCLUSION
The main purpose of this research was to suggest the most appropriate menu alternatives for the new type of IVIS, which is consisted of a display on the instrument cluster and a controller on the steering wheel. Ten menu alternatives which had five breadth levels and two locations with a 4-directional controller mounted on the steering wheel were manufactured for the experiment. The experiment had two tasks. Primary task was driving task and subjects were asked to control the steering wheel and pedals following the road video clips.
Secondary task was using IVIS with the 4-directional controller. Task completion times as an objective measure were recorded by computer programming.
Menu breadth level was a significant factor for IVIS menu and the breadth level of 7 was chosen to be the most proper one in terms of task completion time. Although the menu location was determined to be no significant factor, center location showed a better performance
Although the menu breadth level of 7 presents much of information, it was derived as the most proper alternative.
This may be mainly because traversing down too deep in the menu hierarchy costs more workload to drivers than showing more information in a single level. Although going down 7 levels does not violate the Miller‟s magic number 7±2, it is too time-consuming and too complex to comprehend.
Existing IVIS design guidelines suggest normally around 5 levels of breadth. There might be two reasons for it. The location of the display and the control of this IVIS system might allow drivers to control the system with less workload because it reduced the dispersion of eye sight and distance of hands movement. It is possible to assume that the original purpose of the new type IVIS was successfully achieved at this point. Second reason might be largely due to subjects who participated in the experiments. Most subjects were mid-20s to early 30s who were extremely used to control electronic devices and controller. Because of their skilled hands and multitasking ability, more complex menus on the screen could be processed without much difficulty.
REFERENCES
[1] A. Stevens, A. Quimby, A. Board, T. Kersloot, P. Burns, “Design Guidelines for Safety of In-Vehicle Information Systems”, Transport Research Laboratory PA3721/01, 2002.
[2] Kyung J. Cho, Hyang Choi, Kwang H. Han, “Efficient Menu Structure on Mobile Display – focus on depth level, number of items”, Korean Journal of Cognitive Science Vol18, No. 2, 193~221, 2007.
[3] D. Wagner, J. A. Birt, M. Snyder, J. P. Duncanson, “HUMAN FACTORS DESIGN GUIDE(HFDG) For Acquisition of Commercial Off-The-Shelf Subsystems, Non-Developmental Items, and Developmental Systems”, U.S. Department of Transportation Federal Aviation Administration Technical Center, 1996.
[4] Eui S. Jung, “Development guideline of Next Generation IVIS interface”, Hyundai Motor Company Technical Report, 2005.
[5] Hyung U. Lim, Eui S. Jung, Sungjoon Park, Seong W. Jeong,
“Comparisons of Driver Performance with Control Types of the Driver Information System”, Journal of The Society of Korea Vol.26, No. 1 pp.1-10, 2007.
[6] V.L. Neale, T.A. Dingus, A.D. Schroeder, S. Zellers, S. Reinach,
“Development of human factors guidelines for advanced traveler information systems(ATIS) and commercial vehicle operations(CVO):
Investigation of user stereotypes and preferences”, Virginia Tech Transportation Inst., Blacksburg, VA, 1999.
[7] Sung H. Park, Quality Engineering focus on Taguchi method and statistical process control, Minyoungsa, 1997.
[8] P. Green, W. Levison, G. Paelke, C. Serafin, “Suggested Human Factors Design Guidelines for Driver Information Systems. (Technical Report UMTRI-93-21)”, the University of Michigan Transportation Research Institute, 1993.
[9] B. Peacock, W. Karwowski, Automotive Ergonomics, London, 1993 [10] Bong J. Yeom, Byeong Y. Lee, Seon U. Go, Jae H. Kim, “Principles for
Constructing Taguchi Experimental Designs”, Korean Journal of Applied Statistics, Vol4. Issue 1, pp. 47 ~ 47, 1991.
Table 6. ANOVA Table of Performance time SN ratio Source Sum of
Squares df Mean
Square p-value
Menu 3.429 4 0.857 0.0344
Location 0.011 1 0.011 0.769
Menu*Location 0.429 4 0.107 -