ISSN Online: 2158-2750 ISSN Print: 2158-2742
DOI: 10.4236/ajps.2017.813224 Dec. 14, 2017 3324 American Journal of Plant Sciences
Adaptability, Stability and Multivariate
Selection by Mixed Models
Alan Junior de Pelegrin
1, Ivan Ricardo Carvalho
1, Andrei Caíque Pires Nunes
2,
Gustavo Henrique Demari
1, Vinicíus Jardel Szareski
1,
Mauricio Horbach Barbosa
3,
Tiago Corazza da Rosa
1, Mauricio Ferrari
1, Maicon Nardino
1,
Osmarino Pires dos Santos
1, Marcos Deon Vilela de Resende
2, Velci Queiróz de Souza
4,
Antonio Costa de Oliveira
1, Luciano Carlos da Maia
11Federal University of Pelotas, Center of Genomics and Plant Breeding, Avenida Eliseu Maciel,
Capão do Leão, Brazil
2Federal University of Viçosa, Center of Exact and Technological Sciences, Viçosa, Brazil 3Federal University of Santa Maria, Frederico Westphalen Campus, Frederico Westphalen, Brazil 4Federal University of Pampa, Campus Dom Pedrito, Bagé, Brazil
Abstract
The aim of this work was to estimate the adaptability and stability of grain yield per hectare and percentage of crude protein of maize grains combined in an index, and to establish a multicharacter selection through mixed models based on an objective character and 15 auxiliary traits. The trials were con-ducted in the 2013/2014 agricultural year in four growing environments of the Rio Grande do Sul, BR state. The experimental design was randomized blocks arranged in a factorial scheme, being four growing sites × 15 single cross ma-ize hybrids, arranged in three repetitions. The genotypic index, composed by the grain yield and the crude protein percentage in the grains, is the best se-lection strategy to achieve maize superior genotypes. The multivariate geno-types selection, considering grain yield and crude protein, is efficient. The genotypes FORMULA TL®, AS1656PRO®, P30F53Hx®, LG6304YG® and 30F53 are more adapted and stable for grain yield and percentage of crude protein, in the conditions of this study. The mixed models were efficient to employ the multicharacter selection and to contribute for maize genetic breeding.
Keywords
Plant Breeding, Zea mays L., Phenotypic Index, Genetic Parameters, Multicharacter
How to cite this paper: de Pelegrin, A.J., Carvalho, I.R., Nunes, A.C.P., Demari, G.H., Szareski, V.J., Barbosa, M.H., da Rosa, T.C., Ferrari, M., Nardino, M., dos Santos, O.P., de Resende, M.D.V., de Souza, V.Q., de Oliveira, A.C. and da Maia, L.C. (2017) Adaptability, Stability and Multiva-riate Selection by Mixed Models. American Journal of Plant Sciences, 8, 3324-3337. https://doi.org/10.4236/ajps.2017.813224
Received: September 27, 2017 Accepted: December 11, 2017 Published: December 14, 2017
Copyright © 2017 by authors and Scientific Research Publishing Inc. This work is licensed under the Creative Commons Attribution International License (CC BY 4.0).
http://creativecommons.org/licenses/by/4.0/
DOI: 10.4236/ajps.2017.813224 3325 American Journal of Plant Sciences
1. Introduction
Maize (Zea mays L.) is one of the most produced cereals in the agribusiness sce-nario. Its importance is justified because of the wide utilization in animal nutri-tion, with 70% of the production in the form of silage or feed formulanutri-tion, and even ethanol production in some countries such as USA [1]. The maize cultiva-tion covers a wide range of growing environments. However, the genotypes may present differential behaviors as function of the environment modifications known as genotype environment interaction (G × E). The G × E interaction causes implications for breeding programs of any species, since the evaluation or recommendation of cultivars. Therefore, the study of this interaction is ex-tremely important in order to find alternatives to minimize its effects, mainly by identifying genotypes highly responsive to environmental improvement, which are characterized by broad adaptability, predictable behavior and good stability [2].
Currently, breeding programs seek to identify high yielding genotypes, and posteriorly target their selection strategies in the quality of the grains, thus, the search for the ideal genotype that gathers productive and qualitative superiority demands elevated financial and labor resources of the breeding program, as well as suitable selecting strategies [3] [4] [5] [6]. An alternative to minimize this ob-stacle is the multivariate selection, which aims to select a set of simultaneous traits. In this way, the selection index proposed [7] [8] is used, which consists of a linear function of the predicted phenotypic or genotypic values of the charac-teristics pondered by estimated coefficients in order to maximize the correlation between the index and the true genetic values [9]. Therefore, genetic gain may be maximized when compared to direct selection, or selection individually per-formed for each trait [10]. The selection indexes have been successfully used in species of agronomic interest such as popcorn [11] [12], baby-corn and green corn [13]. However, there are few studies involving the selection of maize geno-types with high grain yield and protein content simultaneously.
Given the lack of information regarding multivariate selection in maize, this work aimed to estimate the adaptability and stability of grain yield per hectare and percentage of crude protein of maize grains combined in an index, and to establish a multicharacter selection through mixed models based on an objective character and 15 auxiliary traits.
2. Materials and Methods
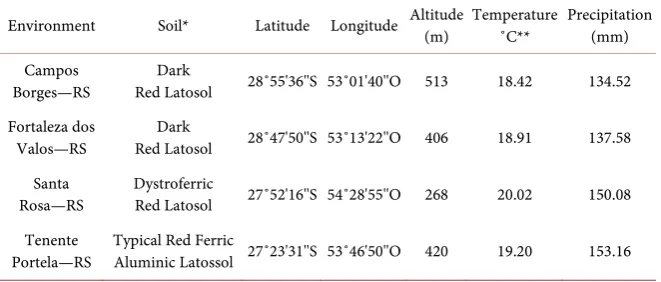
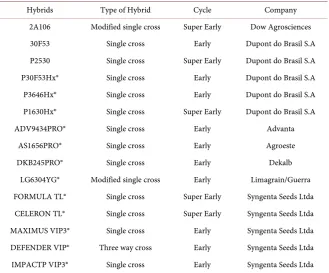
The trials were conducted in the 2013/14 agricultural year, in four growing en-vironments of the Rio Grande do Sul-BR state (Table 1). The climate for all growing environments is classified by Köppen as Cfa subtropical [16]. The expe-rimental design was randomized blocks arranged in a factorial scheme, being four growing environments × 15 single cross maize hybrids, arranged in three repetitions. The genotypes used were: 1) 2A106, 2) 30F53, 3) P2530, 4)
ADV9434PRO®, 5) AS1656PRO®, 6) DKB245PRO®, 7) LG6304YG®, 8)
DOI: 10.4236/ajps.2017.813224 3326 American Journal of Plant Sciences Table 1. Description of growing environments regarding soil type, geographic coordi-nates, altitude, temperature and precipitation.
Environment Soil* Latitude Longitude Altitude (m) Temperature ˚C** Precipitation (mm)
Campos
Borges—RS Red Latosol Dark 28˚55'36''S 53˚01'40''O 513 18.42 134.52 Fortaleza dos
Valos—RS Red Latosol Dark 28˚47'50''S 53˚13'22''O 406 18.91 137.58 Santa
Rosa—RS Dystroferric Red Latosol 27˚52'16''S 54˚28'55''O 268 20.02 150.08 Tenente
Portela—RS Typical Red Ferric Aluminic Latossol 27˚23'31''S 53˚46'50''O 420 19.20 153.16
*Soil Classification [14]. **Historical averages of temperature and precipitation [15].
13) MAXIMUS VIP3®, 14) DEFENDER VIP® and 15) IMPACTP VIP3® (Table
2).
The experimental units were composed by four lines of five meters length, spaced 0.5 meters, totalizing 10 m2 [17]. No-tillage system was used for all growing environments, with population of 80 thousand plants per hectare. It was used 300 kg∙ha−1 of NPK in the formula (10-20-20) as base fertilization, and 135 kg∙ha−1 of N in the amidic form as topdressing, applied at V
4 and V6 vegetative stages. The management of weeds, pest and diseases were carried out preven-tively, in order to reduce interferences in the experiment’s results.
The traits of interest were measured in the useful area of each experimental unit, which was composed by two central lines, discarding 0.5 m of each edge. The measured traits were: spike diameter (SD), results in millimeters (mm); spike length (SL), results in centimeters (cm); spike mass (SM), results in grams (g); cob diameter (CD), results in millimeters (mm); cob mass (CM), results in grams (g); spike insertion height (SH), results in meters; number of rows with grains in the spike (NRG), results in units; plan height (PH), results in meters (m); number of grains per row in the spike (NGR), results in units; prolificity (PRO), results in units; mass of a thousand grains (MTG), results in grams (g); grain yield (GY), results in kg∙ha−1[5] [17]; percentage of crude protein (CP) and mineral material (MM) in the grains [18].
The phenotypic index (PI) was generated by the product of grain yield per hectare and the percentage of crude protein of each genotype’s grains [19].
GY CP
GY CP
PI
S S
= ×
(1)
where: PI = phenotypic index combining grain yield per hectare and percentage of crude protein in the grains; GY = grain yield per hectare; CP: percentage of crude protein in the grains; SGY = standard deviation of grain yield; SCP:
DOI: 10.4236/ajps.2017.813224 3327 American Journal of Plant Sciences Table 2. Description of hybrids.
Hybrids Type of Hybrid Cycle Company 2A106 Modified single cross Super Early Dow Agrosciences 30F53 Single cross Early Dupont do Brasil S.A P2530 Single cross Super Early Dupont do Brasil S.A P30F53Hx® Single cross Early Dupont do Brasil S.A P3646Hx® Single cross Early Dupont do Brasil S.A P1630Hx® Single cross Super Early Dupont do Brasil S.A ADV9434PRO® Single cross Early Advanta
AS1656PRO® Single cross Early Agroeste DKB245PRO® Single cross Early Dekalb
LG6304YG® Modified single cross Early Limagrain/Guerra FORMULA TL® Single cross Super Early Syngenta Seeds Ltda
CELERON TL® Single cross Super Early Syngenta Seeds Ltda MAXIMUS VIP3® Single cross Early Syngenta Seeds Ltda DEFENDER VIP® Three way cross Early Syngenta Seeds Ltda IMPACTP VIP3® Single cross Early Syngenta Seeds Ltda
The statistical model for analysis of the several environments in the experi-mental net, considering the plot mean value, is given by:
y Xb Zg Wge e= + + +
where: y, b, g, ge, and e are the data vectors. The model fixed effects are given by the average of the blocks through the sites, aleatory genotypic effects, aleatory G × E interaction effects, respectively. X, Z and W are matrices of incidence for b, g
and ge, respectively [20]. The joint selection by PI, and the genotype’s stability and adaptability were based on the statistic called harmonic mean of the relative performance of predicted genotypic values (HMRPGV) [20]. In this model, the interaction free predicted genotypic values consider all growing environments, are given by u + g, where u refers to the average of all environments. The pre-dicted values for each trait in the univariate form were used in the genotypic se-lection index exemplified below. In addition, the genotypic correlation was ob-tained between the analyzed traits to elaborate the selection index. All the ana-lyses were performed through Selegen software (Reml/Blup) [21]. The predicted genotypic values were used for estimating the pair to pair joint correlation be-tween growing environments.
DOI: 10.4236/ajps.2017.813224 3328 American Journal of Plant Sciences 1 o 2 a1 3 a2 16 a15
GI b g= +b g +b g + + b g (2)
where go is the standardized genotypic value of the objective character, and ai
g is the standardized genotypic values of the auxiliary traits. The index’s weighting coefficients (bi) are given by [22]:
1
b P C= −
where:
2 2 2 2 2 2 2
1 1 2 2 15 15
2 2 2 2 2
1 1 2 1 2 1 15 1 15
2 2 2
2
ˆ ˆ ˆ ˆ ˆ ˆ ˆ ˆ ˆ ˆ ˆ ˆ ˆ
ˆ ˆ ˆ ˆ ˆ ˆ ˆ ˆ ˆ
ˆ ˆ 2 ˆ15 ˆ 2 15
1 ˆ2 5
g g g g g g g g g g g g g
g g g g g g g g
o o a o a o a o a o a o a
a a a a a a a a a
a a a a a
g
g g g
ga g
r r r r r r r r r r
r r r r r r r
P r r r r
Sim r = 2 2 1 1 2 2 2 ˆ
ˆ ˆ ˆ
ˆ ˆ ˆ
ˆ215 ˆ ˆ15
o
a o a
a o a
a g
g g g
g g
o a g
g g g
r r r C r r
r r =
Vector of genetic covariance between the predicted genetic value of the objec-tive character and the 16 sources of information (standardized predicted genetic value for the auxiliary traits), where 2
ˆ
go
r is the reliability of selection based on the objective character; 2
ˆ 1
ga
r is the reliability of selection based on the auxiliary trait 1; 2
ˆ 2
ga
r is the reliability of selection based on the auxiliary trait 2; rgogaˆ ˆ1 is
the genetic correlation between the objective character and the auxiliary trait 1;
2 ˆ ˆ
goga
r is the genetic correlation between the objective character and the auxiliary trait 2, and rga gaˆ1ˆ 2 is the genetic correlation between the two auxiliary traits.
The index’s reliability is obtained by the ratio between the index’s variance and the genotypic variance of the biological aggregate or objective character:
(
)
2 Indice 2
gg g
r =Var
σ
(3)With the predicted genetic values standardization, it gives 2 1
g
σ
= and(
)
2 Indice
gg
r =Var .
Thus, the variance of the index is given by:
(
Indice)
Var =b Pb′ (4)
Consequently, the accuracy of GI is given by the root of reliability.
3. Results and Discussion
DOI: 10.4236/ajps.2017.813224 3329 American Journal of Plant Sciences mass (SGM), spike grains mass (GM), and percentage of mineral material in the grains (MM). As consequence, it is inferred that the estimates of variance com-ponents and genetic parameters (heritabilities) for the traits evaluated in the 15 maize hybrids are significantly different from zero.
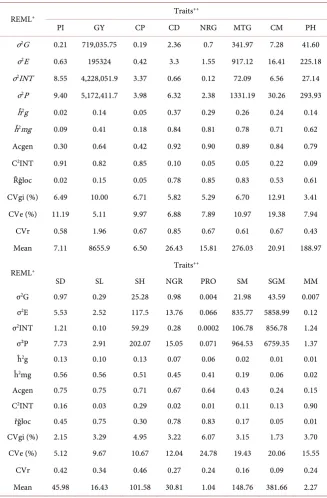
The variance components obtained through the restricted maximum likelih-ood (REML) revealed, for the traits CD, NRG, MTG and CM, the highest con-tribution of the genetic fraction (σ2G) for the studied traits’ phenotypic expres-sion (σ2P). The highest effects of environment (σ2E) were evidenced for the traits NGR, PRO, SM and SGM. However, the genotype × environment interaction (σ2INT) evidenced higher effects through the traits PI, GY, CP and MM, which is justified because these traits are highly influenced by the variation imposed by the G × A interaction and their genetic nature, being controlled by a large num-ber of genes and differentially interacting with the environment, modifying the trait’s phenotypic expression.
The heritability of a trait is as an important property for genetic breeding, as it expresses the proportion of the total phenotypic variation that comes from the genetic variation, which is determined by the average effect of genes and the de-gree of similarity between genotypes [23], i.e., it regards the total variation he-ritable fraction. In breeding programs, components and estimates of heritability are of fundamental importance to the breeder, since they assist in the deci-sion-making process about which trait should be preconized in the selection, di-recting the financial resources, labor and the time spent to achieve greater ge-netic gain for the trait of interest.
The genetic parameters estimated for the traits of interest (Table 3) revealed broad sense heritability (ĥ2g) of low (from 0.01 to 0.15) and mean (from 0.15 to 0.37) magnitudes, according to classification [20]. These low magnitudes are probably linked to the great effect of environment on the phenotype. In study with nine landrace varieties and four commercial hybrids, the authors [24] veri-fied ĥ2g for grain yield (0.85), number of grains per row (0.45), number of rows with grains (0.80), and mass of a hundred grains (0.84). Research [25] with ma-ize hybrids presented broad sense heritability for spike length (0.70), spike mass (0.65), spike grains mass (0.62), cob mass (0.70) and grain yield (0.23). Similarly, studies [26] have revealed broad sense heritability for plant height (0.59), spike insertion height (0.39), mass of a hundred grains (0.42), protein (0.96) and grain yield (0.56). The magnitude of heritability can be influenced by the estimation method, inbreeding level, genetic variability, sample size, number of environ-ments, evaluated traits, size of the experimental unit, precision in conducting the experiment and data collection.
DOI: 10.4236/ajps.2017.813224 3330 American Journal of Plant Sciences Table 3. Estimates of variance components and genetic parameters (individual REML) for the objective character of selection or phenotype index (PI) and the 15 auxiliary traits in maize hybrids evaluated in the joint analysis between environments.
REML+ Traits
++
PI GY CP CD NRG MTG CM PH σ2G 0.21 719,035.75 0.19 2.36 0.7 341.97 7.28 41.60 σ2E 0.63 195324 0.42 3.3 1.55 917.12 16.41 225.18 σ2INT 8.55 4,228,051.9 3.37 0.66 0.12 72.09 6.56 27.14
σ2P 9.40 5,172,411.7 3.98 6.32 2.38 1331.19 30.26 293.93 ĥ2g 0.02 0.14 0.05 0.37 0.29 0.26 0.24 0.14 ĥ2mg 0.09 0.41 0.18 0.84 0.81 0.78 0.71 0.62 Acgen 0.30 0.64 0.42 0.92 0.90 0.89 0.84 0.79 C2INT 0.91 0.82 0.85 0.10 0.05 0.05 0.22 0.09 Řğloc 0.02 0.15 0.05 0.78 0.85 0.83 0.53 0.61 CVgi (%) 6.49 10.00 6.71 5.82 5.29 6.70 12.91 3.41 CVe (%) 11.19 5.11 9.97 6.88 7.89 10.97 19.38 7.94 CVr 0.58 1.96 0.67 0.85 0.67 0.61 0.67 0.43 Mean 7.11 8655.9 6.50 26.43 15.81 276.03 20.91 188.97
REML+ Traits
++
SD SL SH NGR PRO SM SGM MM σ2G 0.97 0.29 25.28 0.98 0.004 21.98 43.59 0.007 σ2E 5.53 2.52 117.5 13.76 0.066 835.77 5858.99 0.12 σ2INT 1.21 0.10 59.29 0.28 0.0002 106.78 856.78 1.24 σ²P 7.73 2.91 202.07 15.05 0.071 964.53 6759.35 1.37 ĥ2g 0.13 0.10 0.13 0.07 0.06 0.02 0.01 0.01 ĥ2mg 0.56 0.56 0.51 0.45 0.41 0.19 0.06 0.02 Acgen 0.75 0.75 0.71 0.67 0.64 0.43 0.24 0.15 C2INT 0.16 0.03 0.29 0.02 0.01 0.11 0.13 0.90 řğloc 0.45 0.75 0.30 0.78 0.83 0.17 0.05 0.01 CVgi (%) 2.15 3.29 4.95 3.22 6.07 3.15 1.73 3.70 CVe (%) 5.12 9.67 10.67 12.04 24.78 19.43 20.06 15.55
CVr 0.42 0.34 0.46 0.27 0.24 0.16 0.09 0.24 Mean 45.98 16.43 101.58 30.81 1.04 148.76 381.66 2.27
DOI: 10.4236/ajps.2017.813224 3331 American Journal of Plant Sciences spike length (0.58), and mass of a hundred grains (0.52). Research [24] demon-strated ĥ2mg for mass of a hundred grains (0.97), and number of grains per row (0.83). Considering it, researches define that traits presenting this parameter elevated, are likely to be selected [28].
Regarding the genetic accuracy (Acgen), it is observed except for PI (0.30), CP (0.42), SM (0.43), SGM (0.24) and MM (0.15), moderated to high magnitudes (from 0.64 to 0.92) for the other traits. The high selective accuracy is indicative of precision, being the ration between predicted and real values [29]. It culmi-nates in greater breeding success due to the selection of superior genotypes.
The genotypic correlation among the performance in the growing environ-ments (řğloc) revealed higher magnitudes for the traits CD (0.78), NRG (0.85), MTG (0.83), PH (0.61), SL (0.75), NGR (0.78) and PRO (0.83). This fact indi-cates that the G × E interaction for these traits expressed simple effects, in other words, although there was differentiated behavior, the genotypes classification was not substantially altered in function of the different tested environments
[30]. The coefficient of genotypic variation (CVgi) ranged from 2.15% to 12.91%, indicating the presence of genetic variation for the evaluated traits. Re-searches define that the higher magnitude of coefficient of genotypic variation allows genetic gains in the genotypes selection [20]. Regarding the coefficient of experimental variation (CVe), low magnitudes were observed, which reflects the suitable experimental conditions and reliable estimates. The coefficient of rela-tive variation (CVr) ranged from 0.09 (SGM) to 1.96 (GY), with higher contri-bution of the genotypic value for the trait’s total variation, indicating they may be less influenced by environment effects [31].
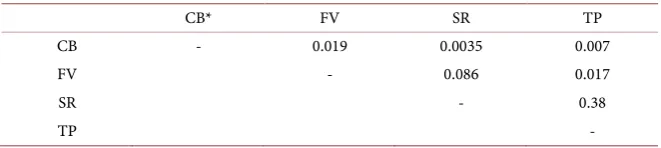
[image:8.595.209.540.637.711.2]The genetic correlations for growing environments obtained pair to pair, and referent to the PI objective character, were all low [29], revealing elevated dissi-milarity among environments and indicating the absence of breeding zones, therefore, the selection strategies must be exclusively proceeded in each one (Table 4). Studies [32] with maize open pollinated varieties grown in 15 envi-ronments in the Goiás state-BR, evidenced formation of two groups of stable en-vironments over the agricultural years studied, and a reduction of 16% of the environments currently used. Research [33] stratified the environments regard-ing maize lodgregard-ing and breakregard-ing, thus, when considerregard-ing these traits, the experi-mental net can be reduced because the genotypes do not present differential responses as function of environmental variations.
Table 4. Pair to pair genetic correlation among the studied environments regarding PI index.
CB* FV SR TP
CB - 0.019 0.0035 0.007
FV - 0.086 0.017
SR - 0.38
TP -
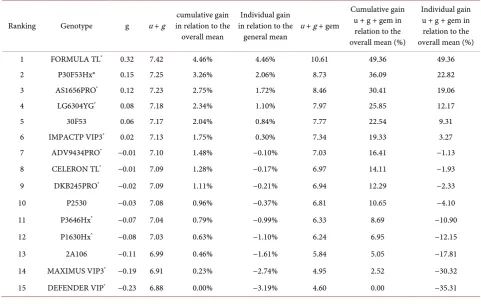
DOI: 10.4236/ajps.2017.813224 3332 American Journal of Plant Sciences The genotype ordering by the interaction free predicted genotypic values (u + g) among growing environments (Table 5) is useful for recommending maize hybrids to any other environment which was not considered in the experimental net. From the reckoning of the gains with selection for PI (objective character or phenotype index), a relatively small gain of 4.46% is verified for selecting the best maize hybrid (FORMULA TL®) considering simultaneously grain yield per hectare and percentage of crude protein in the grains. This result is explained by the low heritability of these traits. Thus, selection indexes that consider informa-tion of the auxiliary traits should be elaborated, aiming to increase the objective character’s genetic variance and selective accuracy.
Besides the best genotypes recommendation through the interaction free ge-notypic values (u + g), a general recommendation for all environments of the experimental net can be realized by the capitalization of the mean interaction (u
[image:9.595.56.538.428.732.2]+ g + gem) among environments (Table 5). This ordering is greatly relevant for plant breeding because it considers the mean genotypes performance in the ex-perimental net environments. The gains with selection through u + g + gem were superior to gains achieved through u + g (Table 5) due to the average per-formance increment of each genotype in the four environments. Therefore, the use of mixed models methodology and the REML/BLUP procedure allows to access important effects to guide genetic selection by the breeder.
Table 5. Ordering of maize hybrids through genotypic values free from genotypes × environments interaction effects (u + g), ge-notypic values plus one mean effect of interaction (u + g + gem) and predicted gains for the objective character or phenotype in-dex (PI), in the joint analysis among environments.
Ranking Genotype g u + g in relation to the cumulative gain overall mean
Individual gain in relation to the
general mean u + g + gem
Cumulative gain u + g + gem in relation to the overall mean (%)
DOI: 10.4236/ajps.2017.813224 3333 American Journal of Plant Sciences By comparing the ordering for PI through the predicted genotypic value (u +
g), genotypic value plus the mean interaction (u + g + gem), stability (HMGV), adaptability (RPGV) and stability, adaptability and grain yield simultaneously (HMRPGV*GY) (Table 6), it is verified an alternation in the ranking of geno-types. This fact reveals that the use of new selection attributes or criteria in the study of maize hybrids performance in different environments provides greater efficiency in the selection of superior genotypes. Thereby, a gain of 62% was ob-tained in the selection of the five best maize hybrids (FORMULA TL®, AS1656PRO®, P30F53Hx®, LG6304YG® and 30F53) in relation to the best hybrid for the criterion HMRPGV*GY.
The ranking of genotypes through HMRPGV*GY was ideal and should be considered for the final recommendation of the best genotypes. This criterion of selection simultaneously considers stability, adaptability and grain yield of the genotypes grown in the experimental net environments.
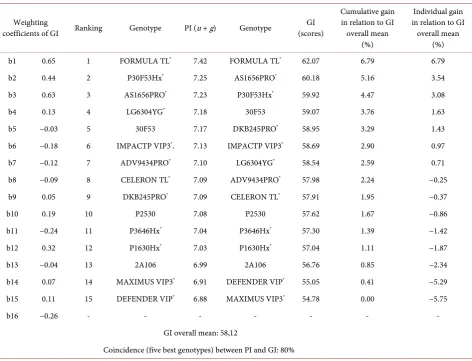
[image:10.595.56.538.399.694.2]The index (GI) with an objective character (PI) and 15 auxiliary traits was elaborated according to methodology of global optimization and multivariate BLUP initially derived by Viana and Resende [22], for utilization with three characters. In this study, the approach was expanded for genotypes selection us-ing 16 characters, beus-ing a pioneerus-ing work in this sense (Table 7). The GI is
Table 6. Ranking of the genetic value stability (HMGV), genetic values adaptability (RPGV), stability and adaptability simulta-neously (HMRPGV) for IP (objective character of selection).
Stability Adaptability Stability and Adaptability
Ranking Genotype HMGV Genotype RPGV RPGV*GY Genotype HMRPGV HMRPGV*GY 1 FORMULA TL® 8.77 FORMULA TL® 1.47 10.43 FORMULA TL® 1.38 9.82 2 AS1656PRO® 7.47 P30F53Hx® 1.23 8.73 AS1656PRO® 1.14 8.12 3 P30F53Hx® 7.32 AS1656PRO® 1.19 8.45 P30F53Hx® 1.11 7.91 4 30F53 7.18 30F53 1.18 8.37 LG6304YG® 1.01 7.19 5 LG6304YG® 6.19 LG6304YG® 1.08 7.66 30F53 1.00 7.08 6 DKB245PRO® 5.79 CELERON TL® 1.01 7.19 IMPACTP VIP3® 0.87 6.15 7 2A106 5.67 DKB245PRO® 0.99 7.01 CELERON TL® 0.86 6.08 8 IMPACTP VIP3® 5.24 IMPACTP VIP3® 0.97 6.87 P2530 0.82 5.80 9 CELERON TL® 5.12 ADV9434PRO® 0.96 6.79 P1630Hx® 0.80 5.70 10 P2530 5.00 P2530 0.93 6.62 2A106 0.78 5.52 11 ADV9434PRO® 4.96 2A106 0.91 6.50 ADV9434PRO® 0.76 5.37 12 P1630Hx® 4.95 P3646Hx® 0.84 5.97 CELERON TL® 0.74 5.26 13 P3646Hx® 4.36 P1630Hx® 0.84 5.97 P3646Hx® 0.69 4.90 14 DEFENDER VIP® 3.36 MAXIMUS VIP3® 0.73 5.16 DEFENDER VIP® 0.45 3.23 15 MAXIMUS VIP3® 2.72 DEFENDER VIP® 0.69 4.87 MAXIMUS VIP3® 0.39 2.77
Gain related to the overall mean through HMRPGV*GY (best hybrid): 62%
DOI: 10.4236/ajps.2017.813224 3334 American Journal of Plant Sciences Table 7. Weighting coefficients (bi) of GI and ranking of maize hybrids and their genotypic values free from G × A interaction (u
+ g), and by the genotypic index (GI) scores composed by the PI objective character, which combines grain yield per hectare and the percentage of crude protein of the grains, jointly with the 15 auxiliary traits.
Weighting
coefficients of GI Ranking Genotype PI (u + g) Genotype (scores) GI
Cumulative gain in relation to GI
overall mean (%)
Individual gain in relation to GI
overall mean (%) b1 0.65 1 FORMULA TL® 7.42 FORMULA TL® 62.07 6.79 6.79 b2 0.44 2 P30F53Hx® 7.25 AS1656PRO® 60.18 5.16 3.54 b3 0.63 3 AS1656PRO® 7.23 P30F53Hx® 59.92 4.47 3.08 b4 0.13 4 LG6304YG® 7.18 30F53 59.07 3.76 1.63 b5 −0.03 5 30F53 7.17 DKB245PRO® 58.95 3.29 1.43 b6 −0.18 6 IMPACTP VIP3®. 7.13 IMPACTP VIP3® 58.69 2.90 0.97 b7 −0.12 7 ADV9434PRO® 7.10 LG6304YG® 58.54 2.59 0.71 b8 −0.09 8 CELERON TL® 7.09 ADV9434PRO® 57.98 2.24 −0.25 b9 0.05 9 DKB245PRO® 7.09 CELERON TL® 57.91 1.95 −0.37 b10 0.19 10 P2530 7.08 P2530 57.62 1.67 −0.86 b11 −0.24 11 P3646Hx® 7.04 P3646Hx® 57.30 1.39 −1.42 b12 0.32 12 P1630Hx® 7.03 P1630Hx® 57.04 1.11 −1.87 b13 −0.04 13 2A106 6.99 2A106 56.76 0.85 −2.34 b14 0.07 14 MAXIMUS VIP3® 6.91 DEFENDER VIP® 55.05 0.41 −5.29 b15 0.11 15 DEFENDER VIP® 6.88 MAXIMUS VIP3® 54.78 0.00 −5.75
b16 −0.26 - - - -
GI overall mean: 58,12
Coincidence (five best genotypes) between PI and GI: 80%
+GY: grain yield per hectare (kg∙ha−1); CP: percentage of crude protein in the grains (%); CD: cob diameter (mm); NRG: number of rows with grains in the
spike (unit); MTG: mass of a thousand grains (g); CM: cob mass (g); PH: plant height (cm); SD: spike diameter (cm); SL: spike length (cm); SH: spike inser-tion height (cm); NGR: number of grains per row in the spike (unit); PRO: prolificity (unit); SM: spike mass (g); SGM: spike grains mass (g) and MM: min-eral material of the grains (%).
composed by the PI objective character which combines grain yield per hectare and percentage of crude protein in the grains, jointly to the 15 auxiliary traits optimally weighted by their accuracies, heritabilities and genetic correlations.
All these factors are adequately considered in the weighting coefficients (Table 7), which will be higher as higher the correlations of auxiliary traits with the objective character are [22]. The GI selective accuracy was 0.63, being 210% higher than the PI objective character individually considered (accuracy of 0.30). Selective accuracy refers to the correlation between true genotypic value and predicted value through experimental information [29]. This parameter’s utiliza-tion is considered ideal for choosing the best selecutiliza-tion method, mainly because the genetic gain is directly proportional to the accuracy, i.e., as higher the accu-racy is, better is the precision of selection [34].
DOI: 10.4236/ajps.2017.813224 3335 American Journal of Plant Sciences GI, with coincidence of 80% among the five best maize hybrids. Therefore, the ordering generated by GI should be used for the final recommendation of the genotypes, since it is a more accurate index than the PI, as it aggregates informa-tion of the auxiliary traits, their genotypic correlainforma-tions with the objective cha-racter, genotypic values and selection reliability. In addition to accuracy incre-ment, the GI character provided higher genetic gains than PI, where the use of GI increased genetic gain by 2.33% due to the selection of the best genotype, and 1.72% by the selection of the three best ones. In genetic breeding programs, there is an imminent difficulty for selecting superior genotypes of traits with low genetic control, due to the great effect that the environment exerts on the geno-type’s phenotypic variation. Therefore, the use of auxiliary traits becomes a via-ble practice to improve the selecting process efficiency of superior maize geno-types.
4. Conclusions
1) The genotypic index, composed by the grain yield and the crude protein percentage in the grains, is the best selection strategy to achieve maize superior genotypes.
2) The multivariate genotypes selection, considering grain yield and crude protein, is efficient.
3) The genotypes FORMULA TL®, AS1656PRO®, P30F53Hx®, LG6304YG® and 30F53 are more adapted and stable for grain yield and percentage of crude pro-tein, in the conditions of this study.
4) The mixed models were efficient to employ the multicharacter selection and to contribute for maize genetic breeding.
References
[1] Paes, M.C.D. (2006) Physical, Chemical and Technological Aspects of Maize Grains. Embrapa Milho e Sorgo, Sete Lagoas.
[2] Cruz, C.D., Regazzi, A.J. and Carneiro, P.C.S. (2004) Biometric Models Applied to Plant Breeding. Editora UFV, Viçosa.
[3] Baretta, D., Nardino, M., Carvalho, I.R., Pelegrin, A.J., Ferrari, M., Szareski, V.J., Barros, W.S., Souza, V.Q., Oliveira, A.C. and Maia, L.C. (2017) Estimates of Genetic Parameters and Genotypic Values Prediction in Maize Landrace Populations by REML/BLUP Procedure. Genetics and Molecular Research, 16, 1-14.
https://doi.org/10.4238/gmr16029715
[4] Carvalho, I.R., Pelegrin, A.J., Szareski, V.J., Ferrrari, M., Corazza, T., Martins, T., Santos, N.L., Nardino, M., Souza, V.Q., Oliveira, A.C. and Maia, L.C. (2017) Diallel and Prediction (REML/BLUP) for Yield Components in Intervarietal Maize Hybr-ids. Genetics and Molecular Research, 16, 1-12.
https://doi.org/10.4238/gmr16039734
[5] Carvalho, I.R., De Souza, V.Q., Follmann, D.N., Nardino, M. and Schmidt, D. (2014) Performance of Agriculture Environment in Hybrid Corn Irrigated and Irri-gated. Enciclopédia Biosfera, 10, 1144-1153.
DOI: 10.4236/ajps.2017.813224 3336 American Journal of Plant Sciences
Pelegrin, A.J. and Souza, V.Q. (2017) REML/BLUP and Sequential Path Analysis in Estimating Genotypic Values and Interrelationships among Simple Maize Grain Yield-Related Traits. Genetics and Molecular Research, 16, 1-10.
https://doi.org/10.4238/gmr16019525
[7] Smith, H.F. (1936) A Discriminant Function for Plant Selection. Ann Eugen, 7, 240-250. https://doi.org/10.1111/j.1469-1809.1936.tb02143.x
[8] Hazel, L.N. (1943) The Genetic Basic for Constructing Selection Indexes. Genetics, 28, 346-490.
[9] Cunningham, E.P. (1975) Multi-Stage Index Selection. Theoretical and Applied Genetics, 46, 55-61. https://doi.org/10.1007/BF00264755
[10] Resende, M.D.V. and Oliveira, E.B. (1990) Utilization of Selection Indexes on Euca-liptus Breeding. Boletim de Pesquisa Florestal, 21, 1-13.
[11] Santos, F.S., Amaral Júnior, A.D., Freitas Júnior, S.D.P., Rangel, R.M. and Pereira, M.G. (2007) Genetic Gain Prediction by Selection Index in a UNB-2U Popcorn Population under Recurrent Selection. Bragantia, 66, 389-396.
https://doi.org/10.1590/S0006-87052007000300004
[12] Jesus Freitas, I.L., Do Amaral Junior, A.T., Viana, A.P., Pena, G.F., Da Silva Cabral, P., Vittorazzi, C. and Da Conceição Silva, T.R. (2014) Genetic Gain Evaluated with Selection Indices and with REML/Blup in Popcorn. Brazilian Journal of Agricultural Research, 48, 1464-1471.
[13] Vale, J.C., Fritsche-Neto, R. and Lima, P.S. (2011) Selection Index of Maize Culti-vars with Twice Fitness: Baby Corn and Green Corn. Bragantia, 70, 781-787. [14] Santos, H.G., Jacomine, P.K.T., Anjos, L.H.C., Oliveira, V.A., Oliveira, J.B., Coelho,
M.R., Lumbreras, J.F. and Cunha, T.J.F. (2006) Brazilian System of Soil Classification. Embrapa Solos, Rio de Janeiro.
[15] Clime-data.org. https://pt.climate-data.org
[16] Alvares, C.A., Stape, J.L., Sentelhas, P.C., Gonçalves, J.L. De, M. and Sparovek, G. (2013) Köppen’s Climate Classification Map for Brazil. Meteorologische Zeitschrift, 22, 711-728.https://doi.org/10.1127/0941-2948/2013/0507
[17] Souza, V.Q., Carvalho, I.R., Follmann, D.N., Nardino, M., Bellé, R., Baretta, D. and Schmidt, D. (2015) Defoliation and Its Effects on Morphological and Productive Traits in Maize Hybrids. Revista Brasileira de Milho e Sorgo, 14, 61-74.
https://doi.org/10.18512/1980-6477/rbms.v14n1p61-74
[18] Nogueira, A.R.A. and Souza, G.B. (2005) Lab Journals: Soil, Water, Plant Nutrition, Animal Nutrition and Food. Embrapa Pecuária Sudeste, São Carlos.
[19] Nunes, A.C.P., Resende, M.D.V., Santos, G.A. and Alves, R.S. (2017) Evaluation of Different Selection Indexes combining Pilodyn Penetration and Growth Perfor-mance in Eucalyptus Clones. Crop Breeding and Applied Biotechnology, 17, 206-213.https://doi.org/10.1590/1984-70332017v17n3a32
[20] Resende, M.D.V. (2002) Biometric Genetics and Statistics on Perennial Plant Breeding. Embrapa informações tecnológicas, Brasilia.
[21] Resende, M.D.V. (2016) Software Selegen-REML/BLUP: A Useful Tool for Plant Breeding. Crop Breeding and Applied Biotechnology, 16, 330-339.
https://doi.org/10.1590/1984-70332016v16n4a49
[22] Viana, A.P. and Resende, M.D.V. (2014) Quantitative Genetics of Fruit Tree Breed-ing. Editora Interciência, Rio de Janeiro.
DOI: 10.4236/ajps.2017.813224 3337 American Journal of Plant Sciences
[24] Baretta, D., Nardino, M., Carvalho, I.R., Oliveira, A.C., Souza, V.Q. and Maia, L.C. (2016) Performance of Maize Genotypes of Rio Grande do Sul using Mixed Models.
Científica, 44, 403-411.https://doi.org/10.15361/1984-5529.2016v44n3p403-411
[25] Nardino, M., Baretta, D., Carvalho, I.R., Olivoto, T., Follmann, D.N., Szareski, V.J., Ferrari, M., De Pelegrin, A.J., Konflanz, V.A. and De Souza, V.Q. (2016) Restricted Maximum Likelihood/Best Linear Unbiased Prediction (REML/BLUP) for Analyz-ing the Agronomic Performance of Corn. African Journal of Agricultural Research, 11, 4864-4872.https://doi.org/10.5897/AJAR2016.11691
[26] Bekele, A. and Rao, T.N. (2014) Estimates of Heritability, Genetic Advance and Correlation Study for Yield and It’s Attributes in Maize (Zea mays L.). Journal of Plant Sciences, 2, 1-4.
[27] Nardino, M., Baretta, D., Carvalho, I.R.C., Olivoto, T., Pelegrin, A.J., Ferrari, M., Szareski, V.J., Konflaz, V.A., Caron, B.O., Schmidt, D., Barros, W.S. and Souza, V.Q. (2016) REML/BLUP in Analysis of Pre-Commercial Simple Maize Hybrids.
International Journal of Current Research, 8, 37008-37013.
[28] Torres, F.E., Teodoro, P.E., Sagrillo, E., Ceccon, G. and Correa, A.M. (2015) Genotype x Environment Interaction in Semiprostrade Cowpea Genotypes via Mixed Models. Bragantia, 74, 255-260.https://doi.org/10.1590/1678-4499.0099
[29] Resende, M.D.V. and Duarte, J.B. (2007) Precision and Quality Control in Variety Trials. Pesquisa Agropecuária Tropical, 37, 182-194.
[30] Pupin, S., Santos, A.V.A., Zaruma, D.U.G., Miranda, A.C., Silva, P.H.M., Marino, C.L., Sebbenn, A.M. and Moraes, M.L.T. (2015) Productivity, Stability and Adapta-bility in Open Pollination Progenies of Eucalyptusurophylla S.T. Blake. Scientia Forestalis, 43, 127-134.
[31] Vencovsky, R. and Barriga, P. (1992) Biometric Genetics on Plant Breeding. Sociedade Brasileira de Genética, Ribeirão Preto.
[32] Felipe, C.R.P., Duarte, J.B. and Camarano, L.F. (2010) Environmental Stratification for Maize Varieties Evaluation and Recommendation in Goiás State, Brazil. Pesqui-sa Agropecuária Tropical, 40, 186-199.
[33] Buzinaro, R., Revolti, L.T.M., Charnai, K., Giorgenon, C.H.B., Vitor, M., Held, C. and Môro, G.V. (2014) Environment Stratification Based on Characters Lodging and Culm Breakage of Maize in Different Seasons of Seeding. Ciência e Tecnologia, 6, 75-79.