Munich Personal RePEc Archive
“AN ANALYSIS OF PERFORMANCE
IN E-COMMERCE INDUSTRY”
zhang, ying li lian
universiti utara malaysia
15 November 2019
“AN ANALYSIS OF PERFORMANCE IN E-COMMERCE INDUSTRY”
ZHANG YING LI LIAN
Universiti Utara Malaysia
ABSTRACT
We used the SPSS system to perform regression analysis on Delta Air Lines. Through this research, it was found that Delta’s liquidity performance deteriorated year by year, which means its research. Regression analysis shows that Delta airlines liquidity risk is affected by asset return (internal factors) and US internal production growth (external factors). What is the most influential factor in corporate governance.
1.0 INTRODUCTION
1.1 Overview
Delta Air Lines is an airline based in Atlanta, Georgia. The company is headquartered in Atlanta and Minnesota. Delta Air Lines is the third-largest airline in the United States and is headquartered in Atlanta with nearly 700 aircraft and more than 75,000 employees worldwide. As a founding member of SkyTeam, Delta Air Lines provides more than 13,000 flights a day and operates Delta Air Lines at airports around the world. With its industry-leading global network, Delta serves 351 destinations in 64 countries on six continents. Passengers can check in on the official website, print boarding passes, check in baggage and flight information. The Delta Board of Directors believes that good corporate governance practices provide an important framework to help the board perform its duties. These corporate governance principles have been approved by the board of directors. They will be reviewed annually or longer (if deemed necessary or appropriate).
Delta's business is conducted under the guidance and supervision of the board of directors, which is elected by shareholders. The Delta Board of Directors represents the interest of shareholders in optimizing long-term financial returns. The Board also considers the concerns of other stakeholders and stakeholders, including employees, customers, suppliers, government officials and the general public, as appropriate. Directors advise on management and monitor performance and compliance with company standards. Delta's business is carried out by its employees, managers and managers under the direction of the CEO.
Delta Air Lines is a founding member of SkyTeam. On June 7, 2017, the "2010 Fortune 500" list was released, and Delta Airlines ranked 71st. On July 19, 2018, Delta ranked 266th in the Fortune Global 500 list. Delta Air Lines is an airline based in Atlanta, Georgia, USA. It is the second largest airline in the world in terms of total passenger mileage and fleet size. Delta Air Lines has spent more than 80 years acquiring today's airlines, most recently on October 29, 2008, it acquired Northwest Airlines for $2.8 billion, making it the world's largest airline at the time. the company. After the merger, Northwest Airlines continued to operate as a subsidiary. In 2009, the Delta and Northwest regions began a process of gradual merger. Since February, the airport that has business with both airlines has migrated, integrated and marked replacement of terminal services such as terminal counters and boarding seats. On January 31, 2010, Delta Airlines and Northwest Airlines merged. Using the same reservation system and website, Crown Room Club and “World Club” merged into “Sky Club” and the Northwest Miles Reward “World Perks” merged into Delta’s “SkyMiles”. The Northwest Airlines brand officially entered history. Delta Air Services was founded in 1928. In 2008, Delta Air Lines merged with Northwest Airlines to establish Delta Air Lines.
However, it is not an easy task to establish a sound corporate governance. It takes a lot of time and money to succeed. In the process of establishing, companies should also address risks associated with company performance.
are all risks associated with corporate governance.
The research report shows its operational risk, and Delta's liquidity has decreased from 2014 to 2018. This indicates that you want to repay the ability to spend on short-term debt. In the end, investors and creditors may lose trust in the market.In recent years, delta has been promoting its credit card business with American express. With delta credit CARDS, members can sign up for the $75 discount on Clear America's $175 express screening system. Using the credit card to rent a car from Hertz, take a ride with Lyft, or pay for a ride with a partner offers miles.
1.2 Research Objective
1. Examine the internal causes of liquidity risk.
2. Examine the external causes that affect liquidity risk.
3. Examine the internal and external causes that affect liquidity risk.
1.3 Research Questions
1. What is the relationship between internal factors of liquidity risk?
2. What is the relationship between external factors of liquidity risk?
3. What is the relationship between internal and external factors of liquidity risk?
1.4 Scope of Study
The sample for the study is detailed information on the US airline industry (Delta Airlines). The financial data of the study was derived from Delta Air Lines 2014-2018 Annual Report.
1.5 Organization of The Study
This report is divided into 5 parts. The first chapter is a summary of the basic situation of the study. It contains an overview, problems, research scope and research organization. In Chapter 2, we look at the literature on independent variables and describe the variables in these documents that are internal and external factors that influence the company's liquidity ratio. The third chapter points out variables, research methods and data analysis. In Chapter 4, we discuss the data and results of the study. It is also a summary and theory of this study.
2.0 LITERATURE REVIEW
Credit risk capital, defined as the maximum loss in an orderly clearing interval within a known confidence interval (eg, 99%), is usually interpreted as an additional
economy that must be held against a given portfolio and that exceeds or exceeds the credit level. capital. This risk occurs when a flight expands a contractual
agreement. Therefore, external factors caused by risk conversion, such as politics and emergencies, industry competition, etc.
Operational risk refers to the combination of the complexity and variability of the external environment during the operation process, and the failure of the operation caused by the limitation of the environment's cognitive ability and the ability to adapt to the environment is not a specific risk. Multiple risks. Capital operation is a
systematic project, but it needs corresponding policies to support, social environment, market environment and talent environment to provide services for the stable
development of capital operation. The economic role in the market economy to maintain macroeconomic stability under the "market failure" situation, income redistribution and intervention in resource allocation. The government should use good development opportunities such as development plans and industrial policies to control capital operations. It should also use laws and administration to encourage everyone to supervise the capital operation of society. Establish a modern enterprise system and strengthen the management of risk science. When conducting capital operations, airlines must pay attention to the reform of the internal management system to ensure the healthy and effective operation of capital. Companies need to seize market management while seizing internal management.
The value of short-term assets is insufficient to cover the payment of short-term liabilities or unexpected capital outflows. From this perspective, liquidity is a "safety cushion" that helps buy time and cushion the blow of a crisis in difficult conditions. From the perspective of financing difficulties, liquidity refers to the ability to raise capital at a reasonable cost. As the market temporarily lacks liquidity, liquidity costs increase, which affects the cost of capital for all market participants.
Market risk is an important reason for affecting the overall performance of the financial market involved. Market risk is also called “systemic risk” and cannot be dispersed and completely eliminated, but it can be improved by other means. Sources of market risk include recession, political turmoil, interest rate changes, and natural disasters. Systemic or market risk often affects economic changes throughout the market.
In stark contrast to non-systematic risks, in the portfolio, it is also referred to as “non-systematic risk”, “specific risk”, “distributable risk” or “remaining risk”. dual risk", which can reduce non-systematic risk through diversification.
(1) changes in consumer demand
The purchase decision of consumers is a kind of choice behavior, which is directly affected by their consumption preference and other factors, such as the price of goods, the comparison of prices of different goods, the quality of goods and the quality of comparison between different goods, advertising publicity, fashion trend and so on. At present, most low-cost airlines are favored by most consumers, and low-cost travel reduces the cost of most travelers, so there is still some threat to delta airlines
(2) Competitors will
As the market economy develops and continues to improve, the degree of market competition will increase. On the one hand, airlines are not only under pressure from their original competitors, but also under pressure from some potential competitors. In the process of marketization, airlines may run the risk of vicious price competition. So far, the trend of market competition from pure price competition to non-price competition is constantly developing.
(3) Changes in policies and regulations
Changes in national policies will bring certain risks to airlines. The government encourages preferential policies for the development of certain industries, and supports certain industries through consumer credit policies such as preferential credit, taxation and export subsidies.
Therefore, in the process of conducting various business activities, the time is also a huge risk. In the process of continuous development, the risk factors and types of risks are also increasing. Therefore, we need to strengthen risk management and increase the attention and take corresponding measures. Reasonable measures to avoid risks, strengthen risk management, and ensure that airlines will continue to develop healthily in the future.
3.0 METHODOLOGY
3.1 Introduction
to learn about the company factors and economic factors. The sample for this article is delta airlines. The main source of the study is delta's annual report from 2014 to 2018.
3.2 Population and Sampling Technique
In the study, it is the focus of researchers' research to refer to the population as having all the characteristics of all units. We can understand the population as a group goal that researchers study and examine. They selected a company from the population as a sample to support the study. The company chosen is Delta Air Lines. Therefore, in order to determine changes in dependent variables (liquidity risk) and independent variables (internal and external), annual report data from 2014 to 2018 were used for analysis.
3.3 Statistical Technique
The company examines the company's internal and external factors from all aspects, including profitability, company performance, operational capabilities, and integrity. The qualifications of the board of directors require gender diversity, regardless of nationality, audit committee, community service projects, meeting attendance rate and the influence of directors on the impact of macroeconomic factors on liquidity risk. This time I collected 2014-2018 Some data on US GDP.
3.4 Data Analysis
The return on assets (ROA) is the ratio of the company's total after-tax income. (plus interest) to the company's total assets. The relationship between return on equity and return on assets is:
Return on equity (ROE) = return on assets (ROA) × leverage ratio (L)
Where: leverage ratio is the ratio of the company's total assets to the company's. total shareholder equity book value (leverage ratio, referred to as L.
Linear regression was used in the study to predict the relationship between. variables and to estimate the effect of each explanatory variable on the dependent variable. Regression analysis (OLS) is used to find the relationship between the dependent variable and the independent variable. In general, regression analysis helps to show how the dependent variable changes as the independent variable changes.
Determine its independent influence.
3.5 Statistical Package for Social Sciences (SPSS)
interface is extremely friendly and the output is beautiful and beautiful. It displays almost all of its features in a unified, standardized interface, using Windows' window approach to showcase various functions for managing and analyzing data methods. The dialog box displays various feature options. SPSS uses input and management data in a similar way to EXCEL tables. The data interface is more general and can easily read data from other databases. The statistical process includes commonly used, more mature statistical processes that fully meet the needs of non-statistical professionals. The output is very beautiful. When stored, it is a dedicated SPO format that can be saved to HTML format and text format.
CHAPTER 4: FINDINGS AND ANALYSIS
Introduction
[image:8.595.91.412.488.766.2]In this activity, researchers can determine the company's development trends and plan the direction of development by comparing the ratios of another company in different periods or in the same industry. Thus studying the income statement, balance sheet and cash flow statement.
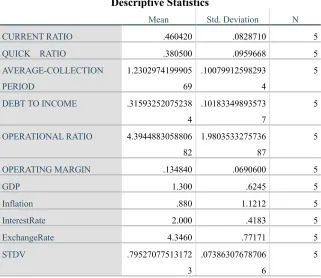
Table 1: Descriptive statistics of dependent and company specific variables
Descriptive Statistics
Mean Std. Deviation N CURRENT RATIO .460420 .0828710 5
QUICK RATIO .380500 .0959668 5
AVERAGE-COLLECTION PERIOD
1.2302974199905
69
.10079912598293
4
5
DEBT TO INCOME .31593252075238 4
.10183349893573
7
5
OPERATIONAL RATIO 4.3944883058806 82
1.9803533275736
87
5
OPERATING MARGIN .134840 .0690600 5
GDP 1.300 .6245 5
Inflation .880 1.1212 5
InterestRate 2.000 .4183 5
ExchangeRate 4.3460 .77171 5
STDV .79527077513172 3
.07386307678706
6
ROA .063020 .0299703 5
The collected data has been run in the SPSS System using a regression analysis of only 5 samples (2014-2018). Table 1 records the average of the ratio of dependent variables to variables. The following explanation rounds the value to four decimal places.
I.COMPANY PERFORMANCE
Graph 1: Return on asset ratio of Delta airlines from 2014-2018
0.0122
0.0852 0.0853
0.0671 0.0653
0.0000 0.0100 0.0200 0.0300 0.0400 0.0500 0.0600 0.0700 0.0800 0.0900
1 2 3 4 5
ROA is the rate of return on assets used to measure company performance. The higher the ROA, the higher the profitability of the company. As can be seen from the above chart, Delta's return on assets has been fluctuating for many years. Return on assets rose from 0.0122 in 2014 to 0.0853 in 2016. It fell slightly by 0.0671 in 2017, but fell again to 0.0653 in 2018. The highest ROA in the past five years is 2016 (0.0853), and the lowest is 2014 (0.0122). As shown in Figure 1, the average ROA is 0.06302.
II. LIQUIDITY RISK
Graph 2: Quick ratio of Delta airlines from 2014-2018
The quick ratio refers to the ratio of the company's quick assets to current liabilities. The quick ratio conversion, liquidity is also the short-term debt the company encounters. From 2014 to 2018, Delta's quick ratio has fallen for five consecutive years. In 2014, the quick ratio was 0.4831, and in 2018 it fell to 0.2516. According to Table 1, the average quick-moving ratio for 5 years is 0.06302, which indicates that from 2014 to 2018, it can only repay 0.6302 cents for every short-term debt of $1, and the company's ability to repay short-term debt is 0.55 cents. The range of 0.63 cents is quite stable. Every dollar of responsibility. This tells us that Delta's ability to encounter possible short-term emergencies is low.
0.4831
0.4464
0.4085
0.31…
0.2516
0.0000 0.1000 0.2000 0.3000 0.4000 0.5000 0.6000
1 2 3 4 5
III.CREDIT RISK
Graph 3: Average-collection period of Delta airlines from 2014-2018
The approximate time that the enterprise receives the amount owed by the accounts receivable refers to the average collection period. The graph shows that Delta's average payback period is fluctuating. In 2014, it took 3, 4,856 days to recover the accounts receivable, while in 2015 it would take 0,4463 days. Performance improved in 2016, reaching its highest level in 2017, and the company's ability to recover receivables was poor.
Graph 4: Debt to income ratio of Delta airlines from 2014-2018
3.4856
0.4463 0.4720
0.7417
0.5881
0.0000 0.5000 1.0000 1.5000 2.0000 2.5000 3.0000 3.5000 4.0000
1 2 3 4 5
The debt-to-income ratio is a ratio that indicates the sustainability of the company and the debt burden. The ability of an enterprise to repay debt depends on its cost and income. Larger business operations and stable cash flow operations can maintain a high debt ratio as long as they have an effective cost structure. Delta’s debt-to-income ratio fell from 81.9499 in 2014 to 15.3154 in 2018. Over the years, the company’s income has been reduced by the burden of debt repayment.
IV. OPERATIONAL RISK
Graph 5: Operational ratio of Delta airlines from 2014-2018
The operating ratio indicates the company's management efficiency. The lower the ratio, the stronger the organization's ability to generate revenue. As can be seen from the above chart, in 2014, the company had the lowest operating ratio because it could effectively manage its operating expenses. The company's average operating ratio is 4.4058.
81.9499
11.7397
11.7222 16.7460 15.3154
0.0000 10.0000 20.0000 30.0000 40.0000 50.0000 60.0000 70.0000 80.0000 90.0000
1 2 3 4 5
DEBT TO INCOME
2.6209 3.0013
3.5064
5.5301
7.3138
0.0000 1.0000 2.0000 3.0000 4.0000 5.0000 6.0000 7.0000 8.0000
1 2 3 4 5
Graph 6: Operating margin of Delta airlines from 2014-2018
The operating profit margin shows us that the company can profit from the sales income of US$1 after deducting interest or variable production costs before tax. You can get the company's business static profit. The graph shows the trend of fluctuations. The lowest operating profit margin was 0.0307 in 2014, and the highest operating profit was 2015 (0.2058). The average operating profit was 0.1348. This means that the company's average operating profit is 0.1348 of total revenue. This percentage is very stable when the standard deviation is close to zero.
V. CORPORATE GOVERNANCE INDEX (CGI)
Graph 7: CG Index of Delta airlines from 2014-2018
0.0307
0.2058
0.1881
0.1337
0.1159
0.0000 0.0500 0.1000 0.1500 0.2000 0.2500
1 2 3 4 5
The criteria for representing each principle are conferences, attendance of audit committees, over 50% of non-executive committees, female executive directors and participation in social
responsibility programs. Each standard is counted as 1 point, and has reached 5 standards from 2014 to 2018, and has consistently scored 5 out of 5 points (100%) in the Corporate Governance Index. The CGI average is 5 and the scores are scattered to zero because they are able to meet the CGI tested in this study.
VI. GROWTH DOMESTIC PRODUCT (GDP)
Graph 8: Growth Domestic Products (GDP Annual %) of US from 2014-2018
The measure used in this study is the annual growth rate of GDP. The figure shows that the GPD fluctuates greatly. From Table 1, we can see that its average gross domestic product (GDP) is 1.3.
100% 100% 100% 100% 100%
0% 20% 40% 60% 80% 100% 120%
1 2 3 4 5
GCI
2.00
0.4
1.40
1.00
1.70
0.00 0.50 1.00 1.50 2.00 2.50
1 2 3 4 5
VII. INFLATION RATE
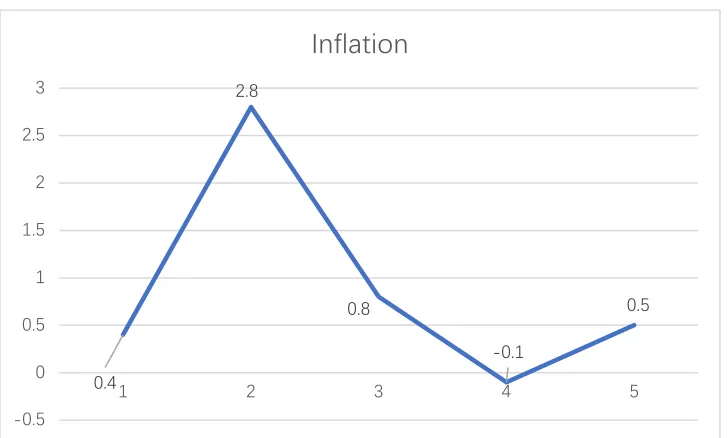
Graph 9: Inflation rate of US from 2014-2018
[image:15.595.90.454.172.391.2]The inflation rate in the United States fluctuated between 2014 and 2018. The highest inflation rate was 2.8% in 2015, while the lowest inflation rate was -0.1% in 2017. Table 1 shows that the average inflation rate is 5.9%.
VIII. INTEREST RATE
Graph 10: Interest rate of US from 2014-2018
Interest rates in the United States have risen sharply from 2014 to 2016 and rebounded to 2.1% in 2018. The average interest rate in Table 1 is 2%.
0.4
2.8
0.8
-0.1
0.5
-0.5 0 0.5 1 1.5 2 2.5 3
1 2 3 4 5
Inflation
1.3 2.2
2.4
2
2.1
0 0.5 1 1.5 2 2.5 3
1 2 3 4 5
IX. EXCHANGE RATE
Graph 11: Exchange rate from 2014-2018
The line graph above shows the exchange rate exchange rate. Exchange rate rose from 2014 to 2018
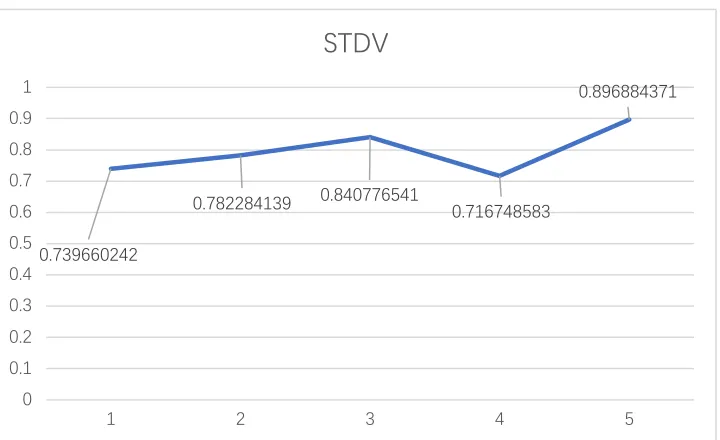
X. MARKET RISK (STDV)
Graph 11: Market risk of Delta airlines from 2014-2018
3.5
4.29 4.29
4.05
5.6
0 1 2 3 4 5 6
1 2 3 4 5
Delta’s market risk in 2014 was 74%. The highest market risk in 2018 was 89.6%.
4.2 SPSS ANALYSIS
The SPSS analysis of liquidity risk on company specific variables will be discussed in four perspective, namely correlation, model summary, anova and coefficient.
[image:17.595.92.452.68.288.2]I. Correlation
Table 2: Correlation of dependent variable and company internal and external factors of Delta airlines.
CURRENT RATIO QUICK RATIO AVERAGE-COLLECTION PERIOD
DEBT TO INCOME OPERATIONA L RATIO Pearson Correlation CURRENT RATIO
1.000 .996 -.987 .990 -.997
QUICK RATIO
.996 1.000 -.996 .999 -.989
AVERAGE-COLLECTION PERIOD
-.987 -.996 1.000 -.997 .980
DEBT TO INCOME
.990 .999 -.997 1.000 -.980
OPERATIONAL RATIO
-.997 -.989 .980 -.980 1.000
OPERATING MARGIN
-.037 -.075 .054 -.105 -.033
GDP -.109 -.067 .054 -.038 .152
Inflation .428 .442 -.482 .446 -.448
0.739660242
0.782284139 0.840776541 0.716748583
0.896884371 0 0.1 0.2 0.3 0.4 0.5 0.6 0.7 0.8 0.9 1
1 2 3 4 5
InterestRate -.342 -.376 .345 -.401 .271
ExchangeRate -.821 -.789 .733 -.769 .810
STDV -.504 -.461 .383 -.438 .485
ROA -.283 -.321 .299 -.349 .214
Sig. (1-tailed) CURRENT RATIO
. .000 .001 .001 .000
QUICK RATIO
.000 . .000 .000 .001
AVERAGE-COLLECTION PERIOD
.001 .000 . .000 .002
DEBT TO INCOME
.001 .000 .000 . .002
OPERATIONAL RATIO
.000 .001 .002 .002 .
OPERATING MARGIN
.477 .452 .466 .433 .479
GDP .431 .458 .466 .476 .404
Inflation .236 .228 .205 .226 .225
InterestRate .286 .267 .285 .252 .329
ExchangeRate .044 .056 .080 .064 .048
STDV .193 .217 .262 .230 .204
ROA .322 .299 .313 .282 .365
N CURRENT RATIO
5 5 5 5 5
QUICK RATIO
5 5 5 5 5
AVERAGE-COLLECTION PERIOD
5 5 5 5 5
DEBT TO INCOME
5 5 5 5 5
OPERATIONAL RATIO
5 5 5 5 5
OPERATING MARGIN
5 5 5 5 5
GDP 5 5 5 5 5
Inflation 5 5 5 5 5
InterestRate 5 5 5 5 5
ExchangeRate 5 5 5 5 5
STDV 5 5 5 5 5
The table shows the correlation between liquidity risk and it is internal and external factors. Delta's return on assets, GDP, interest rates and market risks are positively correlated with liquidity risk, and there is a positive correlation between debt and income. Operating ratios, inflation rates and exchange rates are inversely related to liquidity risk.
However, CGI has nothing to do with liquidity risk. As can be seen from the table, among the external factors of the company, inflation has the least impact on liquidity risk, and GDP has the greatest impact on liquidity risk.
[image:19.595.96.461.353.450.2]II. Model 1: Liquidity Risk on Internal Factors
Table 3: Model summary of Delta airlines liquidity risk on internal factors
Model Summaryb
Model R R Square
Adjusted R Square
Std. Error of the Estimate
Durbin-Watson 1 .997a .994 .992 .0075375 1.376
a. Predictors: (Constant), OPERATIONAL RATIO b. Dependent Variable: CURRENT RATIO
In the table of dependent variables and internal factors, it can be seen that the higher the quick ratio, the higher the yield and operating profit. They are positively correlated.
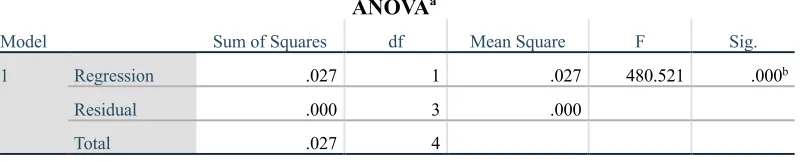
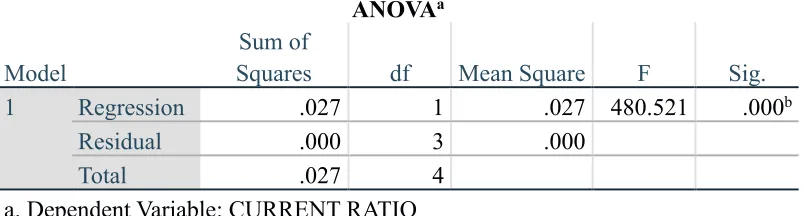
Table 4: Anova of Delta airlines liquidity risk on internal factors
ANOVAa
Model Sum of Squares df Mean Square F Sig. 1 Regression .027 1 .027 480.521 .000b
Residual .000 3 .000
Total .027 4 a. Dependent Variable: CURRENT RATIO
b. Predictors: (Constant), OPERATIONAL RATIO
[image:19.595.93.496.608.689.2]variable.
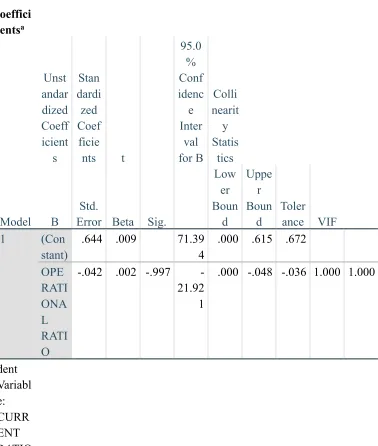
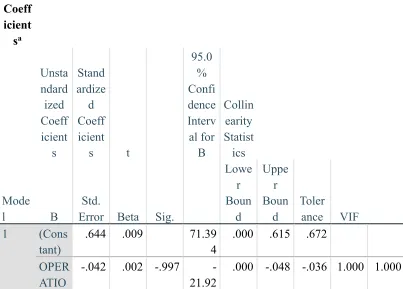
Table 5: Coefficients of Delta airlines liquidity risk on internal factors
oeffici entsa Model Unst andar dized Coeff icient s Stan dardi zed Coef ficie
nts t
Sig. 95.0 % Conf idenc e Inter val for B Colli nearit y Statis tics B Std.
Error Beta
Low er Boun d Uppe r Boun d Toler
ance VIF
1 (Con
stant)
.644 .009 71.39 4
.000 .615 .672
OPE RATI ONA L RATI O
-.042 .002 -.997 -21.92 1
.000 -.048 -.036 1.000 1.000
dent Variabl e: CURR ENT RATIO
has a positive impact on the quick ratio, while operating profit margin has a negative impact on the quick ratio.
[image:21.595.100.462.198.295.2]III. Model 2: Liquidity Risk on External Factors
Table 6: Model summary of Delta airlines liquidity risk on external factors
Model Summaryb
Model R R Square
Adjusted R Square
Std. Error of the Estimate
Durbin-Watson 1 .997a .994 .992 .0075375 1.376
a. Predictors: (Constant), OPERATIONAL RATIO b. Dependent Variable: CURRENT RATIO
[image:21.595.91.493.428.536.2]This table is a model extraction of dependent variables and external factors. We can trim, and the effect of the dependent variable is huge.
Table 7: Anova of Delta airlines liquidity risk on external factors
ANOVAa
Model
Sum of
Squares df Mean Square F Sig.
1 Regression .027 1 .027 480.521 .000b
Residual .000 3 .000
Total .027 4
a. Dependent Variable: CURRENT RATIO
b. Predictors: (Constant), OPERATIONAL RATIO
From the figure, we can conclude that GDP has the greatest impact on the dependent variable. The study pointed out that although GDP is large, it is not important.
Table 8: Coefficients of Delta airlines liquidity risk on external factors
Mode l Unsta ndard ized Coeff icient s Stand ardize d Coeff icient
s t
Sig. 95.0 % Confi dence Interv al for B Collin earity Statist ics B Std.
Error Beta
Lowe r Boun d Uppe r Boun d Toler
ance VIF
1 (Cons
tant)
.644 .009 71.39 4
.000 .615 .672
OPER ATIO NAL RATI O
-.042 .002 -.997 -21.92 1
.000 -.048 -.036 1.000 1.000
a. Depe ndent Varia ble: CUR REN T RATI O
We find that GDP has the greatest impact on liquidity ratios, translates into an increase in national GDP, and the company's liquidity is also increasing.
[image:22.595.92.495.62.521.2]IV. Model 3: Liquidity Risk on Internal And External Factors
Table 9: Model summary of Delta airlines liquidity risk on both internal and external factors
Model Summaryb
Model R R Square
Adjusted R Square
Std. Error of the
Estimate Durbin-Watson
1 .997a .994 .992 .0075375 1.376
b. Dependent Variable: CURRENT RATIO
[image:23.595.91.492.207.284.2]The study argues that GDP has little impact on corporate liquidity.
Table 10: Anova of Delta airlines liquidity risk on both internal and external factors
ANOVAa
Model Sum of Squares df Mean Square F Sig. 1 Regression .027 1 .027 480.521 .000b
Residual .000 3 .000
Total .027 4 a. Dependent Variable: CURRENT RATIO
b. Predictors: (Constant), OPERATIONAL RATIO
As can be seen from the table, GDP has the greatest impact on the dependent variable. The study pointed out that GDP is not important for liquidity.
Table 11: Coefficients of Delta airlines liquidity risk on both internal and external factors Coeff icient sa Mode l Unsta ndard ized Coeff icient s Stand ardize d Coeff icient
s t
Sig. 95.0 % Confi dence Interv al for B Collin earity Statist ics B Std.
Error Beta
Lowe r Boun d Uppe r Boun d Toler
ance VIF
1 (Cons
tant)
.644 .009 71.39 4
.000 .615 .672
OPER ATIO
-.042 .002 -.997 -21.92
[image:23.595.91.494.466.755.2]Research indicates that an increase in the mobility of a country can also help increase GDP.
5.0 RECOMMENDATION AND CONCLUSION
Introduction
The purpose of this study was to identify internal and external factors that affect the liquidity risk of Delta Air Lines. Among them, internal factors are (credit risk, company performance and corporate governance) and external factors (market risk, inflation, total traffic value, interest rate and exchange rate).
5.1 Limitations
This study is limited to the US airline industry. The data available for this study is limited because it only includes five years of performance and financial statements.
5.2 Conclusion
All in all, liquidity has not performed well in the past five years. Its liquidity is mainly affected by (internal factors) and (external factors). The company's liquidity risk depends on internal and external factors. However, it is difficult for the company to control the development of the external environment. Only some strategies can be adopted. Therefore, for Delta Air Lines, it will be more realistic to improve its internal performance. However, if the company fails to improve its ROA, the
company's performance and ability to withstand short-term liabilities will deteriorate. At the same time, airlines need to understand the economic situation and take risks effectively.
NAL RATI O
1
ACKNOWLEDGEMENT
Here, I would like to thank my lecturer and all the classmates and friends who helped me with this research.Thanks to everyone who helped me in this research.
REFERENCES
https://zh.wikipedia.org/wiki/%E9%81%94%E7%BE%8E%E8%88%AA%E7%A9%BA
https://www.skyteam.com/zh/about/delta-airlines
http://www.annualreports.com/Company/delta-air-lines-inc
http://www.annualreports.com/HostedData/AnnualReports/PDF/NYSE_DAL_20 18.pdf
https://ir.delta.com/financials/default.aspx
https://last10k.com/sec-filings/dal
https://wenku.baidu.com/view/08c421350b4c2e3f572763da.html
https://www.esky.com/airlines/al/dl/delta-airlines?gclid=CjwKCAiA_MPuBRB5EiwAHTTvMfJ1kmPwc7wkGbULB9hK8t3qCRM6bc Ok-gnBTVNQV-ZQtr1qKG9zKxoCrHwQAvD_BwE
https://www.zhihu.com/topic/19910961/hot
https://www.cnbc.com/2019/10/10/delta-air-lines-dal-earnings-3q-2019.html
https://wiki.mbalib.com/wiki/%E7%BE%8E%E5%9B%BD%E8%BE%BE%E7%BE%8E%E8% 88%AA%E7%A9%BA%E5%85%AC%E5%8F%B8