ALTO: Active Learning with Topic Overviews for Speeding Label
Induction and Document Labeling
Forough Poursabzi-Sangdeh
Computer Science University of Colorado
Jordan Boyd-Graber
Computer Science University of Colorado [email protected]
Leah Findlater
iSchool andUMIACS University of Maryland
Kevin Seppi
Computer Science Brigham Young University
Abstract
Effective text classification requires experts to annotate data with labels; these training data are time-consuming and expensive to obtain. If you know what labels you want, active learning can reduce the number of labeled documents needed. However, estab-lishing the label set remains difficult. An-notators often lack the global knowledge needed to induce a label set. We intro-duceALTO: Active Learning with Topic Overviews, an interactive system to help humans annotate documents: topic mod-els provide a global overview of what la-bels to create and active learning directs them to the right documents to label. Our forty-annotator user study shows that while active learning alone is best in extremely resource limited conditions, topic models (even by themselves) lead to better label sets, andALTO’s combination is best over-all.
1 Introduction
Many fields depend on texts labeled by human ex-perts; computational linguistics uses such annota-tion to determine word senses and sentiment (Kelly and Stone, 1975; Kim and Hovy, 2004); while so-cial science uses “coding” to scale up and systeme-tize content analysis (Budge, 2001; Klingemann et al., 2006).
Classification takes these labeled data as a train-ing set and labels new data automatically. Creat-ing a broadly applicable and consistent label set that generalizes well is time-consuming and dif-ficult, requiring expensive annotators to examine
large swaths of the data. Effective NLPsystems must measure (Hwa, 2004; Osborne and Baldridge, 2004; Ngai and Yarowsky, 2000) and reduce an-notation cost (Tomanek et al., 2007). Anan-notation is hard because it requires bothglobalandlocal knowledge of the entire dataset. Global knowledge is required to create the set of labels, and local knowledge is required to annotate the most useful examples to serve as a training set for an automatic classifier. The former’s cost is often hidden in mul-tiple rounds of refining annotation guidelines.
We create a single interface—ALTO (Active Learning with Topic Overviews)—to address both global and local challenges using two machine learning tools: topic modelsand active learning (we review both in Section 2). Topic models ad-dress the need for annotators to have a global overviewof the data, exposing the broad themes of the corpus so annotators know what labels to cre-ate. Active learningselectsdocuments that help the classifier understand the differences between labels and directs the user’s attentionlocallyto them. We provide users four experimental conditions to com-pare the usefulness of a topic model or a simple list of documents, with or without active learning suggestions (Section 3). We then describe our data and evaluation metrics (Section 4).
Through both synthetic experiments (Section 5) and a user study (Section 6) with forty participants, we evaluateALTOand its constituent components by comparing results from the four conditions in-troduced above. We first examine user strategies for organizing documents, user satisfaction, and user efficiency. Finally, we evaluate the overall effectiveness of the label set in a post study crowd-sourced task.
Topic words Document Title metropolitan,
car-rier, rail, freight, passenger, driver, airport, traffic, tran-sit, vehicles
A bill to improve the safety of mo-torcoaches, and for other purposes.
violence, sexual, criminal, assault, offense, victims, domestic, crime, abuse, trafficking
A bill to provide criminal penalties for stalking.
agricultural, farm, agriculture, rural, producer, dairy, crop, produc-ers, commodity, nutrition
[image:2.595.71.288.61.239.2]To amend the Federal Crop Insur-ance Act to extend certain supple-mental agricultural disaster assis-tance programs through fiscal year 2017, and for other purposes.
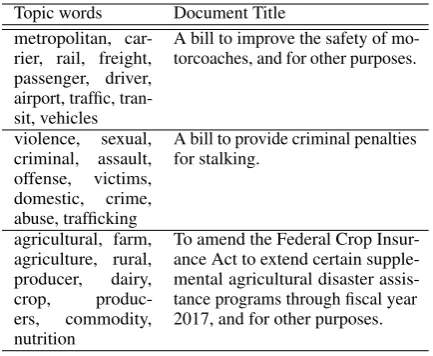
Table 1: Given a dataset—in this case, theUS con-gressional bills dataset—topics are automatically discovered sorted lists of terms that summarize seg-ments of a document collection. Topics also are associated with documents. These topics give users a sense of documents’ main themes and help users create high-quality labels.
2 Topic Overviews and Active Learning
ALTO,1a framework for assigning labels to docu-ments that uses both global and local knowledge to help users create and assign document labels, has two main components: topicoverviewand ac-tive learningselection. We explain howALTOuses topic models and active learning to aid label induc-tion and document labeling.
Topic Models Topic models (Blei et al., 2003) automatically induce structure from a text corpus. Given a corpus and a constantKfor the number of topics, topic models output (i) a distribution over words for each topick(φk,w) and (ii) a distribution over topics for each document (θd,k). Each topic’s most probable words and associated documents can help a user understand what the collection is about. Table 1 shows examples of topics and their highest associated documents from our corpus of UScongressional bills.
Our hypothesis is that showing documents grouped by topics will be more effective than hav-ing the user wade through an undifferentiated list of random documents andmentally sort the major themes themselves.
Active Learning Active learning (Settles, 2012) directs users’ attention to the examples that would 1Code available at https://github.com/
Foroughp/ALTO-ACL-2016
be most useful to label when training a classifier. When user time is scarce, active learning builds a more effective training set than random labeling: uncertainty sampling (Lewis and Gale, 1994) or query by committee (Seung et al., 1992) direct users to the most useful documents to label.
In contrast to topic models, active learning pro-vides local information:this documentis the one you should pay attention to. Our hypothesis is that active learning directing users to documents most beneficial to label will not only be more effective than randomly selecting documents but will also complement the global information provided by topic models. Section 3.3 describes our approaches for directing user’s local attention.
3 Study Conditions
Our goal is to characterize how local and global knowledge can aid users in annotating a dataset. This section describes our four experimental con-ditions and outlines the user’s process for labeling documents.
3.1 Study Design
The study uses a2×2between-subjects design, with factors of document collectionoverview(two levels: topic model or list) and documentselection (two levels: active or random). The four conditions, with theTAcondition representingALTO, are:
1. Topic model overview, active selection (TA) 2. Topic model overview, random selection (TR) 3. List overview, active selection (LA)
4. List overview, random selection (LR)
3.2 Document Collection Overview
Main Interface
(a) Topic Overview (TA and TR)
(b) List Overview (LA and LR)
[image:3.595.73.527.65.245.2]OR
Figure 1: Our annotation system. Initially, the user sees lists of documents organized in either a list format or grouped into topics (only two topics are shown here; users can scroll to additional documents). The user can click on a document to label it.
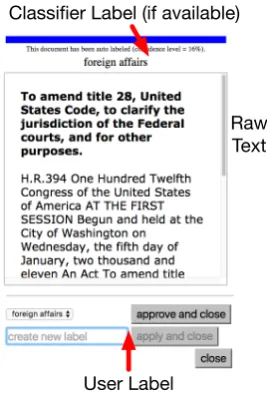
Classifier Label (if available)
Raw Text
User Label
Figure 2: After clicking on a document from the list or topic overview, the user inspects the text and provides a label. If the classifier has a guess at the label, the user can confirm the guess.
3.3 Document Selection
We use a preference function U to direct users’ attention to specific documents. To provide con-sistency across the four conditions, each condition will highlight the document that scores the highest for the condition’s preference function. For the random selection conditions,TRandLR, document selection is random, within a topic or globally. We expect this to be less useful than active learning. The document preference functions are:
User-Labeled Documents
Classifier-Labeled Documents
[image:3.595.312.524.323.461.2]Selected Document
Figure 3: After the user has labeled some docu-ments, the system can automatically label other documents and select which documents would be most helpful to annotate next. In the random selec-tion setting, random documents are selected.
LA:LAuses traditional uncertainty sampling:
UdLA =HC[Yd], (1) whereHC[yd] = −PiP(yi|d)logP(yi|d)is the classifier entropy. Entropy measures how confused (uncertain) classifierCis about its prediction of a documentd’s labely. Intuitively, it prefers docu-ments the classifier suggests many labels instead of a single, confident prediction.
LR:LR’s approach is the same asLA’s except we replaceHC[yd]with a uniform random number:
[image:3.595.107.241.325.522.2]TA: Dasgupta and Hsu (2008) argue that clustering should inform active learning criteria, balancing coverage against classifier accuracy. We adapt their method to flat topic models—in contrast to their hierarchical cluster trees—by creating a composite measure of document uncertainty within a topic:
UdTA =HC[yd]θd,k, (3)
where k is the prominent topic for document d.
UTA
d prefers documents that arerepresentativeof a topic (i.e., have a high value ofθd,kfor that topic) and are informative for the classifier.
TR: TR’s approach is the same asTA’s except we replaceHC[Yd]with a uniformly random number:
UdTR=unif(0,1)θd,k. (4)
Similar toTA,UdTRprefers documents that are rep-resentative of a topic, but not any particular docu-ment in the topic. Incorporating the random com-ponent encourages covering different documents in diverse topics.
InLAand LR, the preference function directly chooses a document and directs the user to it. On the other hand,UTA
d andUdTRare topic dependent.
TAemphasizes documents that are both informative to the classifier and representative of a topic; if a document is not representative, the surrounding context of a topic will be less useful. Therefore, the factorθd,kappears in both. Thus, they require that a topic be chosen first and then the document with maximum preference,U, within that topic can be chosen. InTR, the topic is chosen randomly. In TA, the topic is chosen by
k∗ = arg max
k (mediand(HC[yd]θd,k). (5) That is the topic with the maximum median U. Median encodes how “confusing” a topic is.2 In
other words, topick∗is the topic that its documents confuse the classifier most.
3.4 User Labeling Process
The user’s labeling process is the same in all four conditions. Theoverview(topic or list) allows users to examine individual documents (Figure 1). Click-ing on a document opens a dialog box (Figure 2) with the text of the document and three options:
1. Create and assign a new label to the document. 2. Choose an existing label for the document.
2Outliers skew other measures (e.g., max or mean).
3. Skip the document.
Once the user has labeled two documents with different labels, the displayed documents are re-placed based on the preference function (Sec-tion 3.3), every time the user labels (or updates labels for) a document. InTAandTR, each topic’s documents are replaced with the twenty highest ranked documents. InLAandLR, all documents are updated with the top20Kranked documents.3
The system also suggests one document to con-sider by auto-scrolling to it and drawing a red box around its title (Figure 3). The user may ignore that document and click on any other document. After the user labels ten documents, the classifier runs and assigns labels to other documents.4 For
classifier-labeled documents, the user can either approve the label or assign a different label. The process continues until the user is satisfied or a time runs out (forty minutes in our user study, Section 6). We use time to control for the varying difficulty of assigning document labels: active learning will se-lect more difficult documents to annotate, but they may be more useful; time is a more fair basis of comparison in real-world tasks.
4 Data and Evaluation Metrics
In this section, we describe our data, the machine learning techniques to learn classifiers from exam-ples, and the evaluation metrics to know whether the final labeling of the complete documents col-lection was successful.
4.1 Datasets
Data Our experiments require corpora to com-pare user labels with gold standard labels. We ex-periment with two corpora: 20Newsgroups (Lang, 2007) andUScongressional bills from GovTrack.5 ForUScongressional bills, GovTrack provides bill information such as the title and text, while the Congressional Bills Project (Adler and Wilker-son, 2006) provides labels and sub-labels for the bills. Examples of labels are agriculture and health, while sub-labels include agricultural trade and comprehensive health care reform. The twenty 3In all conditions, the number of displayed unlabeled
doc-uments is adjusted based on the number of manually labeled documents. i.e. if the user has labeledndocuments in topic
k,nmanually labeled documents followed by top20−n
uncertain documents will be shown in topick.
4To reduce user confusion, for each existing label, only the
top-level labels have been developed by consen-sus over many years by a team of top political scientists to create a reliable, robust dataset. We use the 112th Congress; after filtering,6this dataset
has5558documents. We use this dataset in both the synthetic experiments (Section 5) and the user study (Section 6).
The 20 Newsgroups corpus has 19,997 docu-ments grouped in twenty news groups that are fur-ther grouped into six more general topics. Ex-amples are talk.politics.guns and sci.electronics, which belong to the general topics of politics and science. We use this dataset in synthetic experi-ments (Section 5).
4.2 Machine Learning Techniques
Topic Modeling To choose the number of topics (K), we calculate average topic coherence (Lau et al., 2014) onUSCongressional Bills, between ten and forty topics and chooseK= 19, as it has the maximum coherence score. For consistency, we use the same number of topics (K = 19) for 20 Newsgroups corpus. After filtering words based onTF-IDF, we use Mallet (McCallum, 2002) with default options to learn topics.
Features and Classification A logistic regres-sion predicts labels for documents and provides the classification uncertainty for active learning. To make classification and active learning updates efficient, we use incremental learning (Carpenter, 2008, LingPipe). We update classification param-eters using stochastic gradient descent, restarting with the previously learned parameters as new la-beled documents become available.7 We use cross
validation, using argmax topics as surrogate labels, to set the parameters for learning the classifier.8
The features for classification include topic prob-abilities, unigrams, and the fraction of labeled doc-uments in each document’s prominent topic. The intuition behind adding this last feature is to allow active learning to suggest documents in a diverse 6We remove bills that have less than fifty words, no
as-signed gold label, duplicate titles, or have the gold labelGOV -ERNMENT OPERATIONS or SOCIAL WELFARE, which are
broad and difficult for users to label.
7Exceptions are when a new label is added, a document’s
label is deleted, or a label is deleted. In those cases, we train the classifier from scratch. Also, for final results in Section 6, we train a classifier from scratch.
8We use blockSize= 1
#examples minEpochs=100,
learningRate=0.1, minImprovement=0.01, maxEpochs=1000, and rollingAverageSize=5. The regression is unregularized.
range of topics if it finds this feature a useful indi-cator of uncertainty.9
4.3 Evaluation Metrics
Our goal is to create a system that allows users to quickly induce a high-quality label set. We com-pare the user-created label sets against the data’s gold label sets. Comparing different clusterings is a difficult task, so we use three clustering evaluation metrics: purity (Zhao and Karypis, 2001), rand index (Rand, 1971, RI), and normalized mutual information (Strehl and Ghosh, 2003,NMI).10 Purity The documents labeled with a good user label should only have one (or a few) gold labels associated with them: this is measured by cluster purity. Given each user cluster, it measures what fraction of the documents in a user cluster belong to the most frequent gold label in that cluster:
purity(Ω,G) = N1 X
l
max
j |Ωl∩Gj|, (6)
where L is the number of labels user creates, Ω = {Ω1,Ω2, . . . ,ΩL} is the user clustering of documents,G = {G1, G2, . . . , GJ}is gold clus-tering of documents, andN is the total number of documents. The userΩland goldGj labels are in-terpreted as sets containing all documents assigned to that label.
Rand index (RI) RIis apair countingmeasure, where cluster evaluation is considered as a series of decisions. If two documents have the same gold label and the same user label (TP) or if they do not have the same gold label and are not assigned the same user label (TN), the decision is right. Other-wise, it is wrong (FP,FN). RImeasures the percent-age of decisions that are right:
RI= T P +F PT P++T NT N+F N. (7)
Normalized mutual information (NMI) NMIis an information theoretic measure that measures the amount of information one gets about the gold clusters by knowing what the user clusters are:
NMI(Ω,G) = 2I(Ω,G)
HΩ+HG, (8) 9However, final classifier’s coefficients suggested that this
feature did not have a large effect.
10We avoided using adjusted rand index (Hubert and
where Ωand Gare user and gold clusters, His the entropy andIis mutual information (Bouma, 2009).
While purity, RI, and NMI are all normalized within [0,1](higher is better), they measure dif-ferent things. Purity measures the intersection be-tween two clusterings, it is sensitive to the number of clusters, and it is not symmetric.
On the other hand,RIandNMIare less sensitive to the number of clusters and are symmetric. RI measures pairwise agreement in contrast to purity’s emphasis on intersection. Moreover,NMImeasures shared information between two clusterings.
None of these metrics are perfect: purity can be exploited by putting each document in its own label, RI does not distinguish separating similar documents with distinct labels from giving dissimi-lar documents the same label, andNMI’s ability to compare different numbers of clusters means that it sometimes gives high scores for clusterings by chance. Given the diverse nature of these metrics, if a labeling does well in all three of them, we can be relatively confident that it is not a degenerate solution that games the system.
5 Synthetic Experiments
Before running a user study, we test our hypothe-sis that topic model overviews and active learning selection improve final cluster quality compared to standard baselines: list overview and random selection. We simulate the four conditions on Con-gressional Bills and 20 Newsgroups.
Since we believe annotators create more specific labels compared to the gold labels, we use sub-labels as simulated user sub-labels and sub-labels as gold labels (we give examples of labels and sub-labels in Section 4.1). We start with two randomly selected documents that have different sub-labels, assign the corresponding sub-labels, then add more labels based on each condition’s preference function (Sec-tion 3.3). We follow the condi(Sec-tion’s preference function and incrementally add labels until 100 documents have been labeled (100 documents are representative of what a human can label in about an hour). Given these labels, we compute purity,RI, andNMIover time. This procedure is repeated fif-teen times (to account for the randomness of initial document selections and the preference functions with randomness).11
11Synthetic experiment data available at http:
//github.com/Pinafore/publications/tree/
Congress (Synth) Newsgroups (Synth)
●
● ● ● ● ● ● ● ● ●
● ●
● ● ● ● ● ● ● ●
●
● ● ● ● ● ● ● ● ● ●
● ● ● ● ● ● ● ● ●
●
● ● ● ● ● ● ● ●
●
●
● ● ● ●
● ● ● ● ●
0.4 0.6 0.8
0.75 0.80 0.85 0.90
0.2 0.3 0.4 0.5
pur
ity
RI
NMI
25 50 75 100 25 50 75 100
Documents Labeled
Median (o
v
er 15 r
uns)
[image:6.595.311.523.76.359.2]condition ● LA LR TA TR
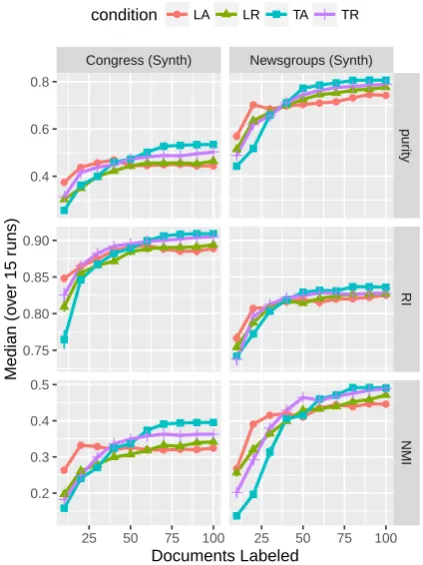
Figure 4: Synthetic results onUS Congressional Bills and 20 Newsgroups data sets. Topic models help guide annotation attention to diverse segments of the data.
Synthetic results validate our hypothesis that topic overview and active learning selection can help label a corpus more efficiently (Figure 4). LA shows early gains, but tends to falter eventu-ally compared to both topic overview and topic overview combined with active learning selection (TRandTA).
However, these experiments do not validate ALTO. Not all documents require the same time or effort to label, and active learning focuses on the hardest examples, which may confuse users. Thus, we need to evaluate how effectively actual users annotate a collection’s documents.
6 User Study
Following the synthetic experiments, we conduct a user study with forty participants to evaluateALTO (TA condition) against three alternatives that lack topic overview (LA), active learning selection (TR), or both (LR) (Sections 6.1 and 6.2). Then, we con-duct a crowdsourced study to compare the overall
● ● ●
● ● ● ● ●
● ●
● ● ● ● ●
●
● ● ●
● ● ● ● ●
0.2 0.3 0.4 0.5
0.70 0.75 0.80 0.85 0.90
0.1 0.2 0.3
Pur
ity
RI
NMI
10 20 30 40
Elapsed Time (min)
Median (o
v
er par
ticipants)
[image:7.595.310.524.62.120.2]condition ● LA LR TA TR
Figure 5: User study results onUSCongressional Bills dataset. Active learning selection helps ini-tially, but the combination of active learning selec-tion and topic model overview has highest quality labels by the end of the task.
effectiveness of the label set generated by the par-ticipants in the four conditions (Section 6.3).
6.1 Method
We use the freelance marketplace Upwork to re-cruit online participants.12 We require participants
to have more than 90% job success on Upwork, English fluency, andUSresidency. Participants are randomly assigned to one of the four conditions and we recruited ten participants per condition.
Participants completed a demographic question-naire, viewed a video of task instructions, and then interacted with the system and labeled documents until satisfied with the labels or forty minutes had elapsed.13 The session ended with a survey, where
participants rated mental, physical, and temporal demand, and performance, effort, and frustration on 20-point scales, using questions adapted from the NASA Task Load Index (Hart and Staveland, 1988, TLX). The survey also included 7-point scales for ease of coming up with labels, usefulness and satisfaction with the system, and—forTRand
12http://Upwork.com
13Forty minutes of activity, excluding system time to
clas-sify and update documents. Participants nearly exhausted the time:39.3average minutes inTA,38.8inTR,40.0inLA, and
35.9inLR.
F p
Overview Selection Overview Selection final purity 81.03 7.18 < .001 .011
finalRI 39.89 6.28 < .001 .017 finalNMI 70.92 9.87 < .001 .003
[image:7.595.76.287.79.304.2]df(1,36) for all reported results
Table 2: Results from 2 ×2 ANOVA with ART analyses on the final purity,RI, andNMImetrics. Only main effects for the factors ofoverviewand selection are shown; no interaction effects were statistically significant. Topics and active learning both had significant effects on quality scores.
TA—topic information helpfulness. Each partici-pant was paid fifteen dollars.14
For statistical analysis, we primarily use2×2
(overview×selection)ANOVAs with Aligned Rank Transform (Wobbrock et al., 2011,ART), which is a non-parametric alternative to a standardANOVA that is appropriate when data are not expected to meet the normality assumption ofANOVA. 6.2 Document Cluster Evaluation
We analyze the data by dividing the forty-minute labeling task into five minute intervals. If a par-ticipant stops before the time limit, we consider their final dataset to stay the same for any remain-ing intervals. Figure 5 shows the measures across study conditions, with similar trends for all three measures.
Topic model overview and active learning both significantly improve final dataset measures.
The topic overview and active selection conditions significantly outperform the list overview and ran-dom selection, respectively, on the final label qual-ity metrics. Table 2 shows the results of separate
2×2ANOVAs withARTwith each of final purity, RI, andNMIscores. There are significant main ef-fects ofoverviewandselectionon all three metrics; no interaction effects were significant.
TR outperforms LA. Topic models by them-selves outperform traditional active learning strate-gies (Figure 5).LAperforms better thanLR; while active learning was useful, it was not as useful as the topic model overview (TRandTA).
LA provides an initial benefit. Average purity,
NMIandRIwere highest withLAfor the earliest labeling time intervals. Thus, when time is very 14User study data available athttp://github.com/
M ± SD[median]
purity RI NMI
[image:8.595.76.289.62.116.2]TA 0.31±0.08 [0.32] 0.80±0.05 [0.80] 0.19±0.08 [0.21] TR 0.32±0.09 [0.31] 0.82±0.04 [0.82] 0.21±0.09 [0.20] LA 0.35±0.05 [0.35] 0.82±0.04 [0.81] 0.27±0.05 [0.28] LR 0.31±0.04 [0.31] 0.79±0.04 [0.79] 0.19±0.03 [0.19]
Table 3: Mean, standard deviation, and median purity,RI, andNMIafter ten minutes. NMIin partic-ular shows the benefit ofLAover other conditions at early time intervals.
limited, using traditional active learning (LA) is preferable to topic overviews; users need time to explore the topics and a subset of documents within them. Table 3 shows the metrics after ten minutes. Separate2×2ANOVAs withARTon the means of purity,NMIandRIrevealed a significant interaction effect betweenoverviewandselectionon meanNMI (F(1,36) = 5.58,p=.024), confirming the early performance trends seen in Figure 5 at least for NMI. No other main or interaction effects were significant, likely due to low statistical power.
Subjective ratings. Table 4 shows the average scores given for the six NASA-TLX questions in different conditions. Separate2×2ANOVAwith ARTfor each of the measures revealed only one significant result: participants who used the topic model overview find the task to be significantly less frustrating (M = 4.2andmedian= 2) than those who used the list overview (M = 7.3 and
median= 6.5) on a scale from 1 (low frustra-tion) to 20 (high frustrafrustra-tion) (F(1,36) = 4.43,
p=.042), confirming that the topic overview helps users organize their thoughts and experience less stress during labeling.
Participants in the TA and TR conditions rate topic information to be useful in completing the task (M = 5.0andmedian= 5) on a scale from 1 (not useful at all) to 7 (very useful). Over-all, users are positive about their experience with the system. Participants in all conditions rate overall satisfaction with the interface positively (M = 5.8andmedian= 6) on a scale from 1 (not satisfied at all) to 7 (very satisfied).
Discussion. One can argue that using topic overviews for labeling could have a negative ef-fect: users may ignore the document content and focus on topics for labeling. We tried to avoid this issue by making it clear in the instructions that they need to focus on document content and use top-ics as a guidance. On average, the participants in
TRcreate 1.96 labels per topic and the participants inTAcreated 2.26 labels per topic. This suggests that participants are going beyond what they see in topics for labeling, at least in theTAcondition. 6.3 Label Evaluation Results
Section 6.2 compares clusters of documents in dif-ferent conditions against the gold clusters but does not evaluate the quality of the labels themselves. Since one of the main contributions ofALTOis to accelerate inducing a high quality label set, we use crowdsourcing to assess how the final induced label sets compare in different conditions.
For completeness, we also compare labels against a fully automatic labeling method (Aletras and Stevenson, 2014) that does not require human intervention. We assignautomaticlabels to docu-ments based on their most prominent topic.
We ask users on a crowdsourcing platform to votefor the “best” and “worst” label that describes the content of a US congressional bill (we use Crowdflower restricted toUScontributors).
Five users label each document and we use the aggregated results generated by Crowdflower. The user gets $0.20 for each task.
We randomly choose200documents from our dataset (Section 4.1). For each chosen document, we randomly choose a participant from all four con-ditions (TA, TR, LA, LR). The labels assigned in different conditions and the automatic label of the document’s prominent topic construct the candi-date labels for the document.15 Identical labels are
merged into one label to avoid showing duplicate labels to users. If a merged label gets a “best” or “worst” vote, we split that vote across all the identi-cal instances.16 Figure 6 shows the average number
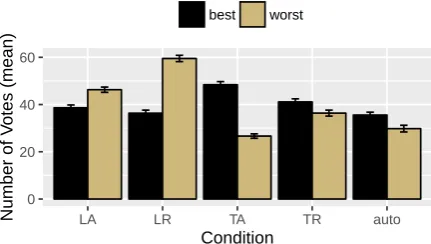
of “best” and “worst” votes for each condition and the automatic method.ALTO(TA) receives the most “best” votes and the fewest “worst” votes. LR
re-ceives the most worst votes. The automatic labels, interestingly, appear to do at least as well as the list view labels, with a similar number of best votes and fewer worst votes. This indicates that automatic labels have reasonable quality compared to at least some manually generated labels. However, when users are provided with a topic model overview—
15Some participants had typos in the labels. We corrected
all the typos using pyEnchant (http://pythonhosted. org/pyenchant/) spellchecker. If the corrected label was still wrong, we corrected it manually.
16Evaluation data available athttp://github.com/
M ± SD[median]
Condition Mental Demand Physical Demand Temporal Demand Performance Effort Frustration
[image:9.595.78.294.214.336.2]TA 9.8 ± 5.6 [10] 2.9 ± 3.4 [2] 9 ± 7.8 [7] 5.5 ± 5.8 [1.5] 9.4 ± 6.3 [10] 4.5 ± 5.5 [1.5] TR 10.6 ± 4.5 [11] 2.4 ± 2.8 [1] 7.4 ± 4.1 [9] 8.8 ± 6.1 [7.5] 9.8 ± 3.7 [10] 3.9 ± 3.0 [3.5] LA 9.1 ± 5.5 [10] 1.7 ± 1.3 [1] 10.2 ± 4.8 [11] 8.6 ± 5.3 [10] 10.7 ± 6.2 [12.5] 6.7 ± 5.1 [5.5] LR 9.8 ± 6.1 [10] 3.3 ± 2.9 [2] 9.3 ± 5.7 [10] 9.4 ± 5.6 [10] 9.4 ± 6.2 [10] 7.9 ± 5.4 [8]
Table 4: Mean, standard deviation, and median results fromNASA-TLXpost-survey. All questions are scaled 1 (low)–20 (high), except performance, which is scaled 1 (good)–20 (poor). Users found topic model overview conditions,TRandTA, to be significantly less frustrating than the list overview conditions.
0 20 40 60
LA LR TA TR auto
Condition
Number of V
otes (mean)
best worst
Figure 6: Best and worst votes for document labels. Error bars are standard error from bootstrap sample. ALTO(TA) gets the most best votes and the fewest worst votes.
with or without active learning selection—they can generate label sets that improve upon automatic labels and labels assigned without the topic model overview.
7 Related Work
Text classification—a ubiquitous machine learning tool for automatically labeling text (Zhang, 2010)— is a well-trodden area ofNLPresearch. The diffi-culty is often creating the training data (Hwa, 2004; Osborne and Baldridge, 2004); coding theory is an entire subfield of social science devoted to creating, formulating, and applying labels to text data (Sal-dana, 2012; Musialek et al., 2016). Crowdsourc-ing (Snow et al., 2008) and active learnCrowdsourc-ing (Settles, 2012), can decrease the cost of annotation but only aftera label set exists.
ALTO’s corpus overviews aid text understanding, building on traditional interfaces for gaining both local and global information (Hearst and Peder-sen, 1996). More elaborate interfaces (Eisenstein et al., 2012; Chaney and Blei, 2012; Roberts et al., 2014) provide richer information given a fixed topic model. Alternatively, because topic
mod-els are imperfect (Boyd-Graber et al., 2014), re-fining underlying topic models may also improve users’ understanding of a corpus (Choo et al., 2013; Hoque and Carenini, 2015).
Summarizing document collections through dis-covered topics can happen through raw topics la-beled manually by users (Talley et al., 2011), auto-matically (Lau et al., 2011), or by learning a map-ping from labels to topics (Ramage et al., 2009). When there is not a direct correspondence between topics and labels, classifiers learn a mapping (Blei and McAuliffe, 2007; Zhu et al., 2009; Nguyen et al., 2015). Because we want topics to be consistent between users, we use a classifier with static topics inALTO. Combining our interface with dynamic topics could improve overall labeling, perhaps at the cost of introducing confusion as topics change during the labeling process.
8 Conclusion and Future Work
We introduceALTO, an interactive framework that combines both active learningselections with topic modeloverviews to both help users induce a label set and assign labels to documents. We show that users can more effectively and efficiently induce a label set and create training data using ALTO in comparison with other conditions, which lack either topicoverviewor activeselection.
We can further improveALTOto help users gain better and faster understanding of text corpora. Our current system limits users to view only20K docu-ments at a time and allows for one label assignment per document. Moreover, the topics are static and do not adapt to better reflect users’ labels. Users should have better support for browsing documents and assigning multiple labels.
Acknowledgments
We thank the anonymous reviewers, David Mimno, Edward Scott Adler, Philip Resnik, and Burr Settles for their insightful comments. We also thank Niko-laos Aletras for providing the automatic topic label-ing code. Boyd-Graber and Poursabzi-Sangdeh’s contribution is supported by NSF Grant NCSE -1422492; Findlater, Seppi, and Boyd-Graber’s con-tribution is supported by collaborativeNSFGrant IIS-1409287 (UMD) andIIS-1409739 (BYU). Any opinions, findings, results, or recommendations expressed here are of the authors and do not neces-sarily reflect the view of the sponsor.
References
E Scott Adler and John Wilkerson. 2006. Congres-sional bills project. NSF, 880066:00880061.
Nikolaos Aletras and Mark Stevenson. 2014. La-belling topics using unsupervised graph-based meth-ods. InProceedings of the Association for Computa-tional Linguistics, pages 631–636.
Pranav Anand, Joseph King, Jordan L Boyd-Graber, Earl Wagner, Craig H Martell, Douglas W Oard, and Philip Resnik. 2011. Believe me-we can do this! annotating persuasive acts in blog text. In Computa-tional Models of Natural Argument.
David M. Blei and Jon D. McAuliffe. 2007. Super-vised topic models. InProceedings of Advances in Neural Information Processing Systems.
David M. Blei, Andrew Ng, and Michael Jordan. 2003. Latent Dirichlet allocation. Journal of Machine Learning Research, 3.
Gerlof Bouma. 2009. Normalized (pointwise) mutual information in collocation extraction. InThe Bien-nial GSCL Conference, pages 31–40.
Jordan Boyd-Graber, David Mimno, and David New-man. 2014. Care and feeding of topic models: Prob-lems, diagnostics, and improvements. Handbook of Mixed Membership Models and Their Applications; CRC Press: Boca Raton, FL, USA.
Ian Budge. 2001. Mapping policy preferences: esti-mates for parties, electors, and governments, 1945-1998, volume 1. Oxford University Press.
Bob Carpenter. 2008. Lingpipe 4.1.0. http:// alias-i.com/lingpipe.
Allison Chaney and David Blei. 2012. Visualizing topic models. InInternational AAAI Conference on Weblogs and Social Media.
Jaegul Choo, Changhyun Lee, Chandan K. Reddy, and Haesun Park. 2013. UTOPIAN: User-driven topic modeling based on interactive nonnegative matrix factorization. IEEE Transactions on Visualization and Computer Graphics, 19(12):1992–2001. Sanjoy Dasgupta and Daniel Hsu. 2008. Hierarchical
sampling for active learning. InProceedings of the International Conference of Machine Learning. Jacob Eisenstein, Duen Horng Chau, Aniket Kittur, and
Eric Xing. 2012. TopicViz: interactive topic ex-ploration in document collections. InInternational Conference on Human Factors in Computing Sys-tems.
Sandra G Hart and Lowell E Staveland. 1988. De-velopment of nasa-tlx (task load index): Results of empirical and theoretical research. Advances in psy-chology, 52:139–183.
M.A. Hearst and J.O. Pedersen. 1996. Reexamining the cluster hypothesis: scatter/gather on retrieval re-sults. In Proceedings of the ACM SIGIR Confer-ence on Research and Development in Information Retrieval.
Enamul Hoque and Giuseppe Carenini. 2015. Con-visit: Interactive topic modeling for exploring asyn-chronous online conversations. In Proceedings of the 20th International Conference on Intelligent User Interfaces, IUI ’15.
Yuening Hu, Jordan Boyd-Graber, Brianna Satinoff, and Alison Smith. 2014. Interactive topic modeling.
Machine learning, 95(3):423–469.
Lawrence Hubert and Phipps Arabie. 1985. Compar-ing partitions. Journal of classification, 2(1):193– 218.
Rebecca Hwa. 2004. Sample selection for statistical parsing.Computational linguistics, 30(3):253–276. Mohit Iyyer, Peter Enns, Jordan L Boyd-Graber, and
Philip Resnik. 2014. Political ideology detection using recursive neural networks. InProceedings of the Association for Computational Linguistics. Edward F Kelly and Philip J Stone. 1975.
Com-puter recognition of English word senses, volume 13. North-Holland.
Soo-Min Kim and Eduard Hovy. 2004. Determining the sentiment of opinions. InProceedings of the As-sociation for Computational Linguistics, page 1367. Association for Computational Linguistics.
Hans-Dieter Klingemann, Andrea Volkens, Judith Bara, Ian Budge, Michael D McDonald, et al. 2006.
Mapping policy preferences II: estimates for parties, electors, and governments in Eastern Europe, Euro-pean Union, and OECD 1990-2003. Oxford Univer-sity Press Oxford.
Jey Han Lau, Karl Grieser, David Newman, and Tim-othy Baldwin. 2011. Automatic labelling of topic models. InProceedings of the Association for Com-putational Linguistics, pages 1536–1545.
Jey Han Lau, David Newman, and Timothy Baldwin. 2014. Machine reading tea leaves: Automatically evaluating topic coherence and topic model quality. InProceedings of the European Chapter of the Asso-ciation for Computational Linguistics.
David D Lewis and William A Gale. 1994. A se-quential algorithm for training text classifiers. In
Proceedings of the 17th annual international ACM SIGIR conference on Research and development in information retrieval, pages 3–12. Springer-Verlag New York, Inc.
Andrew Kachites McCallum. 2002. Mal-let: A machine learning for language toolkit. http://www.cs.umass.edu/ mccallum/mallet.
Marina Meil˘a. 2003. Comparing clusterings by the variation of information. InLearning theory and ker-nel machines, pages 173–187. Springer.
Chris Musialek, Philip Resnik, and S. Andrew Stavisky. 2016. Using text analytic techniques to create effi-ciencies in analyzing qualitative data: A comparison between traditional content analysis and a topic mod-eling approach. InAmerican Association for Public Opinion Research.
Grace Ngai and David Yarowsky. 2000. Rule writing or annotation: Cost-efficient resource usage for base noun phrase chunking. InProceedings of the Associ-ation for ComputAssoci-ational Linguistics. Association for Computational Linguistics.
Thang Nguyen, Jordan Boyd-Graber, Jeff Lund, Kevin Seppi, and Eric Ringger. 2015. Is your anchor going up or down? Fast and accurate supervised topic mod-els. InConference of the North American Chapter of the Association for Computational Linguistics. Sonya Nikolova, Jordan Boyd-Graber, and Christiane
Fellbaum. 2011. Collecting semantic similarity ratings to connect concepts in assistive communica-tion tools. InModeling, Learning, and Processing of Text Technological Data Structures, pages 81–93. Springer.
Miles Osborne and Jason Baldridge. 2004. Ensemble-based active learning for parse selection. In Con-ference of the North American Chapter of the Asso-ciation for Computational Linguistics, pages 89–96. Citeseer.
Daniel Ramage, David Hall, Ramesh Nallapati, and Christopher Manning. 2009. Labeled LDA: A su-pervised topic model for credit attribution in multi-labeled corpora. InProceedings of Empirical Meth-ods in Natural Language Processing.
William M Rand. 1971. Objective criteria for the eval-uation of clustering methods. Journal of the Ameri-can Statistical association, 66(336):846–850.
Margaret E Roberts, Brandon M Stewart, Dustin Tingley, Christopher Lucas, Jetson Leder-Luis, Shana Kushner Gadarian, Bethany Albertson, and David G Rand. 2014. Structural topic models for open-ended survey responses. American Journal of Political Science, 58(4):1064–1082.
J. Saldana. 2012. The Coding Manual for Qualitative Researchers. SAGE Publications.
Burr Settles. 2012. Active learning (synthesis lec-tures on artificial intelligence and machine learning).
Long Island, NY: Morgan & Clay Pool.
H Sebastian Seung, Manfred Opper, and Haim Som-polinsky. 1992. Query by committee. In Proceed-ings of the fifth annual workshop on Computational learning theory, pages 287–294. ACM.
Rion Snow, Brendan O’Connor, Daniel Jurafsky, and Andrew Ng. 2008. Cheap and fast—but is it good? Evaluating non-expert annotations for natural lan-guage tasks. InProceedings of Empirical Methods in Natural Language Processing.
Alexander Strehl and Joydeep Ghosh. 2003. Cluster ensembles—a knowledge reuse framework for com-bining multiple partitions. The Journal of Machine Learning Research, 3:583–617.
Edmund M. Talley, David Newman, David Mimno, Bruce W. Herr, Hanna M. Wallach, Gully A. P. C. Burns, A. G. Miriam Leenders, and Andrew McCal-lum. 2011. Database of NIH grants using machine-learned categories and graphical clustering. Nature Methods, 8(6):443–444, May.
Katrin Tomanek, Joachim Wermter, and Udo Hahn. 2007. An approach to text corpus construction which cuts annotation costs and maintains reusabil-ity of annotated data. In Proceedings of Empiri-cal Methods in Natural Language Processing, pages 486–495.
Paul MB Vit´anyi, Frank J Balbach, Rudi L Cilibrasi, and Ming Li. 2009. Normalized information dis-tance. InInformation theory and statistical learning, pages 45–82. Springer.
Jacob O Wobbrock, Leah Findlater, Darren Gergle, and James J Higgins. 2011. The aligned rank trans-form for nonparametric factorial analyses using only anova procedures. In Proceedings of the SIGCHI Conference on Human Factors in Computing Sys-tems, pages 143–146. ACM.
Tong Zhang. 2010. Fundamental statistical techniques. In Nitin Indurkhya and Fred J. Damerau, editors,
Handbook of Natural Language Processing. Chap-man & Hall/CRC, 2nd edition.