1
Agonistic interactions in female
New Zealand fur seals:
the functions of conspecific aggression
and its implications in spatial
population dynamics
A thesis submitted in partial fulfilment of the requirements for the Degree of Master of Science in Biological Science
at the University of Canterbury
By Juliet N. Kim University of Canterbury
3
Table of Contents
Table of Contents ... 3
Table of Figures ... 6
List of Tables ... 9
Acknowledgements ... 11
Abstract ... 13
Introduction ... 15
Coloniality and spatial population dynamics ... 15
Coloniality in Pinnipeds ... 18
Conspecific female aggression and territoriality ... 21
Conspecific aggression in pinnipeds ... 22
Fur seals ... 25
New Zealand fur seals ... 26
Conflicts between humans and seals ... 27
Statement of the problem ... 31
Thesis aims ... 32
Methods ... 34
Ohau Point seal colony ... 34
Sampling methods ... 36
Focal-animal sampling ... 37
Identification of individuals ... 39
Quantification of agonistic interactions ... 41
Pup presence ... 45
4
Birthing and nursing periods ... 46
Mapping of site occupancy ... 46
Data Analysis ... 48
Preparation of data ... 48
Statistical analysis ... 49
Results ... 52
Environmental influences on behaviour ... 52
Biotic influences on behaviour ... 58
Presence of dominant males ... 63
Neighbour density and distance ... 64
Presence and absence of filial pup ... 67
Focal female locations ... 71
Nearest female neighbour distance ... 80
Rookery carrying capacity ... 84
Discussion ... 85
Conspecific female aggression in the study population ... 85
Thermoregulation ... 86
Population density and dispersion ... 90
Influence of dominant males ... 93
Offspring defence ... 95
Breeding site choice ... 99
Female spacing ... 102
Carrying capacity predictions and female dispersion ... 103
Implications ... 110
5
Conclusion ... 115
Research findings ... 115
Bibliography ... 119
6
Table of Figures
Figure 1. Map of New Zealand with an arrow marking the location of Kaikoura. Google Earth imagery shows a bird’s eye view of the Ohau Point seal colony, with the study area marked with a white rectangle. ... 35 Figure 2. Study area at mid-high tide, looking down from the vantage point. This view
shows most of the study area, with the north and south borders of the area within c. 5 m from the left and right edges of the image. The primary pool can be seen near the center of the image. ... 36 Figure 3. Examples of identifiable female New Zealand fur seals. a. Female with a yellow Allflex ® tag on the posterior edge of her right flipper. b. Female with light coloured spots on the forehead and near the rump... 40 Figure 4. a. Threat behaviour shown by the focal female (center of image) with her pup
(dry pup suckling from the female) towards a non-filial pup (wet pup left of the female, emerging out from the pool). b. Threat-exaggeration from the focal female to the non-filial pup, with her neck elongated towards the opponent. c. Lunge behaviour in progress, as the female orients her mouth towards the opponent and elongates neck in an attempt to make contact. The opponent is in the process of returning to the pool. d. Bite, as lunge results in a contact with the opponent and mouth grabs a part of the opponent... 42 Figure 5. Example of aggression distance measurement process using PhiMatrix grid
(white grid in the center) and Screen Caliper (caliper shown in the upper area), with GOM Media Player used for video playback. Focal female at the center of the image with filial pup. ... 44 Figure 6. Bird’s eye view of the study area at mid-tide, created from a video taken by a
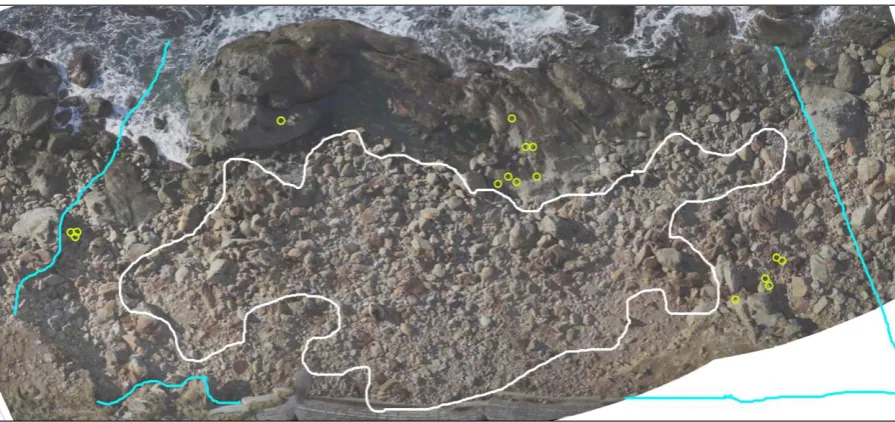
quadcopter (kindly provided by O.Gooday) using PTGui and Adobe Photoshop. White outline shows the birthing area, mapped by referring to site occupancy of all
7 (left) and southern (right) borders of the study area, while the bottom line shows the bottom edge of the cliff... 47 Figure 7. Number of focal female responses (m) as a factor of a. rock temperature and b.
time of day. ... 53 Figure 8. a. Focal females’ response distance (m) as a factor of rock temperature. b.
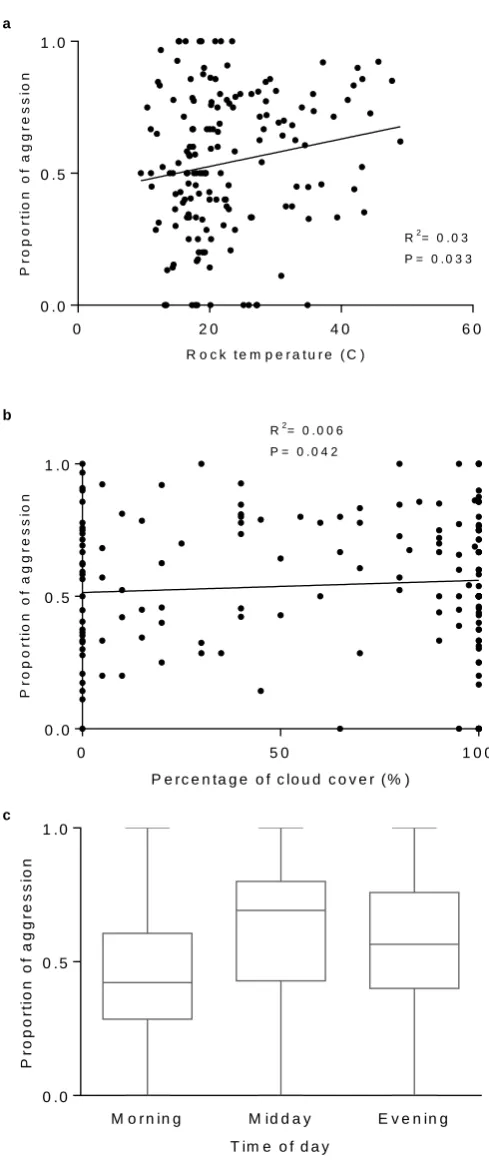
Focal females’ aggression distance (m) as a factor of rock temperature. ... 54 Figure 9. a. Proportion of focal female aggression as a factor of rock temperature. b.
Proportion of focal female aggression as a factor of cloud cover. c. Proportion of focal female aggression as a factor of time of day. ... 55 Figure 10. Highest intensity of aggression displayed by focal females as a factor of rock
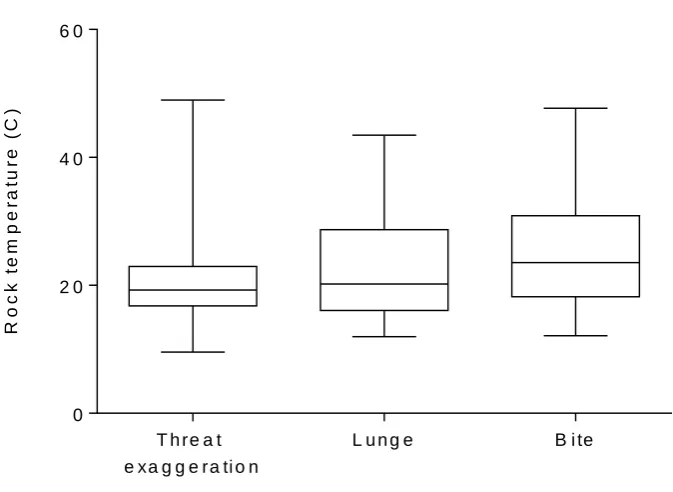
temperature. ... 56 Figure 11. Rock temperature recorded at the study site during the study period shown
as different times of day. The highest rock temperatures were recorded during mid-day, but rock temperature greatly varied over the study period. ... 57 Figure 12. a. Number of focal female responses as a factor of study area population. b.
Number of focal female responses as a factor of number of neighbours. ... 59 Figure 13. Focal females’ response distance (m) as a factor of proportion of focal female
aggression. ... 60 Figure 14. Proportion of focal female aggression as a factor of a. number of encounters
with conspecifics, b. number of female neighbours of focal females. ... 61 Figure 15. a. Comparison of the study site female population between the birthing and
nursing periods. b. Comparison of number of female neighbours of focal females between the birthing and nursing periods. ... 62 Figure 16. Number of focal females’ pup neighbours as a factor of focal females’
aggression distance (m). ... 64 Figure 17. Proportion of aggression as a factor of number of female neighbours. ... 65 Figure 18.a. Distance of neighbouring males from focal female (m) as a factor of
proportion of focal female aggression. b. Number of neighouring females from focal female as a factor of proportion of focal female aggression. ... 66 Figure 19. a. Focal females’ response distance (m) towards all opponents compared
8 Figure 20. a. Focal females’ response distance (m) towards female opponents compared
between presence and absence of focal offspring, (mean and standard error bars). b. Focal females’ aggression distance (m) towards female opponents compared
between presence and absence of focal offspring. ... 69 Figure 21. a. Focal females’ response distance (m) towards non- filial pups compared
between presence and absence of focal offspring (mean and standard error bars). b. Focal females’ aggression distance (m) towards non- filial pups compared between presence and absence of focal offspring. ... 70 Figure 22. a. Focal female locations’ distance from the sea (m) as a factor of rock
temperature. b. Focal female locations’ distance from the nearest pool (m) as a factor of rock temperature. ... 72 Figure 23. a. Number of neighbours of focal females as a factor of focal female locations’
distance from the sea (m). b. Number of neighbours of focal females as a factor of focal female locations’ distance from the nearest pool (m). c. Number of neighbours of focal females compared between rock sizes of focal female location. ... 73 Figure 24. a. Number of female neighbours of focal females as a factor of distance to the
nearest pool (m). b. Number of female neighbours of focal females compared
between rock sizes of focal female location. ... 74 Figure 25. a. Proportion of focal female aggression during birthing period as a factor of
the focal female location’s distance from the sea (m). b. Proportion of focal female aggression during the birthing period as a factor of the focal female location’s
distance from the pool (m). ... 76 Figure 26. a. Focal female location’s distance from the sea (m) as a factor of number of
males in study area. b. Comparison of number of males in study area between various sizes of rocks of focal female locations. ... 77 Figure 27. a. Comparison of the focal female locations’ distance from the sea (m)
between birthing and nursing periods. b. Comparison of the focal female locations’ distance from the nearest pool (m) between birthing and nursing periods. c. Comparison of the size of rocks of focal female locations between birthing and
nursing periods (Size group guide: 1- 0.25 m, 2- 0.5 m, 3- 1 m, 4- 2 m). ... 79 Figure 28. a. Nearest- female neighbour distance (m) as a factor of rock temperature. b.
9 Figure 29. Nearest-female neighbour distance (m) as a factor of a. number of
neighbours of focal females, b. number of female neighbours of focal females. ... 82 Figure 30. Nearest-female neighbour distance (m) as a factor of a. focal females’
response distance (m), b. focal female locations’ distance to the nearest pool (m). .... 83
List of Tables
Table 1. The effects of environmental predictors on the frequency of focal female
responses towards approaching conspecifics. Nonparametric regression and Kruskal-Wallis tests were used. ... 134 Table 2. The effects of environmental predictors on the focal female response distance.
Multiple linear regression and ANOVA were used. ... 134 Table 3. The effects of environmental predictors on the focal female aggression distance.
Multiple linear regression and ANOVA were used. ... 134 Table 4. The effects of environmental predictors on the proportion of focal female
aggression. Nonparametric regression and Kruskal-Wallis test were used. ... 135 Table 5. The effects of proportion of female aggression, study area population and
number of neighbours of focal female on focal female response frequency.
Nonparametric regression was used. ... 135 Table 6. The effects of biotic predictors on focal female response distance. Multiple
linear regression was used. ... 135 Table 7. The effects of biotic predictors on the focal female aggression distance. Multiple linear regression was used. ... 135 Table 8. The effects of biotic predictors on proportion of focal female aggression.
Nonparametric regression was used. ... 136 Table 9. The effects of focal female aggression distance on the mean distance and
number of each neighbour demographic. Nonparametric regression and simple linear regression were used. ... 136 Table 10. The effects of proportion of focal female regression on the mean distance and
10 Table 11. The effects of distance of focal female from male neighbours and number of
female neighbours on proportion of focal female aggression. Nonparametric
regression was used. ... 137 Table 12. The effect of time of day on focal female locations’ distance from the sea and
the nearest pool. ANOVA and Kruskal-Wallis tests were used. ... 137 Table 13. The effects of the focal female locations’ distance from the sea, nearest pool,
size of rocks on number of neighbours and number of female neighbours of focal females. Nonparametric regression and Kruskal-Wallis tests were used. ... 137 Table 14. The effects of the focal female locations’ distance from the sea, nearest pool,
size of rocks on focal female response distance, aggression distance and proportion of aggression. Nonparametric regression, ANOVA and Kruskal-Wallis were used. .. 138 Table 15. The effects of the focal female locations’ distance from the sea and nearest
pool on focal female response distance, aggression distance, proportion of aggression and number of encounters during birthing period. Simple linear regression and nonparametric regression were used. ... 138 Table 16. The effects of the focal female locations’ distance from the sea and nearest
pool on focal female response distance, aggression distance and proportion of
aggression during nursing period. ... 139 Table 17. Effect of number of males during the study period and number of males
during the nursing period on the focal female location. Simple linear regression (distance from the sea), nonparametric regression (distance from the nearest pool) and ordinal logistic regression (rock size) were used. ... 139 Table 18. The effect of the environmental and biotic predictors on nearest female
neighbour distance from focal female. Ordinal logistic regression and Kruskal-Wallis test were used. ... 140 Table 19. Effect of focal female locations’ distance to the sea, nearest pool and size of
11
Acknowledgements
Firstly, I would like to thank my primary supervisor Dr. Sharyn Goldstien for giving me such an amazing opportunity to undertake a Master’s research in my field of interest. Thank you for your constant provision of knowledge, encouragement and support; you’ve really helped me to think more like a scientist and to enjoy the research process. I would also like to thank my secondary supervisor Dr. Ximena Nelson, for helping with the logistics of behaviour analyses, and providing me with detailed comments and advice on the writing and data presentation. Your input helped to strengthen my thesis and brought it up to a higher standard.
Thank you to Oliver Gooday for your extensive assistance in fieldwork, valuable help in proofreading and editing, and also for being a great company + a seal watching buddy during those summer days under that ridiculous sun. Over 300 hours of fieldwork and travel would not have been so entertaining without you.
Thank you to Jan Mckenzie for helping with the technical aspects of my fieldwork by providing me with all the necessary gear and advice, and for helping me stay safe during my time away from home. Thank you to Dr Daniel Gerhard of University of Canterbury Statistics Consulting and Jenny Harlow (senior academic tutor, Mathematics and Statistics) for your help in statistical analyses and data preparation.
A big thank you to Laura Boren of Department of Conservation for providing me with your extensive knowledge of the Ohau Point seal colony, fur seal behaviour and sexing of the seals. Fieldwork would have been much more difficult without your help. I would also like to show my gratitude to Canterbury Federation of Graduate Women, Royal Society of New Zealand and Department of Conservation for providing awards and funding, which allowed me to attend the 2015 New Zealand Marine Sciences Society Conference.
12 Thank you to Ngaire Perrin at the University of Canterbury Kaikoura Field Station, for your company and help, and for making my time in Kaikoura enjoyable.
Thanks also to the seals of the Ohau Point seal colony for helping me achieve my lifelong dream of entering the world of wildlife photography.
13
Abstract
Female conspecific aggression is widespread in the order Pinnipedia, which include phocids (true seals), otariids (fur seals and sea lions) and odobenid (walruses). Although the functions of female aggression have been explored in a number of
pinniped species, the proposed functions vary greatly between species. The aim of this research was to investigate the functions of female aggression in the New Zealand fur seal (Arctocephalus forsteri), and to assess the vast differences in the social interactions and reproductive ecology that may explain the disparity between species. As a common social behaviour, aggression between the individuals of a group and the resulting competition for resources can have a considerable influence on the spatial population dynamics by regulating the degree of emigration and immigration. Therefore, this research also explored the effects of female aggression of the New Zealand fur seal on the dispersion of females within the rookery to quantify its effects on the spatial
population dynamics, and to estimate the carrying capacity of the rookery area studied.
This study focused on a subset population of the Ohau Point seal colony, north of Kaikoura, New Zealand. A non-invasive method was used to make 184 observations of unmarked focal females over the 2014 – 2015 breeding season and the first three months of the pup rearing season. This research employed methods of quantifying aggression, such as aggression distance and the proportion of aggression, which were not commonly used in past studies of pinniped behaviour, to study its effects on the spatial population dynamics. Conspecific aggression in females was found to be
prevalent in this species; however, the rate of inter-female aggression was significantly lower than other species of otariids. The results of this study showed that
15
Introduction
Coloniality and spatial population dynamics
Coloniality is commonly found in many terrestrial birds, reptiles, marine mammals and most seabirds (Lack 1968; Trillmich & Trillmich 1984; Anderson & Hodum 1993; Danchin & Wagner 1997; Neff, Cargnelli & Côté 2004). The definition of colonial breeding is “a form of group living in which individuals breed within densely distributed nesting territories that contain no resources other than nesting sites”(Perrins & Birkhead 1983). As coloniality can accrue significant individual reproductive costs, its occurrence had been regarded as inexplicable by some from an evolutionary perspective (e.g., Danchin & Wagner 1997). Costs that arise from group-breeding include increased competition for resources such as space, food and mates, increased disease and parasite transmission, nest parasitism, conspecific aggression and infanticide, which may contribute to a reduction in the reproductive output of a population (Danchin & Wagner 1997; Davis & Brown 1999; Hötker 2000; Ashbrook et al. 2008; Breed, Don Bowen & Leonard 2013). However, the high frequency of coloniality across multiple taxa suggests that coloniality must also provide benefits (Danchin & Wagner 1997). Depending on the species, the benefits of colonial breeding may be reduced predation, shared efforts to protect offspring, increased likelihood of finding mates and access to information such as the location of food resources (Brown & Orians 1970; Burger 1988; Becker 1995; Ashbrook et al. 2008). For example, common tern nests with shorter nearest-neighbour distance were found to have higher reproductive success than nests with longer nearest-neighbour distance, as nests in denser colonies were better protected against predation (Becker 1995). Most of the proposed costs and benefits of group-breeding have originated from work on seabirds, due to the
significantly high occurrence of coloniality (98% of seabirds) (Lack 1968).
16 (Davis & Brown 1999). In pinnipeds and seabirds, terrestrial space is the primary
feature of the breeding habitat which limits the reproductive output of a colony, as breeding and care for the young occur on land while nutrition is acquired from the ocean (Bartholomew 1970; Gentry 1973; Cassini 2000). When there is a lack of
available breeding space, individuals, especially new breeders can either be prevented from reproducing or forced to disperse to find this resource which may result in a decrease in the net productivity of the population or the formation of new colonies (Brown & Orians 1970; Kokko & Sutherland 1998; Bradshaw, Lalas & Thompson 2000). Both of these assert density-dependent limitations on the number of individuals able to reproduce in the colony (Hötker 2000), and may facilitate emigration (Armitage 1991; Bocedi et al. 2014). Therefore, the space requirements of individuals that arise from social behaviour inevitably have a great influence on spatial population dynamics (Kokko & Sutherland 1998). In addition, the dispersal of individuals mediated by individual spatial requirements is an important driving force behind population range expansion, and is crucial in understanding the population dynamics in invasive,
threatened or recolonising populations (Bocedi et al. 2014; Bateman et al. 2015).
Some colonially breeding species show preference for certain habitat features, which can significantly influence the distribution (geographical location of animals) and
dispersion (the degree of physical separation between animals) of individuals in an area, and therefore mediate the carrying capacity of the breeding site and population
17 and earlier occupancy of island nesting sites in comparison to the mainland, islands were suggested to be of higher quality habitats for breeding avocets (Hötker 2000). Furthermore, Goshawk (Accipiter gentilis) nests which were taken earlier were found to have higher reproductive success (Krüger & Lindström 2001). Habitats that are highly heterogeneous result in increased competition for high quality sites and more
individuals occupying low quality sites, leading to a reduction in the per capita reproductive success (Krüger & Lindström 2001; Nevoux et al. 2010).
Social behaviour in colonies
The social behaviour in group-living species can significantly influence population dynamics, through the regulation of population size and facilitation of inter-population interactions (Tamarin 1983; Armitage 1991). Conspecific aggression, one of the main social behaviours, is the most commonly used to regulate space use by individuals (McBride 1971). Agonistic behaviour between conspecifics is commonly seen in ‘distance’ species, where individuals have a threshold distance at which aggression is displayed to an approaching individual, as opposed to ‘contact’ species, which tolerate or seek physical contact with one another (Brown & Orians 1970; Grubb 1974). In colonially breeding species such as seabirds, conspecific aggression can influence the degree of dispersion between reproductive individuals through the formation of
18 Hazlett 1975). Therefore, research on the social behaviour of mammalian colonial species would be valuable in further understanding of the mechanisms of population dynamics. In particular, there is a lack of research on the dynamics of population expansion in pinnipeds, and how it is influenced by inter-individual interactions. My research aims to fill this gap by analysing the inter-individual interactions and investigating how these influence the individual space requirements. I expect the
knowledge gained from this study will be of significant assistance in the development of management plans for the rapidly growing New Zealand fur seal population, especially when coupled with deeper understanding of the mechanisms of breeding habitat selection and the assessment of potential breeding habitats around the New Zealand coastline.
Coloniality in Pinnipeds
As the mammalian taxa with the most extreme polygynous mating system, pinnipeds are regarded as the ideal group in which to study the benefits and costs of group-breeding (Francis 1987; Carey 1989; Cappozzo, Túnez & Cassini 2008). Most pinniped species aggregate in large numbers to form breeding colonies every year during their summer breeding seasons (Miller 1975; Francis 1987; Wickens & York 1997). Large colonies of pinnipeds are thought to be formed through philopatry in most species, resulting in many generations returning to their birth site through the entirety of their lifespan (Bradshaw et al. 2000; Parker et al. 2008). Within the congregation, the females of some pinniped species, such as the elephant seals (Mirounga spp.) and the sea lions (subfamily Otariinae), form sub-groups, while others, such as fur seals, individually space themselves out, usually about one body length from others (New Zealand fur seals, Gentry 1973; Gentry 1987; Carey 1991; Northern elephant seals, Baldi et al. 1996; South American sea lions, Cappozzo et al. 2008).
Due to the highly polygynous mating system of pinnipeds, the benefits of colonial
19 (Campagna et al. 1992; Cassini 2000). Group-breeding in females may have evolved to increase inter-male competition as males compete with one another to gain access to the females, allowing the females to identify and select the fittest males with whom to copulate; which in turn increases their reproductive fitness (McLaren 1967;
Bartholomew 1970). Male competition also helps females avoid harassment from subordinate males, as the dominant males aggressively protect their harem of females or their territory in which females are established, through the exclusion of sub-dominant males from their territories (Doidge, Croxall & Baker 1984; Carey 1989; Francis & Boness 1991; Cassini 1999).
In otariids it has been suggested that females group together to reduce their individual rate of interaction with males (Campagna et al. 1992; Cassini 2000; Cassini &
Fernández-Juricic 2003). For example, Cappozzo et al. (2008) found that female South American sea lions (Otaria flavescens) in larger breeding groups experience lower rates of individual interaction with males due to a ‘dilution effect’, where each female
experiences less encounters with the dominant male as a result of the higher number of females (Cappozzo et al. 2008). The avoidance of males observed in females of many pinniped species are suggested to stem from the high level of physical harm that males can inflict on females, due to the extreme sexual dimorphism in body size in most
species of the families otariidae and in some phocidae (Miller 1975; Reiter, Panken & Le Boeuf 1981; Trillmich & Trillmich 1984; Campagna et al. 1992; Le Boeuf & Campagna 1994; Bohórquez-Herrera et al. 2014). The sexual dimorphism may be as extreme as the body mass of a male being seven times the mass of a female in some species (Wickens & York 1997). In the New Zealand fur seals, males can weigh more than three times the size of females during the breeding season, as they increase their neck girthand gain body weight for inter-male competition (Crawley & Wilson 1976; Carey 1991;
20 females experienced a reduced rate of harassment by sub-dominant males, positively influencing the survival rate of both females and pups (Campagna et al. 1992). However, pup defence may not be the primary cause of female avoidance of males in species such as the fur seals, in which females do not experience mortality from male interaction, as female aggression toward males have been observed even in the absence of a pup (Harcourt 1992b).
Aggregation can also incur costs to female pinnipeds due to density-dependent
mechanisms (Francis 1987; Cassini 2000). Increase in female density usually results in increased inter-female competition for resources such as suitable substrates for
birthing, resting and thermoregulation (Reiter et al. 1981; Maestripieri 1992; Cassini 2001; Cassini & Fernández-Juricic 2003; Fernández-Juricic & Cassini 2007). Increased competition and the saturation of individuals on high quality substrates may lead to a greater thermal stress in females, due to the requirements of higher frequency of
territory defence or visits to thermoregulatory resources such as the sea, pools or shade. Colony density has also been found to positively correlate to pup mortality, primarily caused through intensified conspecific aggression and starvation (Doidge et al. 1984; Cassini 2000, 2001; Lourie, Hoskins & Arnould 2014), as adult female pinnipeds commonly display a strong aggression towards non-filial pups (Harcourt 1992a; Maestripieri 1992; Cassini & Fernández-Juricic 2003). In many pinniped species, such female-pup aggression can result in the pup sustaining fatal injuries, for example, due to bites to the head (Harcourt 1992a; Le Boeuf & Campagna 1994). Density-related
juvenile mortality has also been explored in other colonially breeding species, such as seabirds. The Great black-backed gull (Larus marinus) chicks of high density colonies were less likely to survive than chicks of low density colonies, due to the higher
likelihood of conspecific aggression (Butler & Trivelpiece 1981). In pinnipeds, mother-pup separation is suggested to occur more frequently in high-density congregations, also due to the increased level of inter-female aggression (Francis 1987; Harcourt 1992a; Cassini & Fernández-Juricic 2003). Separations in high density colonies are likely to be followed by greater difficulties in locating each other through vocal
21 the primary method evolved to counter the detrimental effects of aggregation such as these.
Conspecific female aggression and territoriality
Conspecific aggression is most commonly found in the males of polygynous species, as they compete to acquire and defend their access to females to increase their
reproductive success (Christenson & Le Boeuf 1978; Armitage 1991; Bohórquez-Herrera et al. 2014). Conspecific aggression in females is usually of lower intensity (Floody & Pfaff 1977), and has not been as extensively studied as inter-male aggression (Clutton-Brock 2009). Female conspecific aggression in animals is most commonly seen in the form of food resource defence (Armitage 1991; Wolff & Peterson 1998; Huchard & Cowlishaw 2011) or maternal aggression, which functions to defend offspring against conspecific infanticide (Wolff 1985; Maestripieri 1992). Conspecific aggression in group-breeding animals can result in a partitioning of breeding spaces, which each individual actively defends from one another (Brown & Orians 1970). These ‘territories’ usually allow individuals to gain exclusive access and monopolize the resources within the area, which are necessary for survival and/or reproductive success; these may include food, mates or shelter from predation or the environment (Caron & Beaugrand 1988; Genner, Turner & Hawkins 1999; López‐Sepulcre & Kokko 2005). Since high level of aggression in conspecifics is indicative of increased competition, which generally results from increased density (Maestripieri 1992; Cassini 2001; Fernández-Juricic & Cassini 2007), aggression is able to prompt emigration and prevent immigration (Young, González-Suárez & Gerber 2008). For example, Christenson and Le Boeuf (1978) found that the movement of pregnant female Northern elephant seals between beaches was caused by inter-female aggression. As conspecific aggression has direct effects on the population size in colonial species through the formation and maintenance of territories, it is expected to assert a significant influence on species survival and population
22 Conspecific aggression in pinnipeds
The females of many pinniped species display agonistic behaviour towards other females of conspecifics during their resting and breeding periods on land (Carey 1992; Le Boeuf & Campagna 1994; Neumann 1999; Cassini 2000; Fernández-Juricic & Cassini 2007; Young et al. 2008). A variety of hypotheses have been suggested to explain the intra-sexual aggression in female pinnipeds, such as changes in hormonal levels during breeding (Atkinson 1997; as cited in Maniscalco et al. 2007), rousing of male
competition (Cox & Le Boeuf 1977), pup protection, territory defence and
thermoregulation (Carey 1992; Le Boeuf & Campagna 1994; Cassini 2000; Fernández-Juricic & Cassini 2007). Female aggression has also been attributed to food resource defence in most mammalian species, due to its significant contribution to their reproductive success (Sterck & Steenbeek 1997; Wolff & Peterson 1998; Huchard & Cowlishaw 2011; Miller et al. 2014); however, this does not seem applicable to pinnipeds which only utilize terrestrial habitats for breeding and resting and obtain nutrition only from the ocean (i.e. food defence would not be applicable to above-land conspecific aggression in pinnipeds) (Carey 1991; Francis & Boness 1991; Lento et al. 1997; Cassini 2000).
23 suggesting that there are factors other than hormone cycles inducing the conspecific aggression behaviour.
Female aggression has been proposed as a behaviour that serves to increase the
reproductive fitness of females by inducing inter-male aggression and attracting males via monopolisation of the males ‘peace-keeping’ behaviour (Miller 1974; Cox & Le Boeuf 1977; Maestripieri 1992). In many colonially breeding pinnipeds where territorial males defend a group of females or a breeding space, males show a tendency to interrupt agonistic interactions between the females or investigate female aggression towards other males, within or nearby his group or territory (Miller 1974; Cox & Le Boeuf 1977; Harcourt 1991). Such behaviour may lead to aggressive encounters with neighbouring males, the result of which could influence the females’ mate choice (Maestripieri 1992). This method of assessing the male fitness would benefit the reproductive fitness of the females as they preferentially mate with the older and dominant male, thereby producing offspring that may subsequently experience increased rate of survival (Cox & Le Boeuf 1977).
Pup protection has also been suggested as a primary reason for inter-female aggression in pinnipeds, as females often threaten and attack unrelated pups (Boness, Anderson & Cox 1982; Harcourt 1992b; Wolff & Peterson 1998; Cassini 2001; Fernández-Juricic & Cassini 2007). It has been suggested that female aggression protects offspring by
24 during the perinatal period. Another study on the grey seals (Halichoerus grypus) found that the likelihood of inter-female aggression depended on the location of the
aggressor’s offspring and that females displayed lower levels of aggression in the second half of lactation (Boness et al. 1982). Such findings support the hypothesis of female aggression as the primary function of offspring defence as new-borns are more vulnerable to conspecific attacks than older animals, requiring more maternal
protection (Harcourt 1992b; Maestripieri 1992; Le Boeuf & Campagna 1994). In a number of otariid species, starvation and death caused by attacks from conspecifics are the highest rated causes of pup mortality (Mattlin 1978b; Harcourt 1991, 1992a; Cassini & Fernández-Juricic 2003). Offspring mortality caused by female colony-mates has also been observed in at least one seabird, such as the common guillemot (Uria aalge) (Ashbrook et al. 2008). However, offspring defence alone cannot explain the existence of inter-female aggression in New Zealand fur seals or other pinnipeds, as this
behaviour is commonly observed even in non-lactating females and females whose pups are absent from the female’s vicinity (Francis 1987; Maestripieri 1992).
Finally, behavioural thermoregulation and competition for space have also been proposed as the purpose for female aggression in many otariid species as well as in a number of phocids (Carey 1992; Neumann 1999; Cassini 2001; Young et al. 2008). Fur seals have dense, highly insulating fur to aid them in deep-water foraging; however, this often results in overheating on land (Limberger et al. 1986; Campagna & Le Boeuf 1988). The contrasting intensities of gregariousness between the fur seals and sea lions can support the theory of thermoregulation as a function of aggression, as fur seals have much more potential to retain heat in comparison to the sea lions which are more tolerant of body contact (Gentry 1973; Trillmich & Trillmich 1984; Carey 1991; Cassini 2000). The frequency and strength of agonistic interactions has also been found to be dependent on the location within the rookery in some otariid species, as their range of thermoregulatory behaviours include preferences for resting and breeding sites with specific features (Carey 1989, 1992; Cassini 2000; Bohórquez-Herrera et al. 2014;
25 found that there was a higher likelihood of agonistic encounters between female New Zealand fur seals around cooling substrates such as pools and shade compared to substrates exposed to the sun. The defence of preferred microhabitat as the female’s ‘territory’ would allow the defending female to utilise the cooling resources constantly, without needing to travel through the colony to find thermoregulatory substrate elsewhere (Carey 1992). Inter-female aggression has also been observed in some
phocids such as the northern elephant seals and harbour seals (Phoca vitulina), with the functions of aggression suggested as space defence for pup protection and space
defence in limited haul out locations, respectively (Northern elephant seal, Christenson & Le Boeuf 1978; Harbour seal, Neumann 1999).
As outlined above, numerous past studies have analysed the female conspecific
aggression across the Pinnipedia; however, the results and discussions of these studies concentrate on the functions of aggression, and not the influence of this social
behaviour on the population dynamics (Boness et al. 1982; Carey 1992; Neumann 1999; Cassini 2001; Fernández-Juricic & Cassini 2007). My research aims to fill this gap by utilizing the ideas and methodologies previously used primarily in the studies of colonial bird populations to investigate the effects of conspecific aggression on the rookery population processes of a pinniped species, the New Zealand fur seal.
Fur seals
26 from the Galapagos fur seal (Arctocephalus galapagoensis) in which some females may continue to nurse their yearlings after giving birth to a new-born (Wickens & York 1997; Trillmich & Wolf 2008). All fur seal species are income breeders that forage in between nursing their young, as opposed to capital breeding, which is characteristic of most phocids that nurse their young from stored reserves until weaning (Boness & Bowen 1996; Bowen et al. 2006; McDonald et al. 2012; Breed et al. 2013). Six of the fur seal species reside in the southern hemisphere, one of them being the New Zealand fur seal (Wickens & York 1997; Garlepp, Logan & Kirkwood 2013).
New Zealand fur seals
New Zealand fur seals are one of the two native pinniped species of New Zealand, alongside the New Zealand (or Hooker’s) sea lion (Phocartos hookeri) (Crawley & Wilson 1976). They are a protected species, under the New Zealand Marine Mammals Protection Act of 1978 (Cawthorn 1985; Lalas & Bradshaw 2001). New Zealand fur seals are distributed around the coastlines of New Zealand mainland, offshore islands,
Southern Australia and the sub-Antarctic islands (King 1969; Crawley & Wilson 1976; Harcourt 2001). The current population size of the New Zealand fur seals in New Zealand is unknown; however, a New Zealand population estimation of up to 100,000 seals was suggested in 2001 (Harcourt 2001) and an Australian population estimation of approximately 40,000 in 2003 (Goldsworthy et al. 2003).
New Zealand fur seals, along with most other species of fur seals, congregate annually in high numbers on rocky coastlines to mate, give birth and raise offspring (Crawley & Wilson 1976; Goldsworthy & Shaughnessy 1994; Bradshaw et al. 1999). However, unlike many true seals (Phocidae) and sea lions, females of New Zealand fur seals display a highly anti-gregarious behaviour in the form of aggression towards
27 The large males start to arrive at rookeries from early October to obtain territories, which they attempt to maintain for the duration of the breeding season to gain exclusive access to the females within their territories, known as ‘resource-defence polygyny’ (Carey 1992; Goldsworthy & Shaughnessy 1994). To protect their territories and mating opportunities, males remain highly vigilant for any other males entering their
territories and violent fights between large, dominant males are frequent during the period of peak density (Carey 1991). Subordinate males are frequently observed attempting to enter rookeries for mating opportunities, and while some successfully mate, they usually are quickly driven away by the large dominant males (Goldsworthy & Shaughnessy 1994; Wickens & York 1997). Females pregnant from the last breeding season begin to arrive from late October to December to give birth, and the peak birthing period is December to January, and mating occurs about 7-8 days postpartum (Stirling 1971; Miller 1975; Carey 1992; Goldsworthy & Shaughnessy 1994). New Zealand fur seals usually give birth to a single pup as with most pinnipeds (Bester & Bartlett 1990; Wickens & York 1997), and females alternate between nursing periods on land and feeding trips at sea to continually feed and care for their pups over a 9-10 month period, after which the pups are weaned (McNab & Crawley 1975; Miller 1975).
Conflicts between humans and seals
28 potential conflicts between the fur seals and humans (Taylor et al. 1995; Wickens & York 1997; Lalas & Bradshaw 2001; Boren 2010). The commercial fisheries and public fishermen are likely to increasingly perceive fur seals as serious competitors for fishing stock, resulting in potential mass culling and retaliatory killing of the seals (Boren 2010; Butler et al. 2011; Schakner & Blumstein 2013). Seals are also blamed for damaging fishing gear and deaths of seals may occur from interactions with equipment such as trawl nets (Lalas & Bradshaw 2001; Yodzis 2001; Schakner & Blumstein 2013; Cronin et al. 2014). There already have been numerous examples of conflict occurrence between seals and fisheries in other species of seals, especially with increases in seal populations occurring in conjunction with decreasing fish stocks (Butler et al. 2011; Cronin et al. 2014). Many pinniped species that inhabit waters near large human settlements are likely to be implicated in some sort of conflict with commercial or recreational
fishermen, and thus are regarded as a serious concern due to the decline in commercial fish stocks around the world (Augé, Moore & Chilvers 2012; Cronin, Gerritsen & Reid 2012; Cronin et al. 2014). There are two main types of conflicts that occur between the seals and fisheries; operational interaction and biological interaction. Operational interaction refers to instances of seals directly taking fish already caught in fishing equipment, cause equipment damage and entanglements of seals in equipment. In a salmon trap-net fishery (Salmo salar) in the Gulf of Bothnia, seals reportedly damage over 50% of the catch, which is a considerable loss (Suuronen et al. 2006). By attacking fish caught in a trap-net, seals can also cause damage to the fishing equipment, incurring further expenses to the fishermen (Kauppinen, Siira & Suuronen 2005). Biological interaction refers to both direct competition for the same prey species and indirect competition through the marine food web (Lalas & Bradshaw 2001; Kemper et al. 2003; Cronin et al. 2012; Cronin et al. 2014). Many populations of seals target commercially fished species, such as salmon, whitefish (Coregonus spp.), herring (Clupea harengus), cod (Gadus spp.), flounder (Platychtys flesus), arrow squid (Nototodaus sloanii), hoki and mackerel (Trachurus spp.) (Lalas & Bradshaw 2001; Lundström et al. 2007; Chilvers 2008; Boren 2010; Butler et al. 2011). However, there has been no evidence of
29 There are a number of cases where an increase in pinniped population resulted in higher rate of conflict between fisheries and the seals. For example, a local increase in grey seal populations in the Clyde sea, Scotland, has led to increased perception among fishermen that grey seals are a significant threat to their livelihoods (Moore 2003). Also, the recent increase in harbour and grey seal populations in Europe resulted in an
increased rate of conflict with Scottish salmon fisheries, resulting in a development of a management plan to minimize human-seal conflict (Butler et al. 2011). The rapid increase of the grey seal population of the Baltic Sea caused an increase in fisheries and seal conflict in numerous countries, and it is estimated that the coastal fisheries are experiencing considerable losses from depredation of fish from nets and gear damage; this has resulted in the government of Finland allowing limited culls and hunting of this species (Varjopuro 2011). Since the population increase, the perceived negative impacts of the grey and harbour seal species on the fisheries in Ireland has led to a frequent demand for culls (Cronin et al. 2014).
Pinnipeds, and particularly otariids, are the marine mammals that are the most likely to be implicated in negative interactions with marine aquaculture industries (Kemper et al. 2003). Many species of seals hold a negative reputation for targeting commercial fish species in aquaculture pens, with the conflicts between aquaculture farms and seals predicted to continue as studies on effective seal repellent and exclusion methods are ongoing (Kemper et al. 2003; Robinson et al. 2008). Aquaculture industries are growing in importance, as the wild commercial fish stocks continue to decline (Pauly et al. 2002). Finfish aquaculture industries, such as salmon farms are the most frequently targeted by otariids around the world, and experience damages worth millions of dollars (Kemper et al. 2003). Approximately 2 to 10 million dollars of the gross production is thought to be lost to depredation by marine mammals (Nash, Iwamoto & Mahnken 2000). Before the industry expansion in the 1990s, it was found that marine
30 Seal interactions with humans or man-made items can inevitably be detrimental to seals as well. Entanglement in fishing gear is also fatal for many seals, and seal bycatch by fishing vessels is showing an increasing trend (Cawthorn & Wells 2008; as cited in Boren 2010; Augé et al. 2012). Both offshore fisheries and finfish mariculturalists of New Zealand are frequently implicated in conflicts with New Zealand fur seals. Trawl net fisheries experience a high frequency of seal conflicts, as seals targeting the fish in trawl nets are easily trapped and drowned (Lalas & Bradshaw 2001). Estimates of 456 to 1426 fur seal drowning s in trawl nets in the New Zealand Exclusive Economic Zone from 1990 to 1993 has been suggested (Gibson 1995, as cited in Lalas & Bradshaw 2001). Additionally, the incidence of fatality in relation to the bycatch by squid trawl nets in the New Zealand sea lions is proposed to be the primary threat to the small population of this rare species (Chilvers 2008). Due to the threatened state of the New Zealand sea lions, efforts to minimize accidental kills are include a limit on the number of kills by the squid fishery, and the production of a sea lion exclusion device (SLED) (Chilvers 2008). In contrast, the primary focus of fur seal exclusion and repellent methods usually is to minimize the damage to gear and catch, as many species of fur seals are rapidly increasing (e.g., Suuronen et al. 2006). The damage on the mariculture industry caused by New Zealand fur seals was estimated to be NZ $2 million per annum as of 2003 (Kemper et al. 2003). New Zealand fur seals, along with all other species of seals, in the 200 nautical mile Exclusive Economic Zone are protected under the Marine Mammal Protection Act 1978, prohibiting all killing and harassing of pinnipeds (Lalas & Bradshaw 2001). Despite this, there have been instances of illegal culling of seals by shooting (Kemper et al. 2003). Relocation or culling of seals that repeatedly target farmed stock are also practiced by a number of marine farms to minimize stock loss (Kemper et al. 2003; Robinson et al. 2008; Butler et al. 2011), which would be definitively (in case of cull) or potentially (in case of relocation) detrimental to the animal. By having a negative impact on the survival rate, such control measures may significantly reduce the population persistence, especially if the population is small and declining.
31 areas that are visited by humans for recreational purposes including tourism (Boren et al. 2002). Increasing numbers of seals on coastal highways resulted in road deaths from collisions with cars (Boren, Morrissey & Gemmell 2008), and increases in seal numbers near towns may increase the frequency of vehicle accidents in urban areas. The recent recolonization of the coastal areas of the Otago peninsula by the New Zealand fur seals and the New Zealand sea lion has resulted in an increase in interactions between the public and the seals. For example, the animals have been sighted in urban areas,
waterways and beaches, increasing the rate of human-seal encounters; this has resulted in the public perception of the animals as a threat to public health and vermin (Lalas 2008). The ability to identify potential problem areas in advance through predicting the direction and timing of fur seal population expansions, and designing management strategies in accordance to this would be a valuable skill in minimizing the human-wildlife conflict (Bradshaw et al. 1999; Bradshaw et al. 2002).
Statement of the problem
Past studies on the conspecific aggression in various species of pinnipeds have
concentrated on its functions, but no research has focused on the effects of conspecific aggression on the spatial population dynamics. The aim of this thesis is to investigate the latter to better determine the effects of population increases on current breeding colonies of New Zealand fur seals. Although numerous studies have focused on the functions of female aggression in well-studied species such as the northern fur seal
Callorhinus ursinus; (Francis 1987) and the South American fur seal; (Harcourt 1992b;
32 highlights the current inability to make predictions in regards to the time of the
expansion of a rookery.
Thesis aims
The primary objective of this research is to quantify the breeding territory size of female New Zealand fur seals by examining the intra-species aggression distance. This study will also contribute to the current scientific knowledge of pinniped behaviour, by investigating the functions of intra-species and intra-sexual aggression in female New Zealand fur seals.
To investigate the carrying capacity of a New Zealand fur seal rookery in relation to the breeding population, I will explore the female aggression behaviour, and the resulting female territory size as the limiting factor. Adult female fur seals are the numerically dominant sex and age group in rookeries during the peak period of the number of territorial individuals (pupping period) (Stirling 1971; Miller 1975; Shaughnessy et al. 1994; Harcourt 2001; Boren 2005), and thus the demographic group which occupy the most space in the rookery. Therefore, it can be safely assumed that the number of females in a rookery during the pupping period will be the primary factor that drives the growth and expansion of the rookery.
The study objectives are:
1. To investigate the functions of aggression in female New Zealand fur seals, and compare with previous studies on conspecific aggression in other pinniped species.
2. To assess the use of conspecific aggression measurements in estimating colony density and dispersion of individuals.
3. To explore the implications of conspecific aggression on the spatial population dynamics of colonial species.
This study of the aggression behaviour in the female fur seals is expected to assist in the production of the New Zealand fur seal population management and fisheries
33 rookery carrying capacity. This information is expected to be useful for management planning as it will help predict the time and direction of rookery expansion, allowing an evaluation of the areas that may require management attention in the future.
Previous researches have shown that the functions of female aggression can
significantly differ between different species of pinnipeds (e.g., Christenson & Le Boeuf 1978; Boness et al. 1982; Carey 1992). Therefore, this study will also provide a good opportunity for behavioural comparisons between different fur seal species, and why some of these behavioural differences may occur. There also has been limited research on the aggression in New Zealand fur seals; a previous work has focussed on
34
Methods
Ohau Point seal colony
Female New Zealand fur seals (Arctocephalus forsteri) were observed at the Ohau Point seal colony which is located 26kms north of Kaikoura, on the East coast of New
Zealand’s South Island (Figure 1). The period of observation was from November 2014 to April 2015. The seal colony is a rookery; a site used for breeding purposes. Ohau Point seal colony is the largest fur seal breeding colony in Kaikoura, with an estimated 3000 individuals and an annual pup production of approx. 600 as of 2005 (Boren et al. 2006; Boren et al. 2008). The rookery is situated adjacent to a highway and spans about 1 km of the coastline. Parts of the rookery are located under coastal cliffs; some formed of natural rocks and some formed of man-made walls for the highway.
The study area, named North Platform or sub-site no. 3 in previous studies (L. Boren, personal communication; Boren et al. 2002), was chosen as the primary research
location (Figure 2). This was based on the presence of a good vantage point, good visual access to most areas of the site due to the lack of caves or large crevices, distinct
physical partial barriers to neighbouring sites, various substrate types, presence of tidal and non-tidal pools, and the high number of female seals in the area. The study area was c. 54.2 m long and 27 m wide (from the cliff to the furthest dry ledge at high tide) which equates to 1463.4 m2.(ImageJ drawn size 1330 m2). At low tide, the width of the study area expanded to 34 m to include the exposed tidal rocks. The vantage point used for observations was on top of a man-made concrete wall c. 7.8 m high. Depending on the location of the individuals chosen, the distance from the observer to the subject
35
36
Sampling methods
Behavioural data were captured both on video and with still photography. Sampling occurred on three days of each week for a period of 5 months, and the sampling days were chosen using a random number generator. Three one hour sampling sessions occurred per sampling day at 7 am, 12 pm and 6 pm, to allow for observation of differences in seal behaviour during different times of the day. After the change in daylight savings time, the afternoon sessions were moved to begin at 5 pm due to the lack of natural light, which significantly reduced visibility. I was unable to sample for the evening sampling time on the 11th of February due to road closure.
A Panasonic HC-V550M video camera mounted on a tripod was used to film during all sampling sessions. Additionally the entire study area, showing the locations of all seals visible from the vantage point, was photographically documented at the beginning of the sampling sessions using a Fujifilm Finepix s2950 and a Canon EOS 1100 digital camera.
37 Focal-animal sampling
I used the focal-animal sampling (Altmann 1974) where a focal female and pup pair were filmed for the entire sampling session. To minimize pseudo-replication, pairs at various locations within the study area were chosen for each sampling time, as many species of pinnipeds are known to exhibit small-scale site fidelity to some degree (Lunn & Boyd 1991; Pomeroy et al. 1994; Wolf & Trillmich 2007; Parker et al. 2008).
Individuals at locations that had been filmed on the same or the previous day were avoided, unless the pair was identified as different individuals by their tags or markings. A female and a pup were determined as mother and pup by observing their interactions (suckling, playing, and other interactive behaviour without aggression from the female resulting in pup being driven away) or if they were resting within 0.5 m of each other (McNab & Crawley 1975; Francis 1987). By choosing only the females with her pup, I ensured that all focal females in my study were lactating females. If the focal pair moved or separated, I continued to film and observe the behaviour of the focal female, not the focal pup. If the focal female was lost from view or if she left the colony within the first 45 min of the sampling period, a new focal pair was chosen and sampling began again from the start.
The total number of adult males, adult females, yearlings, new-born pups and juveniles visible within the study area were counted and recorded at the start of each sampling session. Identification of seals of different ages and sexes were done using descriptors from past studies, as indicated below (Crawley & Wilson 1976; Wilson 1981; L. Boren, personal communication, 2015; Goldsworthy & Shaughnessy 1994; Dickie & Dawson 2003).
New-born pups (pups born in the current breeding season): body length of c. 40 cm at birth, usually with dark black coat until moulting at age of about 5 to 6 months old.
Yearlings: body length of less than 1 m, usually with light grey coat with yellow tinges.
Juveniles: body length of less than 1 m, usually with silvery-grey or brown adult coats.
38 Sub-dominant males: body length greater than 1 m, with head and neck larger than
those of females, but without the distinctively massive necks of dominant males. The size of males under the age of 5 are thought to not greatly differ from adult females (Dickie & Dawson 2003). The presence of the mane around the neck and the size and shape of the fore-flippers were also used as more reliable identifiers.
Dominant males (adults): body length of 1.5 to 2 m, with a distinctively large neck, especially during breeding season, which is covered with fur thicker and longer than the rest of the body. Are able to establish and defend territories from other males.
The following abiotic factors were visually estimated and noted at the beginning of each session: tide state (low, mid, high); percent cloud cover; wind speed; and sea roughness. In addition, I calculated and noted tide levels (meters) for the corresponding sampling time using the Kaikoura Tide Chart provided by Metservice (www.metservice.co.nz). The tide states recorded at each sampling session were used for comparison and as reference when calculating the tide levels from the tide chart. Both the wind speed and sea roughness were noted in five levels, from mild/low to strong/rough. The rock temperature at the colony was measured during each sampling time using an Onset HOBO Data Logger pendant setup tied to a small fishing rod, which was cast from the vantage point into the study area. The logger pendant setup consisted of the pendant protected in a loose cone-shaped casing of plastic gutter guard with a small parachute attached at the top end to slow the fall. This setup was devised for the protection of the logger pendants after experiencing impact damage early in the study period. The data logger was set up to record temperature every 10 s, and the temperature logs taken for the duration of each sampling were calculated to yield the mean temperature for each sampling times. Due to malfunctions of the data logger or external damage, temperature logs from 12 out of 184 sampling times (6.5%) were lost.
39 measurements were also taken and were used as a reference to calculate the total
length and width of the study area using ImageJ.
Identification of individuals
A number of adult seals could be visually identified. Some females with round yellow tags could be distinguished from non-tagged females and from each other by the
presence and location of the tag (left or right flipper). Some females were observed with rectangular tags, with the numbers visible in photographic data. Allflex ® sheep-tags with four-digit numbers were identified as females tagged in a previous study in the same location 10 – 14 y prior (Boren 2005). Other females were identified by unique markings, such as white spots on their heads and foreheads, spots on their backs (presumed to be a change in fur colour due to an injury) or scars (Figure 3). For about three weeks from the 1st of January 2015, some pups could be identified from numbered tags that were applied for research occurring concurrently (O. Gooday), and this
allowed reliable identification of females if a tagged pup was seen with its mother. From March 2015, some pups were again able to be identified by haircut markings also
applied for Gooday’s research. The presence of all visually identifiable individuals was noted during observation and documented photographically if possible, allowing
40
Figure 3. Examples of identifiable female New Zealand fur seals. a. Female with a yellow Allflex ® tag
on the posterior edge of her right flipper. b. Female with light coloured spots on the forehead and
41
Quantification of agonistic interactions
All videos were scored for the frequency of female aggression, aggression intensity and the distances at the onset of each agonistic and non-agonistic response to an
approaching conspecific using the video playback program GOM Media Player. During the behaviour scoring, the sex and age group of the approaching individual was noted and the time points at which the focal female responded were noted as encounter 1, encounter 2, and so on. The sex and age group of the approaching individuals were noted as dominant male, young male, adult female, juvenile, yearling, and new-born pup. The four intensities of aggression from the focal female were noted within each
encounter for the exhibition of the following behaviours:
Threat: An open-mouth threat, where the individual opens its mouth and shows its teeth while facing the general direction of the opponent. This behaviour may or may not be accompanied by a growl (Figure 4a).
Threat-exaggeration: A behaviour that appears to emphasize the threat by extending the neck towards the general direction of the opponent while displaying threat
behaviour, similar to the ‘horizontal neck-stretch’ behaviour of the Southern Australian population of A.forsteri (Stirling 1971). This behaviour appears to have been categorized with either ‘threat’ or ‘lunge’ in a number of past studies on pinniped aggression (Boness et al. 1982; Francis 1987; Carey 1992). However, I decided to categorize this behaviour as separate, as I noted some distinguishable behavioural components that differed from ‘lunge’ as previously defined by the studies cited above (Carey 1992), as ‘lunge’ was usually displayed when opponent was within reach, while ‘threat-exaggeration’ usually occurred when opponent was out of reach (Figure 4b).
42 the opponent. This behaviour is thought to facilitate body contact to allow biting (Figure 4c).
[image:42.595.80.516.286.598.2]Bite: Contact between the focal individual’s open mouth and the opponent’s body, with the focal individual’s mouth closing while still in contact. This behaviour almost always causes the opponent to yelp, scramble to move away, or a quick movement of the targeted body part away from the aggressor and/or a lunge towards the head of the aggressor. However, from personal observation, bites from adult females hardly ever produced any of these responses from dominant males, instead being simply ignored (Figure 4d).
Figure 4. a. Threat behaviour shown by the focal female (center of image) with her pup (dry pup suckling
from the female) towards a non-filial pup (wet pup left of the female, emerging out from the pool). b.
Threat-exaggeration from the focal female to the non-filial pup, with her neck elongated towards the
opponent. c. Lunge behaviour in progress, as the female orients her mouth towards the opponent and
elongates neck in an attempt to make contact. The opponent is in the process of returning to the pool. d.
43 Other behaviours such as ‘neck-waving’ (females pushing their chests against each other, while waving their necks: Carey 1992) and ‘chase’ (female chasing after a withdrawing individual, usually post-aggression: Carey 1992) were also noted; however, these were not included in the analyses due to their low rate of occurrence. Instances where the focal female did not show any form of response (i.e. opening of eyes, head movement or gaze following the movement of opponent) to approaching or passing conspecifics were noted as ‘no response’. If multiple encounters occurred with the same individual
approaching the focal female, this was noted for subsequent encounters only when it could be confirmed as the same individual.
To acquire accurate measurements for the various site areas at which the focal females were filmed, the 1 m scale at the appropriate zoom level from the closest area was chosen and used as a 1 m reference. As the video recordings of the 1 m scale did not cover every zoom level that was used in videoing the focal females, the 1 m distance in some zoom levels was estimated by calculating the difference in the lengths of certain markers such as rocks of known size from other zoom levels.
Screen Caliper, an on-screen measurement tool, was used to create a grid with PhiMatrix, an on-screen grid program. This was done by placing a Screen Caliper at a horizontal angle showing the horizontal 1 m length and another Screen Caliper showing the vertical 1 m length for the zoom level of the video being processed. The top left corner of a PhiMatrix grid was placed on the Screen Caliper and resized so that 4 squares would fit in each of the Screen Caliper, resulting in a 0.25 x 0.25 m grid for the site area and zoom level of the video being processed. The grids tended to be rectangles elongated horizontally, as the vertical laying of the plank at level with the ground made it appear shortened at most site areas. This grid was overlaid on the video during playback for quick distance estimation (Figure 5). Distances were scored to the nearest 0.125 m starting from 0 m (contact) to 0.25 m, then to the nearest 0.25 m starting from 0.25 m to 3 m. Screen Caliper was used in conjunction with PhiMatrix to estimate distances between the seals.
44 bite. Other variables noted during the video processing were: the orientation of the approaching seal (noted as moving towards focal, passing by focal and moving away from focal), the direction at which a seal approached a focal female (noted as from head, back, belly, flank and tail) and the presence or absence of focal pup.
[image:44.595.74.525.395.704.2]During the scoring process I also noted the presence of the focal female’s filial pup, whether the filial pup was suckling, the number of individuals within a 2 m radius of the focal female including their sex and age group (number of neighbours) and the distance of each of these neighbours from the focal female. The distance of the neighbours from the focal female was calculated in increments of 0.25 m. Additionally, the time points were noted for non-focal female aggression, pup-to-pup aggression, and when the focal female did not respond to individuals approaching within 1 m (no-response). Multiple snapshots from the videos were saved as image files with the dates, session time and zoom levels to allow future reference to the location of the focal female, body size measurements, and easy identification of distinguishable females.
45
Pup presence
By referring to the notes taken of the presence and absence of the focal females’
offspring for every aggressive encounter during the second video processing, I extracted a set of focal female samples which responded to conspecifics in both the presence and absence of their pups. This was done to ensure comparisons in the behaviour of each focal female in the presence and absence of filial offspring, eliminating the potential for the results to be biased from inter-individual variations. The mean response and aggression distance for all interactions which occurred either in the presence or
absence of the focal offspring were used for subsequent analysis. As not all focal female responses lead to an aggressive behaviour, the set of data showing the mean aggression distance in the presence and absence of focal offspring was inevitably smaller than the mean response distance data. Then, to analyse inter-female aggression in the presence and absence of focal offspring, I calculated the mean of the response and aggression data only from the interactions in which the non-focal animal was an adult female.
Focal female location
46
Birthing and nursing periods
The first confirmed presence of a new-born pup within my study area was on the 24th November 2014, The last birth or indications of recent birthing was observed in the study area on the 28th of December 2014, which was used as the last day of the birthing period of my study population. Therefore, the identified birthing period of the study population was from the 24th November to 28th December, and the nursing period was from the 29th December to the end of the study period, 23rd of April 2015. These dates were used to compare the behaviour and location of the seals between these periods throughout the analysis of data.
Mapping of site occupancy
To accurately determine the zones within the study area that were used for pupping, the photos of the study area from thirteen sampling times during the birthing period were used to map the area usage by reproductive females (Figure 6). Only the females seen in resting or nursing positions with pups were used in the mapping and any female-pup pairs in a moving position or solitary pups were excluded; this was to ensure that all mapped sites were of female choice. Using Adobe Photoshop, the outline of all the sites used for birthing and nursing was deduced from this set of maps, and its zone was measured using ImageJ, with a measurement between two distinct points taken in the study area as a reference for scale. The mean aggression distance was used to calculate the mean individual territory size (defined here as the defended area around an
individual), while the mean nearest-female neighbour distance was used to obtain the size of the individual space (defined here as the space in which no other seals were established, this space was often smaller than the defended territory size) respectively. The mean territory size was calculated from the mean of all focal females’ averaged length of aggression distance, while the mean nearest- female neighbour distance was a mean of the distance between all focal females and their nearest female neighbours. The nearest-female neighbour distance data was obtained from the distance measurements of all neighbours of the focal females thus was in increments of 0.25 m. By using these measurements coupled with the average female New Zealand fur seal body
47 size which each female would occupy and defend (territory size), and the occupied area size of each focal female (individual space) were obtained. The female body width was measured from the video data from this study, using the same methods as the
measurements of response and aggression distances. The body width (chest) was
[image:47.595.75.523.358.569.2]measured in 12 females, and the body width including the flippers was measured in 5 of these females (females which untucked their flippers from under the body and had them extended flat on the ground during the filming). Only the females near the vantage point and at the exact locations where the 1 m scale was positioned were used in the body width measurement to maximise accuracy. The mean territory size and the mean individual space size were then calculated for birthing period and the nursing period, to predict the number of females that the study area would be expected to be able to support, and compare the results to the actual counts.