LOVIER IONOSPHERIC IRREGULARITIES
A thesis presented for the
degree of Doctor of Philosophy in Physics in the University of Canterbury,
Christchurch, New Zealand.
by
R.A. VINCENT
cgl?
.v,,�
lofi \
for the assistance generously I would like to thank a number of people given, particularly thefollowing:-Professor A.G. McLellan for providing the opportunity to do this research.
Dr. G.J. Fraser, my supervisor 1·or his helpful advice and encouragement.
Dr. A.H. Manson and Messrs. M.R. Thorpe and G.L. Austin for much useful criticism and discussion.
Mr. R. Borrell for his technical advice for and making such an excellent job of rebuilding the eg_uipment.
CONTENTS
1 • INTRODUCTION. 1
2. MEASUREMENTS OF CHANGES IN PHASE PATH. 8 Outline of method.
Experimental arrangement.
2.3 The phase relationship between the transmitted radio frequency and the phase reference oscillation.
Presentation of phase information.
8
9
10 12 2.5 Chart recording of phase path changes. 13 2.6 Transmitting and receiving arrangements.
2.7 3.
Suppression of 2.4 Mhz carrier. ACCURACY OF PHASE PATH MEI'HODS. 3.1 Effects of variations in sender and
reference frequencies.
14 15 17
17
3o2 Phase coherent echoes. 18
3.3 Measurement of �P from film or charto 19
4.
4-1
IONOSPHERIC STRUCTURE AND PHASE PATH CHANGES.
Causes of phase incoherence
4.2 The effect of changes in refractive
22 22
index on phase path measurements. 29 4.3 Phase pattern produced by idealized
irregularities. Summary.
5 .1 5.1.(a) 5 .1 • (b)
LOWER IONOSPHERE. Examples of records. Daytime record.
Night-time record.
38 38 39 40 5.2 Moving irregularities in the D region. 41 5o3 Phase coherence of reflections from
heights below 100 km.
5.4 Phase patterns of lower ionospheric reflections.
5.4. (a) 5 .4. (b) 5.4. (c)
Spring and autumn Summer.
Winter.
5.5 Effects of interference between
43
46 46 50 51
magneto-ionic components. 54 5.6 Comparison with other results. 56
5.7 Summary. 59
6. LOWER IONOSPHERIC IRREGULARITIES. 62 6.1 Meteorology of the atmosphere between
30 and 100 km. 63
6.1 .(i) Winds. 63
6.1 .(ii) Temperatures 63a
6.2 Internal gravity waves 64
6 .3 Turbulence. 68
6.4 Seasonal variations of scattering
6.6 6.7 7. 7 .1 7 .1 • (i) 7 .1 • (ii) 7.2
7
.
3
7
.
4
8. 1 • 2. 3.4
.
5.
6
.
Night observations.
D region stratifications. E REGION PHASE PATH CHANGES. E layer phase changes.
80 82 87 87
Diurnal phase changes. 88
Irregular fluctuations in the E layer. 89 Gravity waves and spaced receiver
observations. Sporadic E.
Solar flare effects. CONCLUSIONS. TABLES 95 98 102 107
Ratio of A to A X 0 28
Phase path differences and horizontal separation of magneto-ionic components for model atmosphere
Deviations in phase path caused by
28
100% N(h) irregularities at height z0• 32 Phase deviations in totally reflected signal.
Percentage time echoes present below 80 km for hours near noon.
Comparison of fading period and coherence coefficient.
32
44
A.1. A.2.
2. (i)
2. (ii) 2o (iii) 2 • (i V) A.3. A.4. A. 5. 5.1 5o2
5
.3
A.6.DERIVATION OF PHASE EQUATION. EXPERIMENTAL EQUIPMENT FOR PHASE PATH MEASUREMENTS.
Generation of phase reference oscillation.
Phase locked trigger generator. Phase comparison circuit.
Recording of phase changes. HORIZONTAL DEVIATION.
REFLECTIONS FROM A SINUSOIDAL LAYER. SOW...E ASPECTS OF GRAVITY WAVE THEORY. Notation.
Basic equations.
Propagation of atmospheric waveso POWER SPECTRUM ANALYSIS.
Figure 1 2 3
4
5a b6
7 89
1 Oa b 11 a b 12a b 13 14 15 16 17 FIGURES.Before Page Representation of phase oscillations. 9
Block diagram. 14
Average electron density profile. 26 Theoretical range changes. 36 Phase record 4th November 1966. 40 Night-time phase record. 40 Phase changes of moving irregularity. 40 Speed inverse duration. 43 Monthly plots of coherence coefficients. 46 Coherence plots as a function of time. 46 Phase record 16 September 1966. 48 11 11 4 October 1966. 48 11 11 26 October 1966. 49 Phase path changes 75 km echo.
Phase record 9 February 1967; 11 11 1 6 June 1 967.
II II 7 July 1 967 •
Zonal winds.
Temperature profiles.
Representation of gravity wave. Height distribution of Vaisa�a frequency.
E region phase path changes. 5 October 1966
19 20 21 22a b 23a b 24a b 25 26a b 27a b 28 29 30 31
E region phase path changes 14 October 1966.
Autocorrelation runctions. Power spectra.
Phase path records 9 March 1967.
II II II 5 October 1 967. 2.4 Mhz tuned amplirier.
100 khz oscillator. Modulator.
Video amplirier.
Phase locked trigger generator. Detector and rilter circuit. S4uaring circuit.
Gate circuit.
Conversion circuit. Dispersion diagram.
Height distribution or 4 2 (no wind).
89 92 92 101 101 A5 A5 A7 A7
AB
A9 A9 A10 A10 A25 A31II II II
II II II
4 4 2
2 (with wind)(against . A31
1 • INTR0I,UCTI0N.
-r�r1 fAI\Y
UNIVE,,SI :ANTERBUP.Y C.HRISTCtf RCH, N.Z.
This thesis is a study of the structure of that part of the ionosphere lying between 60 and 120 km. In the usual terminology the ionized parts of the atmosphere in this altitude range are called the ionospheric D and E regions, the boundary between them occurring at a height of 90 km. Above this height the E region extends upwards to 140 km, the base of the F region. Since the ionizat -ion below 50 km is not enough to effect the propagat-ion or radio waves this height effectively marks the bottom of the D region. There is also another system of nomen -clature based on the neutral gas temperatures of the atmosphere. The mesosphere lies in the altitude range 50 to 85 km, which is a region of decreasing temperature with height. Because they refer to the same height range the terms mesosphere and D region are often used synony-mously in the following work. Above 90 km the temper-ature increases, rapidly at first and then mo�e slowly, in the thermosphere.
The daytime electron densities N(h) in the
have been used for a number of years to produce electron density profiles as functioLs of height and time. The widespread use of ionosondes and other techniques utiliz ing both single and multifrequency soundings from the ground and satellites has led to a large measure of under standing of the behaviour of normal E and F layers, as well as irregularities which exist at these heights.
Observationally little is known about the
physical processes occunting in the D region, particularly between 60 and 70 kmo What information has been obtained comes from insitu rocket probes and relatively sophisti cated ground based radio soundings. For example the study by radar systemE of wind induced distortions in
meteor trails (Greenhaw and Neufeld (1961) , Elford (1959)) together with propagation of sound measurements using
rockets (Nordberg etal (1965)) has enabled the circulation and temperatures in the mesosphere to be outlined in some detail.
Further information about the D region has come from a study of the behaviour of radio waves reflected from these heights. Because of low N(h) values, ranging from H=10 e/cc at 60 km to a few thousand at 90 km, only low frequency waves (� 300 kliz) are totally reflected
3 are transmitted at surriciently high powers weak partial rerlections are returned rrom the D region as well as the totally rerlected E region signal. The use or these echo\ rorm�the basis or one or the better techniques ror measur ing D region electron densities, the Dirrerential
Absorption Experiments or D.A.E. (Gardner and Pawsey (1963), Fejer and Vice (1959), Belrose and Burke (1964))0
Partial rerlections occur when the rerractive index or the medium changes rapidly with height. The N(h) values in the lower ionosphere change by rour orders or magnitude between 60 and 100 km and ir the electron
density changed smoothly with height such gradients could cause partial rerlections. However it has been shown (Gardner and Pawsey (1953)) that to explain the strength or the observed echoes the rerlections must come rrom sharp discontinuities in rerractive index, changes occur ing in a rraction or a radio wavelength. It is usually assumed that partial rerlections are caused by sharply bounded irregularities in electron density, although collision rrequency changes may also be important.
usually at heights above 60 km. What information there is about the dimensions of the inhomogeneities has been inferred mainly from studies of amplitude fading values (Gardner and Pawsey (1953)). Before any mechanisms suggested for the formation of irregularities can be assessed more information is required about the physical properties of the irregularities such as spatial scales and whether these are a function of season or not. Further observations of ionospheric structure would give some insight into the dynamics of the mesosphere since the irregularities are probably produced by some kind of mechanical redistribution of ionization.
One reason for the lack of knowledge about the reflections can be attributed to the relative�y poor spatial resolution inherent in the. normal methods of pulsed soundings. The usual ·technique is to transmit a packet of radio waves and observe the delay time t:Jt,, between transm:iflion and reception, thus giving the group or virtual height h1 of the reflections
where
,
h=� 2
zr =cf�= oU J
zr
µ
dz =� 2C = free space velocity of light u = group velocity of pulse over
I
µ. = group refractive index zr = height of reflection
/.
t1 = group path
I Provided zr is not too close to total reflection h is a good measure of the true height of reflection.
5
Because of fading and other complications it is diffi cult to measure At very accurately, and measured changes
I
th of order.:!:. 1 km are considered good under normal circumstances.
An alternative measure of the distance between an ionospheric reflector and a radio frequency sender can be given in terms of double the number of free spaDe radio wavelengths
c�)
occuning between the two. This measure defines the phase or optical path P defined inI a similar fashion to P as
zr P = 2c
f�
o v
zr = 2 J µdz
0
v = phase velocity of the wave �ver interval dz µ = phase refractive index 01· medium over dz •
changes in phase height (�), caused by change in µ or zr, can be measured to fractions of a wavelength.
Findlay (1 951a) has described how changes in phase path of reflections using pulsed radio waves may be measured in a similar fashion by co�paring the phase of the returned signal with the phase of a reference
oscillation on the ground. This technique combines both the advantages of the pulse and c.w. systems since the observations of the group height of an echo gives the height of reflection and the measurements of changes in P indicate how the reflector is behaving with time. Findlay's technique is both simple and accurate since changes in phase path can be estimated to within a fraction of a radio wavelength. For frequencies the
order of 2.5 MHz (A N 120 m) this means changes of the order of a few tens of meters at least can be detected. The
method also has certain other advantages over straight
forward group path measurements (McNicol and Thomas (1960)), for example a better ability to resolve overlapping
echoes by observing their different phase structure.
7 requirements for a study of D region partial reflections (high power pulse transmitter and low noise field site) were already available at the Universities' field site at Birdling's Flat (43°50'S, 172°401E). Experiments already in operation were the D.A.E. method of obtaining D region electron densities (Gregory 1964), Manson (1965)) and a spaced receiver experiment for observing lower
ionospheric drifts (Fraser (1965)). Results from these experiments were 1·ound to be very useful in the present project the aims of which
were+-(i) to investigate the detail structure of the lower ionosphere
2. MEASUREMENTS OF CHANGES IN PHASE PATH.
Findlay (1951a) described a relatively simple method whereby changes in phase path of pulsed radio waves can be measured easily and accurately. His basic technigue has been used by a number of other workers, although with some modification to experi mental detail (e.g. McNicol and Thomas (1960)). The present experiment used another variation of the orig inal methodo
2.1 OUTLINE OF EXPERIMENTAL METRO�.
Basically the experiment consists of trans mitting a pulse of radio waves (freguency fs) and comparing the phase of the reflected signal with a reference oscillation (P.R.O.) (freguency fr) which
bears some fixed phase relationship with the transmitted wave. The result of mixing the two signals will be
a series of beats or fringes of freguency of = (fs - fr), the number of fringes being egual to the product of
the pulse width and o f. If the seguence is
observed on an oscilloscope triggered at the time of pulse transmission the beats will appear after a time delay corresponding to the virtual height of the echo.
.,_ ______ At---�
Idealized
A"scope
display;ec.ho at
a group
he·1ght
ti:
CA\V2
�----t.---..
Represent at ion of phase oscilfatl ons for
single echo
D r�gron phase-he
i
gh
t"
video
observer is P the equation of the "beats" can be re presented by
E (t) � A (t) cos f2�
- see Appendix 1 for a derivation. fringe peak is given by
=�
(oft - �)] C
The position of a
Provided of>o then as P increases (or decreases) the
(2 .1 )
(2o2)
beats will move up (or down) the time base. The phase path change �P, is easily obtained by following one
fringe. When it has moved by a distance equal to N times the distance between successive beats P has changed by
�P
=
N c/fs=
N�2.2 EXPERIMENTAL ARRANGEMENT.
As the transmitted pulse is derived from a continuously running oscillator of frequency
2
.
404
MHz it can be modified to supply the phase reference signal as well. This is achieved by mixing the waves withanother continuous oscillation°
1
frequency 100 KH.z and selecting and amplifying the lower side band offre-10
quency 2.304MHz. signal fr.
This is used as the phase reference
The received signal and the phase reference oscillation are then converted to their respective
intermediate frequencies of 3.166 MHz and 3.266 MHz by mixing them with the same local oscillator frequency 5.570 MHz (in order to preserve phase continuity). It is these intermediate frequencies which were finally mixed
M
to produce the beats of frequency of = 100 k'z. With a pulse width of 25 µsecs two to three fringes were
obtained for each echo, with correspondingly more fringes as the retarded echoes broaden due to group retardation.
2.3 THE PHASE RELATIONSHIP BETWEEN THE TRANSMITTED
RADIO FREQUENCY AND THE PHASE REFERENCE OSCILLATION.
Normally the transmitter was triggered every 1/50th or 1/25th sec., the pulse rep�tion rate being
Since it is the 100 ktlz difference in frequencies which is finally observed it was to the 100 ktlz
wave-form used in generating the P.R.0. that the transmitter
trigger was synchronized. This was achieved by using
a simple diode logic 'AND' gate the inputs to which were the 50 or 25 c/s timing pulses and the series of "spikes" produced by differentiating the squared off 100 kilz ref-erence signal. The first spike coincident with, or pre-sent just after, the beginning of the timing pulse
triggered a transistorised pulse generator producing a
long output pulse. The leading edge of the pulse was
thus locked to one particular part of the reference wave form and so used to define the timing of all subsequent
operations in the cycle. Both the transmitter and
oscilloscope trigger pulses were derived from this master
pulse.
The timing was not perfect because of the finite rise times of the pulses used, meaning that the
9utput pulses jittered slightly with respect to the
reference waveform. This "jitter" was found to be the 1
12
2.4 PRESENTATION OF PHASE INFORMATION.
Since each echo f'rom the ionosphere had its own set of' f'ringes (and since ref'lections could be expected f'rom between 70 and 120 km) some simple
method had to be devised to display and record all the inf'orrnation simultaneously. This was achieved by intensity modulating an oscilloscope tube with the
phase video signal, each f'ringe peak producing a bright spot on the tube. With a 35 m.m. f'ilm moving con tinuously at right angles across the time base these spots traced lines on the f'ilm, each echo tracing its own set of' lines or phase pattern.
The strength of' the observed ref'lections covered a wide dynamic range (_80 dB f'rom 65 km up to E region) and the echo amplitude could be expected to f'ade considerably. To ensure constant intensity traces on the f'ilm the output phase video was clipped giving constant amplitude pulses. It was these pulses which were actually used to brightness modulate the cathode ray tube. Noise was also limited by this method but because it was randomly phased with respect to the ref'erence oscillation it only produced a background on the f'ilm. One of' the advantages of' a phase
Ten km height marker pips were also supplied
by a separate generator and mixed with the 100 ktlz video and simultaneously displayed. A rilm speed or 75 cm/ hour and a time base sweep corresponding to the altitude range 60 to 140 km gave adequate spatial and time reso
lution or rringes.
A block diagram of the experimental system is shown in Fig. 2 and details or the actual electronics are discussed in Appendix 2.
2.5 CHART RECORDING OF PHASE PATH CHANGES.
As well as using rilrn another technique was devised whereby the �P ror a given echo could be tracked electronically and displayed directly on a chart recorder.
/
.r
2•.C 04 Mhz 2·304Mh-z 3·266 Mhzc.w. c.w. c.w.
LJ
PHASE OEM OD ULATOR , RECEIVER ANO
·
-
TRANSMITTER � MODULATOR I-::-- REFERENeE--
ANDAMPLI FIER
A MPLIFI ER FILTER
3°1661'-ihz
+
/1' --- l,F. LOCAL
-·
5,570 MhZ OSCILLATOR'-V e.w. ·
-100 .kh-z
so,ashz 100khz LOCAL
TI ING PULSES OSCILLATOR AMPLIFIER
I
n._ - ' ', l/.
I
TAI GGE R
n.
INTESITY-
--
NOOULATOR-
GENERATOR OSCILLI SCOPE,____
BLOCK
DI
AGRAM
.
to the changes of phase path of the echo in wavelength unitso The variable pulse width was converted to a proportional voltage which drove the pen recorder.
Everytime the pulse width was zero or 10 µsec a change in phase path of one radio wavelength had occurred.and a discontinuity appeared in the trace. The pen recordet trace is thus roughly sawtooth in form and the direction of phase change (i.e. whether increasing or decreasing) can be found by the sense of the pen's deflection.
Recording on chart had the disadvantage that as the group height changed the gate had to be moved correspondingly thus causing a break in the phase record. However the chart technique was used as a convenient
monitor of long lived and slowly changing reflections such as from E region. It had the advantage that
phase path changes could be obtained almost immediately by algebraically counting the fringe changes with time. See Appendix 2 for further details.
2.6 TRANSMITTING ANTI RECEIVING ARRANGEME�TS.
wave dipoles in a broadside array, with a calculated gain of 1308 dB over an isotropic radiator.
The receiving array is composed of 4 folded
15
dipoles arranged in the form of a SQUare. Discrimina
-tion between the ordinary and extraordinary magneto ionic components is thus possible. However because
of general aerial availability and the need to run the phase experiment for long uninterrupted periods only two parallel sides of the array connected in phase were used, meaning that both components were present in the received signal. The possible effects of this mixture on the phase record is discussed in Sec.
4.2
and 5.52.7 SUPPRESSION OF
2.4
MHz CARRIER.In Sec. 2.3 it was implied that the P.R.O. was obtained by mixing two signals and extracting their difference, all other harmonies and the carrier signal being suppressed. In general this was true
but some leakage of the carrier signal
(
2
.
4
MHz) did occur occasionall� resulting in weak beating with the 2o3 MHzP.R.O. Since all signals were clipped these beats
3. ACCURACY OF PHASE PATH MEASUREMENTS.
3.1 EFFECTS OF VARIATIORS IN SENDER AND REFERENCE FREQUENCIES.
Findlay (1951� in his original paper on phase path measurements considered the effects of fs and fr changing with time producing spurious changes in P •. Using equation ( 2 .2) changes of the
17
time of occurtnce of a fringe with respect to changes in either fs or fr can be estimated by evaluating
at ot
Ms
max and afr maxat max :::: 1 (P +
,/c fs
o-f:
and
£.1
clfr max t max ofbut pl = P + fs dfs
hence at max
ars
:::: (P� - tor
max)dP
dfs) - t max (3-1 )
(3.2)
(3o4)
fluctuations in fs were very small.
From (3.2) changes in t max due to the phase
reference oscillator changing frequency are proportional
to the reflection height. The largest range considered
in the experiment corresponds to a delay time of
approximately 1000 µsec. The phase oscillator was
also crystal controlled and fluctuations in fr were found to be the order of ±1 in 105 over long periods so that �t max would be the order of 10-3 of one cycle of
the reference signal.
From the above it is obvious that �nstabil ities in the sender and local oscillator frequencies produced negligible changes in any phase path
measure-ments. In Sec. 2.3 it was pointed out that the 'jitter'
of the transmitted pu1.se with respect to the P.R.O. was H+ 0.04 µsec. which again only produces very small
fluctuations in the phase comparison.
3.2 Pr.ASE COHERENT ECHOES.
19
least, but the final determiner of accuracy (other
than the actual reading of �P from film or chart) is the ionosphere itself. Because only changes in P can be measured, and not P absolutely, if the reflection point changes discontinuously there is no way of knowing by how much the phase path has changed.
The important terms phase coherence and phase incoherence are now introduced. An echo is said to be phase coherent when at any instant in time the phase over the whole echo is constant and during the period of reception of the echo the phase changes smoothly with
time. A phase incoherent echo is one in which the
phase changes randomly over the duration of the echo. Obviously only phase coherent echos can have their phase path changes with time measured. Examples of
phase coherent and incoherent echoes are seen in Fig. 5a.
MEASUREMENT OF �p FROM FILM OR CP..ART.
Some simple method had to be used to extract
the phase information from the film, but reasonable
accuracy was required otherwise most of the reasons for
measuring �P are lost. Photographic enlargement and
printing of long pieces of film was tedious and time
35 m.m. strip projector, displaying 2.5 mins of record
at a timeo The horizontal surface was ruled in lines parallel to the time axis of film and the phase height of any given phase coherent echo could be found by algebraically counting the number of fringes which crossed a given datum line passing through the echo
trace. Readings taken every½ minute gave good time
resolution of �p starting from some arbitary time zero.
If the echo was longer than 2½ minutes the film was
wound on so that the next section of record was displayed.
\'�l-To ensure no lateral displacement of the film had occurred
the height marker lines were used as guides.
Changes in P by this method could be estimated to about ± 0-1 of a fringe spacing - that is a change of
approximately ± 1 0-20 meters. The chart recording
could be read with better accuracy, but again ± 0.1 fringe was adequate.
All coherent records of any length do show phase "jumps", that is the phase over the whole echo changes discontinuously by some apparent fraction of a fringe spacing. To deal with these discontinuities
it was decided that if �P/�t was the same on either
the total value of �P immediately before the break being assigned to the trace just after.
IONOSPHERIC STRGCTURE AND PHASE PATH CHANGES.
In the previous chapter most of the experi mental limitations of measuring changes in phase path were analysed and shown to be small. However no consideration has yet been given to the effects on the phase records of receiving with a linearly polarized array. In the first section or this chapter the causes or phase incoherence are discussed with partic ular reference to the possibility of interference between the magneto-ionic components. This Section is followed by an analysis of how changes in ionospheric structure, such as in electron content, will influence phase path measurements. Finally the phase patterns produced by certain types of ionospheric irregularities are briefly discussed.
4.1 CAUSES OF PHASE INCOHERENCE.
2 3 are randomly distributed strong amplitude "beating"
or fading will occur. Every time the resultant ampli
tude passes through zero the phase 01· the overall signal
is likely to change abruptly. Since the components
will be received with dif1'ering time delays the phase of the resultant signal at the commencement of the echo is unlikely to be the same as the phase at the end meaning
substantial phase jumps will eventuate.
A phase coherent reflection from a given range will occur when only one reflection is dominant. Most of the recording in the present experiment was made with linearly polarized aerials so there was some probability of phase incoherence resulting from interference between the two magneto-ionic components. Because their phase refractive indices are different their phase paths will
differ as they penetrate into the ionosphere.
Further-more because of the presence of the earth's magnetic field the directions of propagation of phase and energy are
Interference is most likely when the amplitude of the two components are comparable and their phases
substantially different. The relative amplitudes of the ordinary and extraordinary components as a function
of height have been studied at Birdling's Flat in connec
tion with Differential Absorption Experiment (Manson (1 96 5)) 0 In general near noon the extraordinary signal is the
stronger of the two at the lowest heights. However
because the extraordinary ray suffers greater absorption th�n the ordinary ray with increasing height the latter
eYentually dominates. Table 1 shows a typical equinoctial
profile of the ratio of the amplitudec bf the extraordinary and ordinary components. One of the most notic�le
features of the lower echoes is the high correlation
in fading between the magneto-ionic components (Belrose and Burke (1 96 4), Manson (1 9 6 5). To see by how much the phase paths and the reflection points might differ average electron density and collision frequency profiles were used to calculate the theoretical phase path differences and horizontal deviations of the two components at
various heights.
As a number of records were taken in the equinoxes the electron densities profile for September, October and November 1 96 6 were averaged to give the
2 5
period total reflection at noon occurred at a virtual
height of about 105 km. The true height was estimated from ionograms produced by the local ionosonde at Godley Head (2 4 km to the north ) using the Kelso 10 point method
(Wright and Norton ]S59 ) and was found to be about 100 km.
An exponential profile was fitted from the electron concentration at 80 km to the electron concentration
required for total reflection (72 ,000 e/cc ) at 100 km,
the composite profile being shown in Fig. 3. The
collision frequency profile used was found by averaging the summer and winter profiles presented by Kane (196 2 ) and fitting an exponential function to this, giving
v = 3. 2 x 101 1
exp ( -z/6 . 2 )
the refractive indices were derived from the full Appleton Hartree expression
= 1 1
-X
i -
z
y 2±�1
T
2 (1 - X - i
z
)n = complex refractive index µ = phase refractive index
y 4 T
- X -
iz
. )2(41- )
+ YLJ
1 0 0
90
H
e
j
g h t
(l<m)
80
7 0
N
O
O
N
S
PR
I
N
G
1
9
66
N = 4·1 7 5 E xp (0·24 Z}
·--- -'--- -� ----1 _;____ . .l - � -1 ___
...__----'---102
1
o
3 1o
4 1o
5N
(h
) (
c
ni
3)where
X = immaginary part of refractive
N = �
t m 0 w 2
YL eB O cos
e
m w
YT eB sin m
e
wz
= V/wN is the electron density
a "'o -- permi ttivi ty of free space
index
e,m = charge and mass of the electron w = 2�f where f = 2.404 MHz
Y = collision frequency B0 = magnetic field
26
e
= angle between direction of magnetic field and direction of phase propagation. At Birdling' s Flat for vertical incidence0
e
= 22 .L\P =
Jµ
0 dh-60 km (4.3)
The base of the ionosphere was taken to be 60 km
because the small electron densities below that height would produce negligible differences in phase path.
The lateral deviations were found using
D = f tan o<
J
60 km dh
(4
.
4
)
where � is the angle between the directions of phase and energy propagation - (Appendix 3).
The result of the calculations are summarized
in Table 2. This shows that substantial phase
differ-ences (greater than a radian) will occur above 75 km.
As Table 1 shows the amnlitudet of the comuonents al so
her. nme comna�ablP. hP.�ween 7� and 80 km- Tt is r.on
-eluded that because of the high correlation in fading for the lowest echoes noted above (probably due to the small differences in phase) most interference will occur
between 75 and 80 km in this model. Above this height
the recorded phase path changes will be those of the
28 in Sec. 5 when phase records taken using the components individually are considered.
TABLE 1
RATIO OF EXTRAORDINARY AMPLITUDE � TO ORDINARY AMPLITUDE A0
HT. (km) 72 75 77 80
1/Ao 1 .8 1 • 2 1 .o 0.52
TABLE 2
90 0.1
PHASE PATH DIFFERENCES AND HORIZONTAL SEPARATION OF MAGNETO-IONIC COMPONENTS FOR MODEL IONOSPHERE
HTo ( km ) 64 68 72 76 80 84 88
PHASE PATH
DIFFERENCE .0013 .006 .063 .252 .64 1 • 8 5.4
(WAVELENGTHS HORIZONTAL
4o2 THE EFFECT OF CHANGES IN REFRACTIVE INDEX ON PHASE PATH MEASUREMENTS.
An equation 1 .1 shows the phase height of a reflect ion is proporti onal to the integrated phase
refractive index up t o the point of reflecti on. Changes
in P are therefore caused by either the point of re flection moving or by variations in the phase refractive index µ of the intervening medium. To see what order of magni tude changes the latter might produce in the D regi on the quasi-longi tudinal approximati on of (4.2)
for µ was used (Davies (1966))
2
µ = 1
-_x_
o ,e 1 ±YL
(
4
-
5 )
µ o , e = phase refractive index for ordinary and extra
-ordinary components, which are associated with the plus
and minus signs respectively.
(4
-
5)
holds when the angle between the magnetic field30 For a frequency of 2.4MHz and local gyro frequency of 1 .65MHz
X = xN where x = 1.4 x 1 0-5 cm7
Differentiating (4.5) with respect to N gives
where x+ = �/1+ y - L
(4 .6)
Therefore the fractional change in the refractive index for a change ON in electron content N at height h is given by
0 µo,e -x + oN
(4- 7)
= ?(1 N)
µ o,e - x+
now x+ = 9.1 o-6 cm3
'
X
-
= 3.5 x 1 0-5 cm38.n.d 0
µ,J.e ,_ �L (�)
µ o ,e - 2 N (4.8)
It is noted from (4.8) ttlat 0µ/µ is negative for positive
°N
implying a decrease in phase path for increases inelectron density. For N (h) equal to 1 000 e/cc and a
fractional change of the order of 1 00% the percentage changes in µ0,e are only one part in 100. Changes of
this order in µ are unlikely to produce significant
changes in P, unless integrated over a large height range.
Since the electron densities are considerably smaller than 1 03 e/cc in the lower D
region and oN/N = 1 are
very unlikely, changes in electron content below the point of reflection will not produce significant changes
in P. This may not be true under solar flare conditions
when N (h) can change considerably.
( 1962)).
(Belrose and Cetiner
The above conclusions do not hold near total
reflection where µ becomes very small. Fooks (1962)
32
TABLE 3
DEVIATIONS IN PHASE PATH CAUSED BY 100% N (h) IRREGULAR ITIES AT HEIGHT z0
z o (km ) b.P (WAVELENGTHS)
75.0 -0.1
80.0 -0.2
85 o 0 -0.4
TABLE
4
PHASE DEVIATIONS (WAVELENGTHS) IN TOTALLY REFLECTED SIGNAL
a z
(km) (� ) 0.5 96
97 98 1 .o 96
97
2.0 96 97%
AMPLITUDE 1-
...
-0.04 -0 .06 -0.06 -0.08 0.140.22
2 -0 .05 -0.08
-0 .12
0.12
0.16 0.28 0.44
5 10
Since Findlay's (1 951 ) technique is a sensi -tive method for measuring 4P a calculati on similar to Fooks was carried out for D region irregularities. µ
was derived using the full Appleton Hartree equati on and the irregularities were assu11Med to be of the form
- A
N
z0 = height of the irregularity o = half width of layer
A = peak amplitude = �N/N (z0 )
(
4
.
9
)
The electron density profile in Fig. 2 was used and �P is given by the difference between the phase path calculated to a height of 90 km with and wi thout the irregularity at some height z0• Table 3 shows the
changes in wavelengths of the ordinary ray for oN/N equal to one and a = 2.5 km.
As expected the changes are barely detectable even for a large change in N. For comparison Table 4 shows the calculated phase deviati ons for various
irregularities close to the �Mt of total reflection (assumed to be 1 00 km). In this situati on even small changes in N produce measurable changes in Po The
34
the greater the effect, although changes in the height of reflection also have to be considered.4
.
3
PHASE PATTERNS PRODUCED BY IDEALIZED IRREGULARITIES.It was shown in the previous section that changes in the refractive index are unlikely to produce significant changes in the phase paths of D region
reflections so that only changes in the reflection point
need be considered. This section discusses what phase
path variations can be expected when the reflecting
surface changes in some idealized fashion. For example if the reflection is from a distorted surface of con stant electron density it is of interest to know how the phase path varies as the distortions move overhead.
One simple model which can be easily treated is that of a sinusoidal oscillation of amplitude a
and horizontal wavelength A in a layer at height h. Bramley
(1 953) ,
Austin(1
967
)
.
If the reflections are assumed to be specular it is ea0y to compute the changes in range from graphical methods (Appendix 4)o The necessary condition for only one specular reflecting point is that the factor A = (A2/4�
2 ah) be greater than one (see Appendix4
)
.
For A < 1 three or more specularundulation and phase incoherence will be caused by the r�sulting interference between the components. Fig. 4 shows the phase plots for different values of A. The main feature is that for A large the phase path changes are similar to the shape of the sinusoid but become more distorted as A � 1 • However for all cases A > 1 the peak to peak amplitude of the �P trace is twice the peak to peak amplitude of the oscillation.
A similar case has been analysed by Munro (1953 ) who used a simple concave mirror type of pert�ation to explain the group path changes produced by moving dis-turbances in the F region. Again multiple reflecting points can occur for certain cases of amplitude and horizontal scale depending on the height of reflection.
The winds in the mesosphere are known to be the order of some meters/sec and it can be expected that
small irregularities will show signs of horizontal move -ment. It is therefore of interest to know what kind of
phase pattern irregularities of this type will produce. Findlay (1 953) has investigated the idealized case of a specular reflection\, from a "point reflector" moving horizontally overhead with constant speed v. If the shortest phase path from the reflecting point to the
---
�
-....;..._ _____ _
R EFLEC T lN G S HAPE
T H E O R E T I CA� RANGE CHAN G E S PRODU C E D B Y SINU SOI DAL REFLECTI N G SU R FA C E ,
F I G. 4,
A = 3·2
of time is given by
�p =
where t is the time measured from when the irregularity is at its shortest range. Essentially the range changes
parabolically with time, firstly decreasing with the rate of change of P becoming zero at t = o and then increasing.
Findlay (1 953) and Thomas and Burke (1 956) have used this relationship
(
4
.
1
0
)
to measure the speed of moving cloudsof ionization in E region.
4
.
4
SUMMARY.In this chapter the cause of phase
incoher-ence was discussed. This occurs when multiple reflec -tions from roughly the same range have comparable
amplitudes. The components from each individual signal add in random fashion to produce a resultant signal
whose amplitude and phase vary substantially over the total echo giving rise to phase discontinuities o
Incoherence caused by interference between the magneto ionic components was considered and shown to be of the most likely conse�uence at heights between 75 and 80 km
37
In the second section deviations in the phase paths of D region reflections caused by changes in the refractive index of the underlying medium were shown
to be negligible, although near total reflection even small percentage changes in electron content can produce measurable fluctuations in P.
Finally the phase changes produced by specular reflection from an undulation in a reflecting surface
at constant height were examined. The phase plots are
shown to be reasonable representations of the oscillat
ion provided the tilts of the reflecting surface do not
become large o If they do multiple specular reflecting
points occur and interference will be produced. This
is of interest to the present experiment since it shows that phase incoherence is not necessarily caused by interference between rays from separate irregularities but may be produced by multiple reflections from a
5
.
PHASE HEIGHT OBSERVATIONS IN THE LOWER IONOSPHERE.Phase measurements were taken from mid September 1 966 to mid July 1967, observations being
made in all months except January. The ma jority of records were taken over periods near noon but some evening and nighttime observations were also made. In general all records were made under the same conditions except that the transmitter power was down by a factor of 3 in November 1966, and June and July 1967.
This chapter is devoted to a discussion of the phase observation of echoes received from below
100 km. Since the total recording time extended over
many hours every feature of the individual phase records
cannot be discussed. Instead sections of records
representative of each season are presented, except
where special phenomena were observed.
5.1 EXAMPLES OF RECORDS .
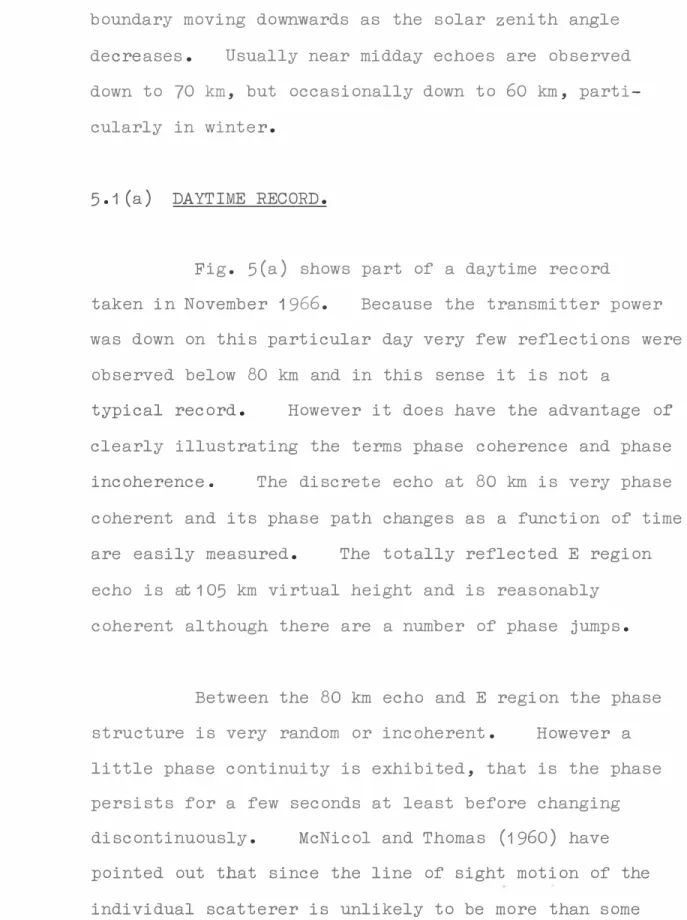
boundary moving downwards as the solar zenith angle decreases. Usually near midday echoes are observed down to 70 km, but occasionally down to 60 km, parti cularly in winter.
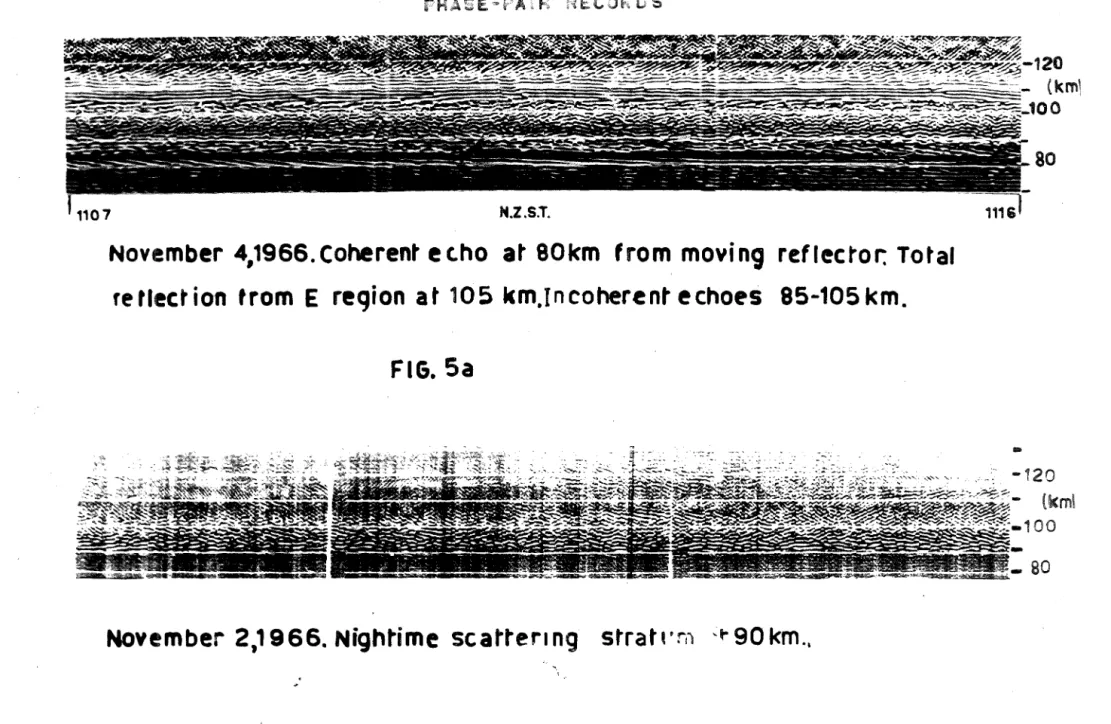
5.1 (a) DAYTIME RECORD.
Fig. 5(a) shows part of a daytime record
39
taken in November 1966. Because the transmitter power was down on this particular day very few reflections were observed below 80 km and in this sense it is not a
typical record. However it does have the advantage of clearly illustrating the terms phase coherence and phase incoherence. The discrete echo at 80 km is very phase coherent and its phase path changes as a function of time are easily measured. The totally reflected E region echo is at 105 km virtual height and is reasonably
coherent although there are a number of phase jumps.
N.Z.S.T.
November 4,1966.Coherent ec.ho at 80km from moving reflector: Total
retlection from E region
at
105 km.Incoherent echoes 85-105km.
FIG.
Sa
November 2,1966. Nightime
scattering
strat,·rn
-~90km ..
-8
1 6
1 2
.1P 8
(Wav el engths)
4 -6
P H ASE PATH CHAN G E S MO V I N G I R R E G UL AR I T Y
80 km. 4
No v
1 9 6 6-4
, o
1 6
1 4
1 2
1 0 (waveleng�hs)
-2 0
t(m i n s)
S P E E u PLO T
2 0 3 0
t1.(min s1)
F I G U R E 6
2
40
4
50
6 8
meters/sec an individual contribution to the total signal will not change substantially in less than the time the reflector takes to move a tenth of a radio wavelength (a few seconcs). The phase over the whole
signal will not change by very much in the same time.
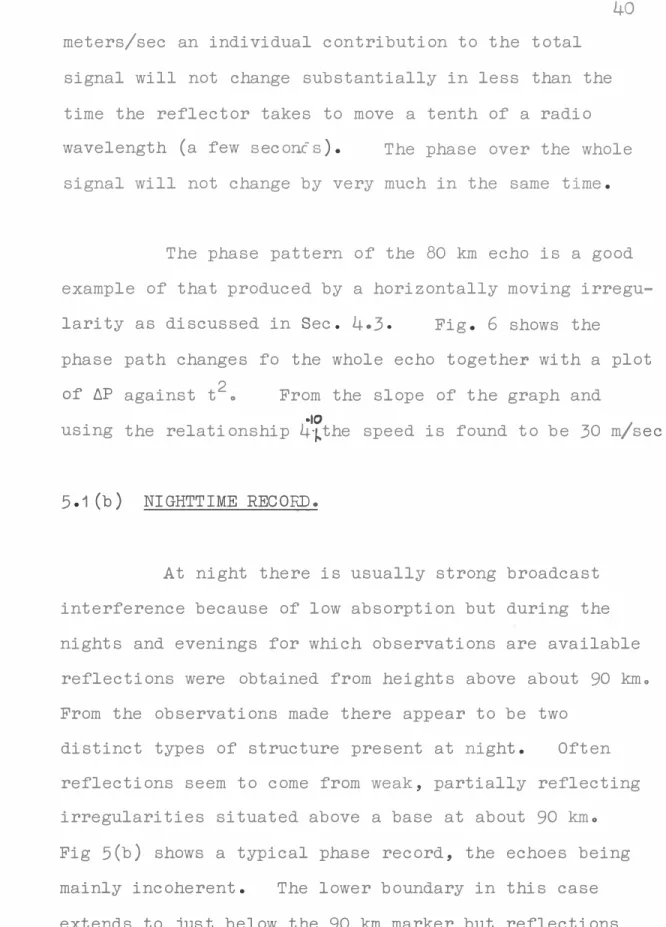
The phase pattern of the 80 km echo is a good example of that produced by a horizontally moving
irregu-larity as discussed in Sec. 4.3. Fig. 6 shows the
phase path changes fo the whole echo together with a plot of LlP against t2
o From the slope of the graph and
using the relationship 4•10 -�the speed is found to be 30 m/sec.
5.1 (b) NIGHTTIME RECORD.
At night there is usually strong broadcast interference because of low absorption but during the nights and evenings for which observations are available reflections were obtained from heights above about 90 kmo From the observations made there appear to be two
41
were occasionally observed down to 85 km. The upper
boundary of the scattei� is less well defined but
reflections appear to terminate between 1 00 and 1 1 0 km.
However these echoes are often marked by very strong reflections from clouds of high electron density,
presumably sporadic E layers (Smith and Matsushita
(1 962 ) ) 0
These phase records are quite coherent and they show
signs of horizontal movement, usually appearing at heights between 100 and 1 20 km. These layers are usually transitory in nature, but the stratum at 90 km seems more permanent.
5.2 MOVING IRREGULARITIES IN THE D REGION .
Before going on to discuss the detailed structure of the ionosphere it is of interest to know over what angles reflections were effectively received.
The beamwidth to the half power points of the trans mitting aerial array was 50° x 30° so that at a height of 80 km the aerial aperture would have dimensions the order of 75 by 43 km. An estimate of the actual
semi-cone angle over which the transmitter and receiver effectively detect energy can be made using the speed and duration of moving reflections of the type shown in
relationship existed between the speed and inverse of the duration of moving irregularities observed in the E region. The slope of the graph giving the distance over which the reflections effectively return energy. Fig. 7 shows a similar plot for moving echoes observed
in the present experiment at heights between 70 and 80 km and although there is some scatter a reasonable straight line of slope 13.5 km can be drawn through
the points. Taking the mean height as 75 km this gives approximately 10° as the semi-cone angle.
As far as is known this is the first time
that horizontal moving irregularities have been observed directly in the D region. The maximum measured change in phase path has been only 2-3 km, implying total
changes in slant range the order of 1 km, which prob ably explains why they have not been detected before, by even sensitive group height measurements (Gregory
( 1 961 ) ) •
S
P E ED
(
K M. M l
N
-1
}
6
2
- -1
SPE E D v s.(S E M I- O U R A T l O N-)
O F
MOV i N G
I
R. R E
G
U
L A R
I
T
1£
S
( 7 0 - 0 0 k m. R E GI O N )
S L O P E :: 13 ·5 KM.
0·1 0·2 0·3 0·4 O·S 0·6
I
NV E
RSE
SE
M l·D U RAT
l
O N
l
M
I
N·1 )
5.3 PHASE COHERENCE OF REFLECTIONS FROM HEIGHTS BELOW 100 KM.
In Sec. 4.1 it was pointed out that a phase co
herent echo results when only one reflector at a given
height is dominant. However it was shown above that reflections from scatterers in an area of radius 14 km at 75 km, and proportionally at other heights, can be
detected. This suggests that coherent reflections
come from either irregularities of some horizontal
extent, so that they fill an appreciable part of the
aperture, or they come from isolated "blobs" of electrons. Whatever the situation, observations of how the "aver age" coherence of the echoes at a given height changes with season should relate to changes in ionospheric
il
structure o For example the coherence decreases from
one month to the next this would imply an increase in small scale structure leading to increasetlscattering.
To see how the phase coherentevaried with
season at different heights below 100 km the records were �uantitatively assessed in the following fashion.
Each film record was divided into 5 km height groups,
the lowest commencing at 70 km, and into consecutive
2 minute intervals. The individual echoes in each
-(a ) Phase C oherent:
-44
if the phase over the echo at any instant was constant and
showed good continuity with tirne o (b ) Partially Coherent:-ir some phase pattern were ob
vious but showed a number of discontinuities.
(c ) Incoherent:- no apparent phase pattern.
TABLE
5
PERCENTAGE TIME ECHOES PRESENT BELOW 80 KM FOR HOURS NEAR NOON.
MONTH 70-75 75-80 REMARKS
KM KM
SEPT 1 966 85 1 00
OCT 65 90
NOV 1 0 50 Tx power down
DEC 75 90
FEB 1 967 75 95
MARCH 32 90
APRIL
-
90MAY 60 75
JUNE 85 1 00 Tx power down
For any particular height range estimations of coherence were onJ.y made when echoes were present. As Table 5 shows this was of consequence onJ.y for
reflections between 70 ar.d 75 km. To lessen any depend -ence on solar zenith angle only records taken for at least an hour near midday were evaluated.
For easier presentation of results a "coherence coefficient" was devised. The coherence types (a) ,
(b ) and (c ) were given numerical weights of 2, 1 , and 0 and if the numbers of each type for a given range and record were found to be n1, n2 and n3 respectively the
coefficient c was given by
C = 2n1 + n2
2 (n1 + n2 + n3)
The closer c is to unity the more cohereI'-t the echoes in the total time interval 2(n1 + n2 + n3) minuteso The monthly plots of coherence coefficient against height are shown in Figo 8 and the values are replotted in Fig. 9 for each height range as a function of time. The vertical bars show the standard deviation of the daily values of c for each month.
-S EPT. . 55·
OCT. 6 6
�av.
6 5D E G 6 6
F E B. 67
1·0
0·5
0
1 ·0
0·5
1 0
0·5
0
1-0
0,5
1 -0
0·5
O ·
M A R. 67
APR. 67
M A Y 67
�'j
JU NE 67
J ULY 67
70 75 0 5 90 9 5 7 0 7 5 8 0 5 90 9 5
HEIGH T R A N GE { KM) H E ( GH T R ANGE (KM)
M
ont'hly
pl ot"s o f
coheren ce coef f icie n r as a fu n ct'io n o f
he·1 g h
0-5 / ' , • '
_ _ ,___ __
' ,---
. ...1-0 ---.
ro ---.
� 0 - 85 KM-- -
J-,.0 ,.---.
8 5-9 0 KM
0·5
.,
1·0---,
0.5
.l .
-1-0 r---,
0·5
s
o
N
1 g 66
95-1 0 0 K M
-
--
- -"I"""-
-
-D J
I 1 9 G 7 M A M
Co h e rence plots as a f u nc t i o n of r"1me
Fr G U R E 9
46
�i ) There is in general fairly steady decrease or coherence with height, echoes from above
85
km being mainly incoherent at all times.(ii) Seasonal variation,in coherence are strongest ror reflections from altitudes below
85
km.Echoes, when they are present, being most coherent in September to November (Southern Hemisphere Spring) and in March (Autumn). In local summer the echoes tend to be more in coherent but not to the same extent as they are in winter, when coherence falls to zero in the 70-80 km range in June.
Although the coherence coefficient i s a some what crude device it does summarize the phase information contained in the records. If as, di scus sed above phase coherence can be taken as a reasonable index of ionospheric structure, it would seem that above
85
km the structure is random at all times of the year, and below this height at the solistices.5.4 PHASE PATTERNS OF LOWER IONOSPHERE REFLECTIONS.
5.4 . (a) SPRING AND AUTUMN.
(Fig.5(a)) has already been discussed in 5.1, the
main features being the very coherent phase pattern caused by a moving reflector. Echoes of this type were only observed in spring, autumn and to a lesser
extent in summer. The measured speeds ranged from
20m/sec. (Sept., Oct. and March) to 1 00 m/sec. (late February), the most probable velocity being about
60m/sec.
The phase patterns observed in spring (September to November) and early autumn (March) often suggested the reflections came from drifting patches of ionization. Figs. 1 0 (a) and (b) show typical records made in September and October with
phase coherent echoes from near 75 km, the tilted fringes suggesting irregularities drifting overhead with quite
low velocities. Reflections are coherent for periods
up to 15 minutes or more and even with the lowest observed speed of 1 km/min (1 7m/sec) this suggest
horizontal scales the order of 1 5 km at least. These dimensions are possibly an underestimate since as the irregularities pass overhead the reflections often be
come incoherent for short intervals. It is difficult
September 16,1966.
FIG- 10
a.
IU.IJ'.
October 4,1966.
A&. 10 b.
Phase-path rec ord s showin g d is c.r e t e coherett t re f l e c t ions
occurrinCJ bet wee n 7 O & B O km.the downward Hlted frrnge
p atterns Ind icati n g decreas ing pnase pa ths.
with the belief tbat phase coherent reflections come
from irregularities having some horizontal extent. As
well as the moving irregularities stable reflecting
regions also seem to exist at the equinoxes. Fig.1 1 (a)
shows a record made on the 2 6 th October 1 96 6 , the dis
crete, phase coherent echo between 70 and 80 km shows a distinct oscillation over a period of roughly 10 minutes.
Fig. 1 1 (b ) shows the plot of its phase path changes while it remained coherent, the fluctuations being quite slow. This phase record was terminated by a period of incoher ence and then followed by a further period of slow phase
changes at the same height. The same type of echo
structure was also evident on the 2 5th and 2 7th October,
suggesting the reflections came from a stable stratifi
cation having an undulating lower boundary.
For the particular phase record shown in
Fig 1 1 (a) a comparison can be made with measurements of the fading period of the echoes made using the spaced receiver experiment at Birdling's Flat (Fraser (1 96 5a )). This technique measures the drifts of partially re
flecting irregularities at various discrete heights in the D region by the well known Mitra (1 949) method. For a single receiver if the amplitude as a function of time is
A (t )
then the autocorrelation coefficient100-kllll
PH A S E - PATH R EGORO
N.Z.1-T.
October 26, 1966. Phase c oherent ec.ho at 7 5 km with undu la t ing
phne pattern.Incoherent sporad
_
Ic-E reflection at 10 0 km.
8
AP
IVtllftghs) 2
0
-2
,
..
-Fl6.11 a.
10IO
..Z.S. T.
Phase path changes of 7 5km echo. 2 6 October 1966
FIG. 11 b.
_
<A(t) A(t + -r;) > r (-r;) - 2<A (t )
>
< > denotes time average.
By definition p (o) = 1 and the fading period is given by the lag -r;0 such that r (-r;0 ) = 0.5.
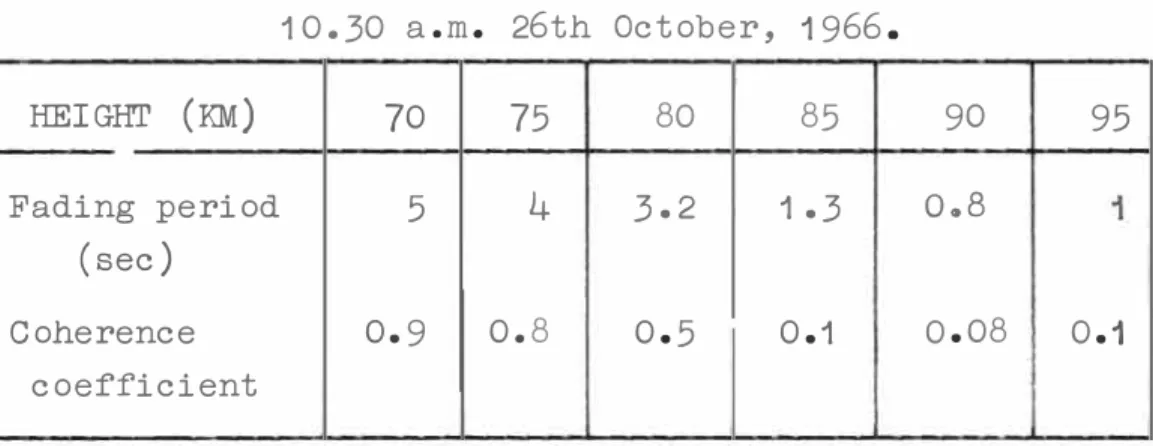
TABLE 6
COMPARISON OF FADING PERIOD AND COHERENCE COEFFICIENT . 1 0 . 30 a.m. 26th October, 1966.
HEIGHT (KM) 70 75 80 85 90 95
Fading period 5
4
3.2 1 .3o.B
(sec)Coherence 0.9 0.8 0.5 0.1 0.08 0.1 coef'ficient
Table 6 shows the fading rates as measured by the drif'ts experiment and the coherence coef'f'icients obtained f'rom the phase records taken over half' and hour,
the phase structure not changing signif'ically in that time. The echo amplitudes were sampled at 5 km height intervals in sequence for periods of' 5 minutes eacho
fading period �nd coherence at each height.
50 This is to be expected since the more scattering irregularities present the more phase incoherent the resultant echoes and the higher the fading rates. Although this is the only comparison available at present, it does give some confidence in the use of the coherence coefficient as a measure of ionospheric structure.
A discrete phase stable layer at 75 km was
also a feature of one of the records made in early May. The phase path changing slowly over a few minutes. However the strength of the reflections was appreciably less than the corresponding echoes observed in October. This weakness in signal strength seems a characteristic of the echoes returned from below 80 km in late autumn. No echoes were observed below 75 km on the 3 observing days in April for instance. The echoes were also more
incoherent than those observed in March.
5o4 (b) SUMMER.
Although a few coherent morning irregularities were observed the echoes from all heights in summer
partially r� flic.t i n g st rat um at 92 km, contm uous anc.ohe r e n t e choes
down t-o 7 0 km. N o te coher e nt 'se a ret u r n' below 7 0 km.
FI G 12a
'