REVIEW
Quantifying Golgi structure using EM: combining volume-SEM
and stereology for higher throughput
Sophie Ferguson1 · Anna M. Steyer3 · Terry M. Mayhew2 · Yannick Schwab3 ·
John Milton Lucocq1
Accepted: 22 March 2017
© The Author(s) 2017. This article is an open access publication
where small samples of cells are treated and where there may be variable responses. For Golgi study, we outline a series of stereological estimators that are suited to these analyses and suggest workflows, which have the potential to enhance the speed and relevance of data acquisition in volume-SEM.
Keywords Golgi · Stereology · Volume-SEM · FIBSEM · SBF-SEM · Sampling · Quantification
Introduction
Electron microscopy (EM): a tool of choice for high-resolution quantitation
The Golgi complex comprises a stack of membrane-bound cisternae associated with tubules and vesicles (Farquhar and Palade 1981, 1998; Berger and Roth 1997) and functions in the transport, processing and sorting of cargo from the endoplasmic reticulum (ER, Farquhar and Hauri 1997; Barlowe 2002; Geva and Schuldiner 2014). Currently, important questions remain about the Golgi’s molecular and structural framework, its mechanisms of cargo transport (Day et al. 2013; Glick and Luini 2010; Papanikou and Glick 2014), cell cycle transformations (Lucocq and Warren 1987; Lucocq et al. 1989, 1995; Lippincott-Schwartz and Liu 2006; Colanzi et al. 2007; Tang and Wang 2013) and the coordinated function of its stack in transport (Day et al. 2013; Lavieu et al. 2013,
2014). Increasingly, answers have been sought by apply-ing high-throughput techniques that can analyse extensive arrays of experimental or genetic manipulations (Simp-son et al. 2012; Verissimo and Pepperkok 2013; Flottman et al. 2013). Electron microscopy (EM) is a key tool for
Abstract Investigating organelles such as the Golgi com-plex depends increasingly on high-throughput quantita-tive morphological analyses from multiple experimental or genetic conditions. Light microscopy (LM) has been an effective tool for screening but fails to reveal fine details of Golgi structures such as vesicles, tubules and cisternae. Electron microscopy (EM) has sufficient resolution but traditional transmission EM (TEM) methods are slow and inefficient. Newer volume scanning EM (volume-SEM) methods now have the potential to speed up 3D analysis by automated sectioning and imaging. However, they pro-duce large arrays of sections and/or images, which require labour-intensive 3D reconstruction for quantitation on lim-ited cell numbers. Here, we show that the information stor-age, digital waste and workload involved in using volume-SEM can be reduced substantially using sampling-based stereology. Using the Golgi as an example, we describe how Golgi populations can be sensed quantitatively using single random slices and how accurate quantitative struc-tural data on Golgi organelles of individual cells can be obtained using only 5–10 sections/images taken from a volume-SEM series (thereby sensing population param-eters and cell–cell variability). The approach will be use-ful in techniques such as correlative LM and EM (CLEM)
* John Milton Lucocq [email protected]
1 Structural Cell Biology Group, School of Medicine,
University of St Andrews, North Haugh, Fife KY16 9TF, Scotland, UK
2 School of Life Sciences, Queen’s Medical Centre, University
of Nottingham, Nottingham NG7 2UH, UK
3 Cell Biology and Biophysics Unit, European Molecular
answering these questions at a meaningful and informa-tive resolution.
Light microscopy (LM) is well suited to revealing dynamics of Golgi function and can be automated easily, allowing arrays of experimental or genetic conditions to be evaluated. However, LM lacks the resolution needed for visualising the structural elements of the Golgi directly (Durisic et al. 2014). EM is a more suitable tool because it can visualise membranes, tubules, vesicles, (Amos and Grimstone 1968; Lucocq et al. 1995; Trucco et al. 2004; Martínez-Alonso et al. 2013; Beznoussenko et al. 2014; Mourik et al. 2015) as well as fine details such as structural stages in vesicle and cisternal biogen-esis (Amos and Grimstone 1968; Lucocq et al. 1995; Pel-let et al. 2013; Martínez-Alonso et al. 2013). EM also displays the Golgi in a cellular context allowing simulta-neous study of related membrane traffic organelles such as ER and plasma membrane.
State of play in TEM
Transmission EM (TEM) has been a principal tool for quantifying the Golgi for several decades but it has cer-tain disadvantages which include the inefficient acquisi-tion of accurate data, slow speed of specimen preparaacquisi-tion (Robinson 1980; Oke and Suarez-Quian 1992; Yelinek et al. 2009) and rather protracted procedures for search-ing, focussing and image capture. A further problem is the reliance on small and two-dimensional imaging “windows” that are produced when ultrathin sections are examined at high magnifications. The information in these images is often perceived as poorly represent-ing 3D structure or the wider scale quantities of orga-nelles (Lucocq et al. 2015). One possible solution is to acquire 3D data by serial section reconstruction (Fig. 1a; Mogelsvang et al. 2003; Yelinek et al. 2009) or electron tomography (Fig. 1b; Marsh et al. 2001, 2004; Mogels-vang et al. 2003; Marsh and Pavelka 2013). But these techniques are even more labour intensive than conven-tional TEM and concentrate efforts on limited regions of the sample. Another solution is to sense 3D quantities over a wider scale using stereology (Weibel 1979; Elias and Hyde 1980; Lucocq 1993; Howard and Reed 2005; Nyengaard and Gundersen 2006), a method that utilises random sampling combined with estimation of 3D struc-tural quantities to link 2D quantities with 3D reality. Interestingly, stereology is now becoming more popular (Pubmed search returns for the term “stereology” have increased fivefold in 20 years), but it is still underused in the Golgi field (see Griffiths et al. 1984, 1989; Lucocq et al. 1989, 1995; Bannykh et al. 1996; Seguí-Simarro and Staehelin 2006).
Volume-SEM techniques: new opportunities for quantifying Golgi
Over the past decade there have been breakthroughs in specimen preparation and imaging for EM, each having the potential to improve the efficiency and throughput of Golgi quantitation. Collectively, these developments are termed volume-SEM (Fig. 1c; Titze and Genoud 2016) and involve successive and automated removal of thin layers or sections of sample, followed by imaging in a high-resolution scan-ning EM (SEM). The methods generate large series of sec-tions or images that can be wide ranging in area (because of the wide field nature of SEM imaging) and extensive in the direction of sectioning yielding large amounts of 3D information. In all the volume SEM approaches imaging is achieved using high-resolution SEMs with sufficient x, y resolution to reveal most Golgi structures although this remains inferior to TEM (Wanner et al. 2013; Hughes et al.
2017; Koga et al. 2016).
Two volume-SEM methods use automated removal of thin layers of specimen inside an SEM chamber followed by automated scanning-electron imaging at high resolution. In serial block face SEM (SBF-SEM; Leighton 1981; Denk and Horstmann 2004; Hughes et al. 2014), a conventional microtome situated inside the microscope chamber shaves thin layers successively from the sample. SBF-SEM pro-duces images that measure millimetres across and have a minimal shaving z-thickness of approximately 30 nm (Titze and Genoud 2016). Even thinner sections are possible under special circumstances (Titze and Genoud 2016), allowing isotropic data assemblies (with voxels of about 10 nm in x, y and z directions). Initially, the SBF-SEM technique was used to study connectivity in millimetre-sized chunks of brain tissue (Kuwajima et al. 2013), but has been used suc-cessfully to image Golgi and other membranous organelles (Hughes et al. 2017). The wide scale view produced by SBF-SEM makes it ideal for sensing large populations of Golgi complexes in tissues or cell cultures although more restricted investigations on individual cells are also possi-ble. The second method uses a focused ion beam to erode the sample in successive layers inside the SEM (FIBSEM; Fig. 1c, d; Ballerini et al. 1997; Knott et al. 2011; Wei et al.
A third method is best classified as section array-SEM (Fig. 1c; Micheva and Smith 2007; Hayworth et al. 2014; Titze and Genoud 2016; Wacker et al. 2016) and uses the surface imaging capability of SEM on extensive arrays of sections prepared outside the SEM on a conventional TEM microtome. One interesting approach collects sec-tions on a continuous tape substrate before mounting them in arrays on a hard substrate for SEM imaging (Hayworth et al. 2014; Koga et al. 2016). The advantage with array-SEM is that sections can be processed (stained/immu-nostained) after slicing and re-examined or sampled at any time, greatly reducing image storage needs. Software exists for mapping and imaging in a semi-automated manner (Domart et al. 2012; Hayworth et al. 2014). A major differ-ence from block-face techniques is that the sections in array SEM are thicker, 50–100 nm, although they can be as thin as 29 nm (Kasthuri et al. 2015); and like TEM sections are often prone to section compression and folding.
Improving efficiency: sampling combined with design-based estimators
The facile generation and imaging of thousands of sections in volume-SEM is a major improvement on TEM, allowing
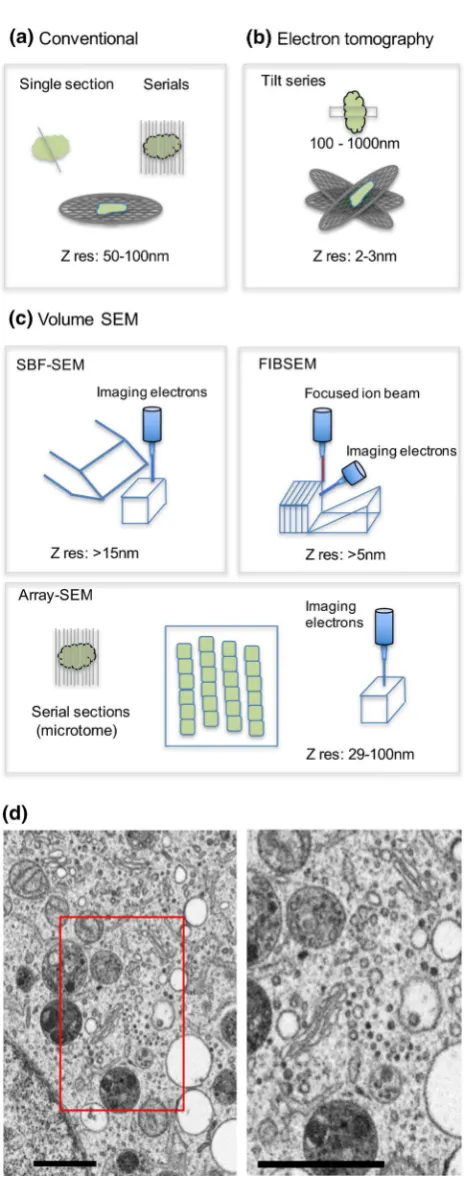
generation of 3D information either by manual segmenta-tion or image recognisegmenta-tion software. Models of 3D struc-ture can then be reassembled and probed quantitatively (Tsai et al. 2014). Thus, the temptation in volume-SEM is to store and analyse all the data from the section/image Fig. 1 New volume-SEM techniques compared to conventional and
tomographic TEM analysis. Using conventional techniques compre-hensive 3D information has been acquired using either serial sections (a 50-100 nm thickness) or electron tomography (b z resolution as little as 2–3 nm). Tomography involves tilting of thicker samples (200-1000nm; Lindsay and Ellisman, 1985; Walther et al. 2013) and back projection to provide 3D information (Donohoe et al. 2006; Marsh and Pavelka 2013; Marsh et al. 2004). However, the usefulness of tomography for whole Golgi studies has been limited due to the comparatively shallow sample depth and narrow scale. These serial section/imaging techniques are labour intensive in obtaining full 3D datasets of Golgi. Volume-SEM techniques (c) automate collection of exhaustive serial section/images and include serial block face (SEM) and focused ion beam SEM (FIB(SEM) and array-SEM. SBF-SEM and FIBSBF-SEM improve z resolution with section/imaging thick-ness between 5 and 30 nm and work by iterative removal of sample block-face by physical slicing (SBF-SEM) or by ion beam erosion (FIBSEM), followed by imaging in the SEM. Improved z resolution yields large datasets requiring storage in silico, and prompts devel-opment and unbiased data mining using stereology. SBF-SEM tech-niques are adapted to imaging wider scales of tissue (Bosch et al.
2015; Kuwajima et al. 2013; Titze and Genoud 2016), while FIB-SEM is narrow-scale allowing focused analysis on single cells. Imag-ing the block-face improves stability of the 3D array. Array-SEM involves preparation of large arrays of serial sections on conventional microtomes, and section thickness can be little as 29 nm (Kasthuri et al. 2015). Typically, sections are collected on tapes, which are mounted in short series on hard supports prior to SEM imaging. Sec-tions can be prone to dimensional instability and folding. In this case sections can be re-probed reducing the need for in silico storage. d
Illustrates a typical image from of a Golgi complex region of a HeLa cells obtained using FIBSEM imaging (5 nm pixels). Boxed area in low magnification image (left) is displayed at higher magnification (right). Bars 1 µM
[image:3.595.309.543.46.637.2]arrays. This approach has advantages because segmentation and 3D reconstruction preserve a rich array of informa-tion about posiinforma-tion, connectivity and shape of Golgi struc-tures (Hughes et al. 2017). But it is also time consuming and labour intensive and only small numbers of the cells in a population can be examined reliably. This reduces the knowledge of biological or experimental variation and lim-its relevance of the data to the Golgi population (Lucocq et al. 2015).
The challenge in volume-SEM is how to sense quantita-tive data more rapidly with less work but at the same time make it relevant to the wider experimental context. One solution is to use a sampling-based stereological approach. Stereological protocols first select tiny fractions of the slices and/or SEM images, prior to quantifying selected structural quantities using appropriate estimators (Shomo-rony et al. 2015). In this way the careful design of stereol-ogy preserves links with the real arrangement of matter in the 3D structure of the biological object (the morphome; Lucocq et al. 2015; Mayhew and Lucocq 2015). This quali-fies stereology, along with serial-section reconstructions, as a bona fide “morphomics” method (for further discussion, see Lucocq et al. 2015; Mayhew and Lucocq 2015). Signif-icantly, the stereological approach can reduce the amount of work done on individual cells while providing precise and minimally biased estimates of 3D quantities.
The first step in stereology is random sampling, which removes selection bias and preserves reliable links between images and 3D quantities [described in the Fig. 2 (left)]. Random sampling ensures non-preferential selection of items, slice positions and, where necessary, slice orienta-tions through each of the Golgi elements in a population. When random sampling is applied at all levels of sample selection (from animals/cell cultures, specimen blocks, sec-tions, images to estimator probes), the accompanying struc-tural estimates can be unbiased. A modification to random sampling, called systematic uniform random (SUR) sam-pling, can improve precision further (Fig. 2 left; Gundersen and Jensen 1987; Lucocq 2012). Here samples, sections, images and even estimator probes, are used in a regular array. The SUR sampling array is much easier to apply than random sampling and makes quantitative sensing more efficient when dealing with the heterogeneous structure of biological samples. Extensive experience shows that SUR sampling tends to be more efficient than simple random sampling of biological specimens and decades of research results have confirmed its power in quantitative analysis (Howard and Reed 2005; Mayhew 2008).
The second element in stereological design is applica-tion of estimators for sensing 3D quantities from 2D pro-files in the SEM or TEM image. The use of geometrical probes (Figs. 2, 3, 4) is carefully designed to allow unbi-ased and efficient estimates of quantities such as volume,
surface, length or number. The probes (points, lines, planes) are applied to images on which counts of interactions with the compartments of interest can be converted into relevant structural quantities. A biological specimen (organ, tissue, cell, cell compartment) is one of a number of independent sampling items or replication units in a set. Remarkably, SUR sampling of stereological estimators through the spec-imen of interest is an efficient strategy for quantitative anal-ysis. Often, only 100–200 counts of chance probe–structure interaction are required per specimen to achieve acceptable levels of estimation precision for comparing different (e.g. control and experimentally-treated) specimen sets (Howard and Reed 2005; Mayhew and Lucocq 2015).
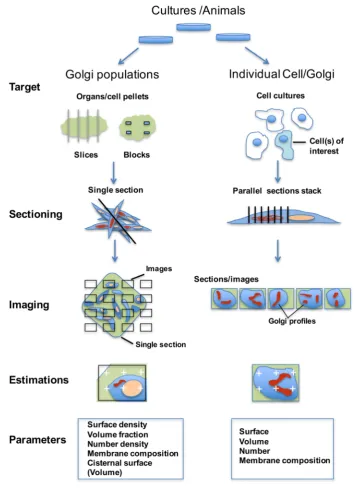
In the following, we discuss how (1) stereology of sin-gle SEM slices can be used to sense accurately global changes in a Golgi population and (2) stereology applied to local arrays of parallel sections can sense 3D parameters in individual Golgi organelles. The “parallel section stack” approach greatly increases the number of single cells that can be analysed allowing the sensing of both inter-cell vari-ability and the population parameters of interest—a sig-nificant improvement in efficiency compared to the serial reconstruction from exhaustive sectioning. Importantly, the application of parallel section stacks will allow the study of Golgi in rare subpopulations (Fig. 2, right; Narayan and Subramaniam 2015; Russell et al. 2017) such as those gen-erated by correlative LM and EM (CLEM; Flottmann et al.
2013), where individually treated cells (or groups of them) are first identified using LM before being relocated and examined in EM.
Single section/image sensing: sampling and estimators
Single, wide-ranging sections/images can be prepared by SBF-SEM, array-SEM and also TEM. The size of the section is set by the width of the diamond knife, and can range across mm size cell pellets or tissue blocks. FIB-SEM images come from a more restricted block face, which makes them less suited to single slice/image analysis because they are set locally in the sample.
Fig. 2 Sampling strategies allowing the use of single sections or par-allel section stacks. The population may comprise animals, cell cul-tures or subcellular Golgi fractions from which organs or cell/orga-nelle pellets or culture dishes are processed for fixation. Left Single section analysis on Golgi populations. The items (organs/cell pellets) are fragmented or sliced systematic uniform random (SUR) before being further divided to provide specimen blocks. For single sec-tion analysis, blocks are most conveniently secsec-tioned by microtomy (inside the SEM (SBF-SEM) or on a conventional microtome, (array-SEM) before imaging using (array-SEM). Typically, 10–20 images are taken in an SUR array. Estimations are carried out using geometric probes applied to the images (see Figs. 3, 4, 5). Right parallel section stacks
[image:5.595.112.467.55.545.2]systematic arrays of test point probes are applied to the images (Fig. 3a) and the test points “landing” on a Golgi structure and on a suitable reference volume (say, the cell) are counted. The fraction of points falling on the Golgi structure is then an unbiased estimate of its volume fraction within the cell.
Similarly, packing density of surface in reference vol-ume (surface density) is estimated using test line intersec-tion counting (see Fig. 3b). In this case, randomly oriented (isotropic) encounters between the sample and probe are required. This can be achieved by embedding the sample in a ball of gelatine, which is rolled prior to embedding and slicing and imaging (isector, Nyengaard and Gundersen
1992).
Another approach to surface estimation is the verti-cal section method, which confers isotropy when sine-weighted or cycloid test lines are used (Fig. 3c; Baddeley et al. 1986). Here, the section is prepared along (and ran-domly rotated around) a vertical axis which itself lies at right angles to an arbitrarily chosen horizontal plane. By placing a systematic array of cycloid arcs or sine-weighted test lines over a micrograph, the surface density can be esti-mated unbiasedly. The horizontal plane can be chosen by the investigator and could conveniently be represented by a tissue plane or the bottom of a cell culture dish.
The Golgi can be conveniently analysed across the
Golgi stacks recorded from sections that are already ran-domly positioned and ranran-domly oriented (not vertical). The investigator now searches for Golgi stacks where the section passes orthogonal to the membranes ignoring tan-gentially sectioned profiles. This creates a so-called local vertical window (LVW; Fig. 3d), on which cycloid arcs can be placed according to the vertical (now cis–trans) direction. Figure 3e compares estimates for Golgi stack membrane surface density obtained using LVWs and the traditional line intersection method on the same sample. LVWs have the advantage of preserving orien-tation (Bruel and Nyengaard 2005) along the cis–trans
axis of the Golgi stack and could be used for analysing stack composition or regional differences in the surface
areas of vesicle, tubule or cisternal membrane pools (see below).
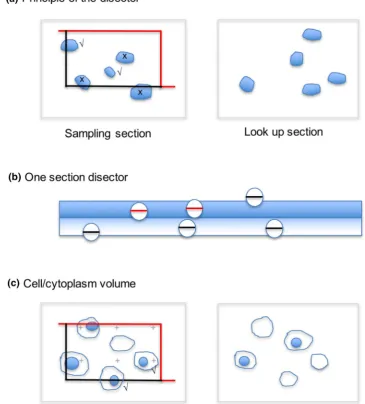
In most cases, number density cannot be sensed on sin-gle sections. Rather a volume probe composed of two par-allel sections is required (Sterio 1984; Gundersen 1986; Lucocq and Hacker 2013). One of these sections is used to sample the profiles unbiasedly and the other is used to detect the profiles that disappear (see Fig. 4a). The disap-pearing profiles then have edges situated in the volume between the slices and are counted. The volume probe formed by the two parallel sections is called a disector (Ste-rio 1984; Gundersen 1986).
A special case occurs in conventional TEM when struc-tures, such as vesicles, and the sections used are compara-ble in size (e.g. Golgi vesicles measure 60–70 nm and TEM sections, 50–100 nm; Lucocq et al. 1989; Nyengaard and Gundersen 1992). Now, conveniently, a substantial fraction of vesicle equators will appear in one section but not the next—effectively making a one-section disector (Fig. 4b). Knowledge of the average section thickness, combined with point counting for estimating the reference volume, provides an estimate of numerical density. The procedure involves first checking in two parallel sections the prob-ability that vesicle structures under investigation will “dis-appear” in the look-up section and assumes vesicle size is unchanging across different analysis conditions. It is impor-tant to note, however, that when the imaging depth of vol-ume SEM techniques is substantially less than the physi-cal section thickness, the use of a one-section disector can result in the loss of Golgi vesicle waists leading to bias in the estimates (see Fig. 4b legend for details).
Counting vesicles unbiasedly is known to be important in cell biology (Smythe et al. 1989). There are thousands of vesicles present in the Golgi region (Marsh et al. 2001) and they belong to two principal vesicle populations with cytoplasmic coats composed of coat protein 1 (COPI) or clathrin (Faini et al. 2012, 2013; Martínez-Alonso et al.
2013; Jackson 2014). Quantitative studies of COPI vesicles are limited to the LM level (e.g. Pepperkok et al. 2000) or to small samples examined by tomography, while clathrin-coated vesicles have been quantified at the plasma mem-brane (Smythe et al. 1989).
With the stereological estimators discussed above, it is important to be conscious of the potential pitfalls. The density of volume, surface or number of Golgi structures are especially useful in screening procedures, but densities are sensitive to the size of the reference volume (reference trap; Braendgaard and Gundersen 1986; Howard and Reed
2005). For instance, a decrease in the reference volume can increase the density of a given compartment without any real change in its absolute quantity. A quick aid to interpre-tation is to use two sections with known spacing in a disec-tor (imaged conveniently in the SEM (or indeed in TEM) at Fig. 3 Estimation of volume and surface from single sections. a The
packing density of structure volume in a reference volume (e.g. cyto-plasm) can be estimated by counting the ratio of points that fall on structure (Golgi component of interest) versus the points that fall on the reference volume (e.g. cytoplasm). Points are defined by the cor-ners that lie between grid-lines or crosses arranged in a regular lat-tice pattern. b The packing density of surface in a reference volume is estimated using interactions between randomly positioned and ori-ented test lines and Golgi membranes. Sample position is randomised using SUR sampling and orientation randomised using the isec-tor [embedding in a ball of gelatin, which is rolled randomly before slicing; Nyengaard and Gundersen 1992; isotropic uniform random (IUR) section]. Systematic arrays of test lines are superimposed on images and intersection counts (I) between line edges and Golgi membranes counted (red arrowheads). Surface density, Sv = 2I/L, where line length L applied to the reference space (e.g. Golgi stack) is estimated by counting points over Golgi cisternae (blue arrows) multiplied by the line length associated with each point. c In the vertical section (VS) method, a section is cut in a vertical direction, orthogonal to a convenient/arbitrary horizontal plane such as the bot-tom of a culture dish. The section must have random placement and freedom of orientation around the vertical. Cycloid arcs aligned with the vertical direction represent a full distribution of isotropic lines in 3D space. Intersections (I; redarrrowheads) are counted and surface density, Sv = 2I/L, where again, L is estimated by point counting (blue arrows) as described in (b). d Local vertical windows (LVWs). In IUR sections, the animal cell Golgi twists and turns in 3D making it difficult to identify and quantify regional elements (e.g. cis, medial
and trans). Local vertical windows (LVWs) first “choose” stack pro-files with membranes that present clear cisternal membrane propro-files with minimal thickness. These represent Golgi stacks sectioned in a
cis–trans direction. A line of best fit drawn “parallel” to Golgi cis-ternae membranes now traces a horizontal plane in 3D (dashed line) with the vertical in a cis–trans direction. A cycloid array is used to estimate the Sv of any membrane or substructure across this axis estimated using the same formula as above (red arrowheads indi-cate intersections between cycloids and cisternal membranes; point counts for estimating line length omitted for clarity). Graph in (e) compares estimates obtained using LVWs and isotropic line meth-ods. For these data multiple Golgi stacks were generated in RK-13 cells using the drug nocodazole. Estimates obtained with the LVW method stabilized faster than for the isotropic lines method across a series of images. LVWs, N = 12 images and for isotropic line, N = 20.
Error bars are standard error of the mean calculated for a ratio esti-mate according to Cochran (1977). Section orientation requirements: R-sections with random orientations; VS-sections with vertical orien-tation
Fig. 4 Single section analysis of number and reference volume. Number estimation requires a volume probe composed of two sec-tions with known spacing (a disector). a The principle is to select particle profiles on one plane (sampling section) using an unbiased counting rule applied to a counting frame (quadrat). Particles are selected if enclosed either partially or completely within the frame and are not crossed by the forbidden line (red). Particles are counted only if they disappear in the lookup section (Q−). b In conventional
TEM, when the section thickness approaches the diameter of the structures (e.g. for 60-nm COPI vesicles), a single section can be used for counting (the workup checks that the fraction of equatorial profiles generated from one section (red lines) that cannot be iden-tified as such in the next adjacent section). This approach is called a one-section disector. However, care must be exercised when using this approach with volume SEM methods. One problem occurs when SEM imaging comes from surface layer of a much thicker section, so that vesicles waists will be missed (e.g. Array-SEM or SBF-SEM). In this case increasing the imaging depth could solve this problem. Another possibility is that imaging and section thickness are very small compared to the vesicle size (e.g. with FIBSEM) so that the
same vesicle waist may appear in multiple sections (thereby decreas-ing the fraction of vesicle profiles that disappear in adjacent sec-tions). In this case it could be useful to assemble a projection image from a ministack of sections, which itself approximates in thickness to size of the vesicles in question. The numerical density of vesicles (or fenestrations for example) counted in disectors can be related to volume by performing point counting for the appropriate reference space found within the disector (not shown). A systematic lattice of points is applied to the sampling frame and the number hitting the reference space profile is recorded. The estimate of the volume of ref-erence space inside the disector is P × a × h, where P is the sum of points, a is the area associated with one point on the lattice and h
is the distance between the section planes used to make the disector. Numerical density is given by Q−/ P × a × h. c The mean volume of
a reference component or space (e.g. cell cytoplasm) estimated using a disector; (see a). Structures in the disector (ticks; Q−) and points
(P) over the component/space profiles are counted. Mean volume is given by: P × a × h/Q−. Again the second section is prepared
[image:8.595.112.478.65.470.2]low magnification) to estimate the reference space volume (such as the cytoplasm) per cell as illustrated in Fig. 4c.
More specialised estimators of Golgi complex composition and size
The composition of the Golgi membrane structures is of interest in studies of assembly/disassembly during the cell cycle, or in response to pharmacological agents or changes in gene expression (e.g. Klausner et al. 1992; Storrie et al. 2012). Stereology can be used to estimate the frac-tion of membrane in Golgi cisternae of different types (e.g.
cis/trans), or the fraction of membrane in say vesicles ver-sus cisternae. In this case, imaging windows from single randomly positioned and oriented slices/images are probed using test lines. The lines are applied to images as SUR arrays (Fig. 3b) or conveniently as a single scanning line directly on the camera image at the electron microscope (Lucocq 2003, 2008) for rapid results. Line intersects report on proportion of surface areas of relevant membranes in 3D (Griffiths et al. 1989; see; Baddeley and Jensen 2004). As mentioned above, cycloid test lines placed on images of vertical sections can also be employed for this purpose.
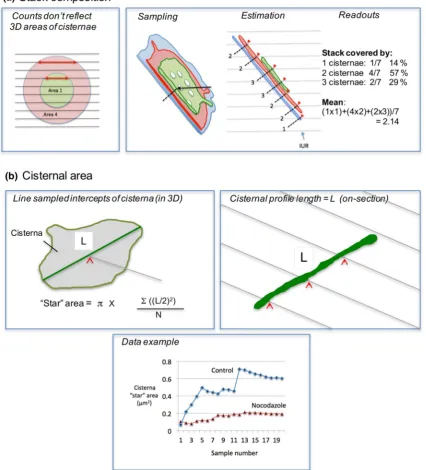
Stack composition can also be estimated by first sam-pling the Golgi ribbon surface (face) using line probes, and counting cisternal profiles orthogonal to the sampling point (Fig. 5a; Lovelock and Lucocq 1998). This type of analy-sis avoids the bias produced when simple relative counts of cisternal profiles are used (see Fig. 5a). This estimate requires random orientation of the orthogonals in 3D and is, therefore, not suited to the vertical section approach. In this case stack composition can be analysed by estimating the relative sizes of the cisternae using relative intersection counts on vertical sections.
Individual Golgi cisternae are complex structures that are extensively interconnected in the centrosomal region of the animal cell producing plate-like or ribbon-like struc-tures in 3D. While single slices/images cannot be used to estimate the extent of the cisterna/ribbon directly, a quan-tity known as “star area” is accessible. Star area estimates the “visible” area as “viewed” from a randomly selected location on a Golgi cisterna. Star area is estimated using intercepts across a planar surface (Gundersen et al. 1988) and the intercept is generated by the section as it passes across the cisterna in 3D (simply then the length of the cis-ternal profile on the section; Fig. 5b). Star area is sensitive to the connectedness of the Golgi ribbon and/or the extent of the cisterna/ribbon in 3D. Data presented in Fig. 5b are based on estimates of star area with the aim of following fragmentation of the Golgi after treatment with the micro-tubule depolymerizing drug nocodazole.
The arithmetic mean thickness of the Golgi stack can be computed from the mean of measurements across the
structure from random locations multiplied by π/4. An alternative is the harmonic mean thickness (Knust et al.
2009; Jensen et al. 1979), which is more resistant to effects of numerically large outliers [in this case these are gener-ated when cisternae become sectioned at oblique angles (Hirose et al. 1982)]. Average thickness of individual cis-ternae can also be estimated using the packing density of cisternal membranes. Here the cisterna is modelled as a flat plate in which thickness approximates to 2/Sv [from rear-rangement of Sv = 2× area/volume = 2 × (a/(t × a)] where a
is the area of one aspect of the cistern, t is the thickness and
v represents the cisternal volume as reference space (ignor-ing the rim membrane; not shown). Surface density estima-tion is described above.
Stereology on parallel section stacks for quicker estimates on individual Golgi
This parallel section stack approach has been studied exten-sively for estimating volume and densities in single biologi-cal items such as organisms, organs, cells and organelles (Cruz-Orive and Myking 1981; Gundersen and Jensen
1987). These studies suggest that volume and also compo-nent densities are estimated with reasonable precision using a systematic array of 5–10 parallel and equally spaced sec-tions. For unbiased results the parallel section stack is posi-tioned at random and spans the entire organelle/compart-ment of interest (Fig. 2).
A key point here is that while parallel section stacks are quite laborious to prepare manually by conventional means (see Lucocq et al. 1989), the newer volume-SEM meth-ods provide arrays of automated sections and/or images from which the parallel sections can be selected (Figs. 2,
6; Kizilyaprak et al. 2014; Peddie and Collinson 2014; Hughes et al. 2014). The section stack approach is suitable for SBF-SEM and array SEM imaging and also FIBSEM while in SBF-SEM/array SEM there is freedom to choose the orientation of imaging (random section approach). In FIBSEM the orientation is less flexible as most studies are performed orthogonal to the horizontal plane in the micro-scope/specimen, which restricts the use of some estimators (see below). It is worth noting, however, that orientation constraints of FIBSEM imaging can be overcome by virtual sectioning using in silico reconstructions, or by re-mount-ing or re-embeddre-mount-ing of samples prior to further imagre-mount-ing. However, these methods do require greater data storage and an increase in sample handling time, respectively.
above. In the case of volume-SEM, selecting a small subset of the exhaustive serial sections/images reduces overall workload and time for analysing individual cells by orders of magnitude, allowing multiple cells to be ana-lysed. As an example, for SBF-SEM, if a typical Golgi apparatus was sectioned over five microns using 200, 25-nm sections the 5 parallel sections in the stack used for stereology would comprise 2.5% of the total. In the case of FIBSEM there could be 1000, 5-nm sections, and the parallel stack sections would make up 0.5%—a substantial reduction in the need for data processing, retrieval and storage.
Volume
The volume of a cell or cell component can be estimated using section stacks using the principle based on the work of Bonaventura Cavalieri (Howard and Reed 2005; Fig. 6a–c). The volume could be an individual component (e.g. Golgi stack) or it could be a reference volume used to convert organelle surface, volume or number densities into absolute amounts (Weibel 1979; Howard and Reed
[image:10.595.86.513.66.537.2](an application of SUR sampling; Fig. 6c). The volume estimate is then obtained from the total area of structure profiles on the slices, multiplied by the distance between sections. The number of sections required for a precision of about 5% is usually between five and eight (Gundersen and Jensen 1987). Conveniently, Cavalieri estimates allow the orientation of the sections to be fixed arbitrarily, according to the constraints of good imaging or the physical attributes of the system. Thus, certain orientations of the Golgi may allow better recognition of stack structure or the investiga-tor might be forced to restrict the orientation to a vertical direction across a cell monolayer, as is possible with FIB-SEM imaging. Sections with arbitrary orientations can also be used for estimating number but may not be used for 3D surface estimations, which, instead, require randomly ori-ented or vertical sections to be prepared.
Membrane surface
Sections stacks can be used to estimate the membrane sur-face in Golgi compartments by employing line intersection methods similar to those described for single sections. The
surface density of Golgi cisternal membranes, tubules or vesicles is first estimated inside a chosen reference space (e.g. the cell; Fig. 6b, c). The total surface of membrane can then be computed directly from the product of surface density and reference volume (obtained using the Cavalieri estimator).
As with single section analysis (described above) inter-actions between the sample and test lines must be oriented randomly. One way is to enclose the sample in gelatine and rotate before sectioning and apply an SUR array of lines for surface density estimation. However, because the orientation of each section in the stack tends to be consist-ent, the results will be sensitive to any preferred orienta-tions (anisotropy) of the (Golgi) membranes in different cells. Although unbiased at the population level, this effect will increase inter-cell/Golgi variation and decrease preci-sion. An alternative approach is to generate isotropic lines in space by combined use of vertical sections and cycloid arrays (Figs. 3c, 6c; Baddeley et al. 1986). The vertical axis lies at right angles to an arbitrarily chosen horizontal plane such as the bottom surface of a cell culture dish. FIB-SEM is ideally suited to the application of the vertical sec-tion method because the plane of imaging is conveniently orthogonal to the base of the specimen (horizontal plane). Notice also that intersection counts using vertical sections can provide data on membrane composition although more specialised estimators for stack composition/cisternal size (Fig. 5) require randomly oriented sections.
Number
Section stacks are a powerful way of estimating the total number of particulate structures (e.g. Golgi vesicles). The key is to count particles using a disector, i.e. two parallel sections (images) at each position in the systematic section array. One of these two sections (or images) can belong to the parallel section stack and the other is imaged at a distance equivalent to one-third to one-quarter of particle height along the axis of sectioning (Sterio 1984; Gundersen
1986). The number of profiles that disappear from one sec-tion to the next provides an unbiased estimate of particle number in the sampled disector volume (Figs. 4, 6). Effi-ciency can be improved by counting in both directions in the section stack because each direction will ‘capture’ dif-ferent structures.
As described above for single slice analysis, a special case called the one section disector arises when the parti-cles being counted are similar in size to the sections used to investigate them (e.g. when Golgi vesicles of 60–70 nm are sectioned using conventional microtomes at 50–100 nm in TEM; Fig. 4; Lucocq et al. 1989). Here a disector formed from two adjacent sections is prepared and the number of disappearing profiles is counted (Fig. 6). If the majority of Fig. 5 Single sections: specialised estimators. a Composition.
Counts of cisternae in sections are a biased measure of relative 3D number (Lucocq and Hacker 2013). A randomly positioned stack of sections hits a larger (red) cisterna eight times and the smaller (green) cisterna four times reflecting the twofold greater height of the large cisterna. By contrast there is a fourfold difference between relative areas of the two cisternae in 3D. This is reported by relative profile length on the sections (red arrows mark the lengths of two sectioned profiles). The composition of the stack “ribbon” can be sensed using SUR test lines with random placement and isotropic uniform random (IUR) orientation. At each intercept the number of cisternae in the stack is counted in a direction orthogonal to the stack (dashed lines). Results are summed from multiple SUR images and provide estimates of proportions of the stack ribbon covered by 1,2,3, etc. cisternae.
b Cisternal “spread” or “star” area. Top left Principle: the IUR grey line identifies a randomly positioned intercept (red arrowhead) on the cisternal surface (grey fill). The randomly oriented intercept (green) passes through the sampled point. The length of the intercept is used to compute the area of the surface from the equation. Top right in a real sample (randomised in orientation during embedding), random locations on a cisterna (sectioned profile in green) are located (red arrowheads) using a systematic array of test lines (grey) applied to a section. The length of cisternal profile represents L and is estimated for each random sampling “hit” using the same test system of lines. In the example for each random hit there are three line hits on the green cisterna profile. Each of these hit totals report an estimated cisternal length of π/2 × I × d where I is the number of intersections (3) and
d is the real spacing of the test lines (the grid must be randomised in orientation and position relative to the cisternal profile). Notice that this estimator of intercept (cisternal profile) length works for curvi-linear profiles. Star area will reflect the degree of connectivity/extent of the cisternae in 3D. Bottom: star areas of Golgi cisternae in RK13 cells with and without fragmentation of the Golgi using the microtu-bule depolymerising agent nocodazole (sample number indicates the number of SUR images used for each cumulative estimate from this single illustrative experiment)
the vesicle profiles (say 95/100 of all counted vesicles) then disappear, the disector count approximates to the structure counts in a single section (see Fig. 4). Number is then esti-mated by multiplying by the number of sections found in the stack interval. As already discussed, in the case of SEM imaging, care must be taken to ensure the imaging depth in the sections is comparable to the physical section thickness used, otherwise vesicle waists will be lost leading to under-estimates of vesicle number (see Fig. 4b legend for details). A specific problem arises when data from individual cells are required and the cells of interest form part of a wider cell population that is distributed in 3D space.
Application of specialised estimators to parallel section stacks
As we have described above, a set of specialised estima-tors for cisterna and stack thickness, stack composition and cisternal area can be applied to randomly oriented SEM sections. These can also be applied to randomly oriented section stacks with the caveat that preferred orientation of Golgi membranes within individual cells may increase
the cell-to-cell variation of the estimates. In the restricted orientations provided by vertical sections (commonly pre-pared by FIBSEM), star area estimation is problematic while stack composition is better estimated on vertical sections with estimations of relative membrane surface of the different cisternae obtained using counts of cycloid arc intersections (see above).
Systematic errors
Objects of small size are subject to systematic errors (biases), especially when slice thickness approximates the size of target structures (e.g. with Golgi vesicles/tubules and conventional 50 nm sections). Errors are particularly evident when estimating volume or surface. One bias reduces estimates of vesicle volume and surface and stems from unclear images of the structure periphery—an effect that is also known as “lost caps”. A second bias increases estimates of volume and surface and stems from overpro-jection of structures inside the slice into the image (the Holmes effect; Weibel 1979). Model-based estimates of the bias for surface and volume densities of Golgi vesicles or tubules can not only be calculated (Weibel and Paumgartner
1979) but can also be measured directly using EM tomo-graphic sets that use much thinner sections (Vanhecke et al.
2007). Corrections for overprojection in Cavalieri estimates are also available (Howard and Reed 2005). Thankfully the imaging thickness in volume SEM is reduced because the signal comes from the surface (5 nm or less), making these errors less significant. For higher throughput analy-sis, systematic errors may be accepted if the size of small structures remains constant under different conditions. In such cases, the relative biases will be the same in different treatment groups and estimated quantities will retain their comparative worth (Mayhew and Lucocq 2015).
One important factor for any type of quantitative esti-mation in EM (including volume) is rigorous application of criteria for compartment or structure identification (in this case the Golgi). Thus, boundaries of interesting structural profiles must be reliably identifiable and map onto and delineate the 3D objects that generated them. In short, one cannot measure that which one cannot identify. For example, in EM sections/images, cisternae can be identified as membrane-bound profiles of specified size and asymmetry that are not coated by ribosomes (e.g. a thickness of 60 nm and a long axis that exceeds the short axis by threefold). A limited serial section analysis offers a convenient way to establish the reliability of the cho-sen criteria for identifying cisternal structures in 3D. For high throughput, errors in identification may increase the bias but this may be deemed acceptable if relative biases are similar in different study groups. Automated Fig. 6 Parallel section stacks (Golgi subpopulations/individual cells).
The cell(s) of interest is (are) identified (for example, using correla-tive light and electron microscopy (CLEM)) and prepared for SEM.
a and b A stack of 5–10 parallel images is recorded spanning the entire Golgi organelle. The stack is positioned at random and each section evenly spaced by a known interval/section number. In FIB-SEM the orientation of the sections is easily set as orthogonal to the horizontal plane of the cell culture dish (vertical section). c Estima-tions Volume of Golgi structures can be estimated using Cavalieri’s volume estimator V = Σ A × k, where A is the area of sectioned profiles summed over all section planes and k is the spacing of the images. Area A can be computed from P × a, where P is the sum of points (black crosses) hitting the profiles on all the stack images and
a, is the area associated with each point on the grid lattice (applied SUR). The estimator is unbiased if section planes used are infinitely thin with respect to the object of interest. Corrections may need to be applied when slice thickness is substantial compared with the spac-ing k (Howard and Reed 2005). When sections are vertical, the sur-face density of Golgi component membranes can be estimated using a cycloid arc test system applied along the vertical direction (SURS pattern; see text and Fig. 3). The total surface is obtained by multi-plying Sv by reference volume obtained using the Cavalieri estimator. Number can be estimated using at least two sections in close prox-imity or adjacent to each other in the stack (bottom left and right). Structures that produce profiles in one section, but not the next (√) have edges between the sections and, therefore, are counted (disec-tor principle; Sterio 1984; Gundersen 1986). The sections need to be spaced at 1/3 to 1/4 of the diameter of the structures counted to make structures easy to follow. For convex objects such as vesicles, count-ing is straightforward because each object has a scount-ingle edge (regard-less of its size). One of the sections can belong to the section stack used for volume or surface estimation. The total number of structures in the Golgi is estimated from the number of disappearing profiles multiplied by 1/(fraction of sections used for counting) (Gundersen
1986; Lucocq et al. 1989; Smythe et al. 1989). For example, if COPI vesicles are counted using ten pairs of adjacent 20-nm sections through a 5-µm Golgi and the distance between the pairs is 50 sec-tions then the estimate of COPI number is vesicle edge counts (Q−) × 50/2 (the denominator is 2 because counting can be done in both directions to improve efficiency). If there are 500–1000 COPI vesi-cles then 20–40 vesivesi-cles will be counted for each cell. If the section thickness approaches the size of the vesicles (as is the case of conven-tional 50 nm resin sections and 60–70 nm COPI vesicles) a majority of vesicle equators detected in the sampling section may be absent in the lookup section. Under these conditions a single section disector (Lucocq et al. 1989; Nyengaard and Gundersen 2006) is established and comparison with the lookup section is not necessary, speeding up the analysis. Care must be exercised when designing single section disectors for use with the surface imaging used in volume SEM (see Fig. 4b and text for details). Numerical density can be computed by combining disector counts with point counting or surface estimators. Another possible readout is to relate the number of one structure to another using the ratio of counts (Gundersen 1986)
identification or recognition is a potential growth area for high-throughput TEM (e.g. Kreshuk et al. 2014; Fordyce et al. 2014; Higaki et al. 2015). While most quantifica-tion is currently carried out using “manual” segmenta-tion, automated machine recognition/learning is improv-ing and some algorithms now exhibit performance that approximates the human brain-eye combination (not dis-cussed further here).
Another error of importance can occur at the micrograph edge. Golgi structure profiles situated here may have criti-cal features needed to identify them when they lie partly outside the boundary of the image. This effect can be avoided by surrounding the quadrat used for estimations by a guard area, which is big enough to identify all possible structures regardless of size and shape. We recommend the routine use of a guard area. In the case of section stacks, Fig. 7 Experimental design for stereological estimation on single
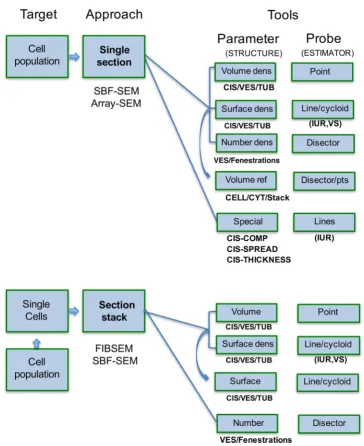
slices and parallel section series in volume-SEM. Two experimental pathways are outlined here, using either single sections for investigat-ing the parameters of Golgi populations, or randomly placed paral-lel section stacks for analysis of subpopulations/individual Golgi. The single section approach is more suited to SBF-SEM and array-SEM, because they produce larger section areas than FIBSEM. Here the pri-mary accessible parameters are densities, which may be converted to amounts using estimates of the reference volume (curved arrow). In
the case of parallel section stacks, absolute volume and number are directly accessible but surface must be determined as a density first before combining with the volume estimate to derive membrane sur-face (curved arrow). In either approach volume and number can be determined on sections that are arbitrary, randomly oriented or verti-cally oriented. Surface density and specialised estimators require iso-tropic uniform random (IUR) sections or vertical sections (VS; details are given in the text). CIS cisternae, TUB tubules, VES vesicles, CYT
[image:14.595.114.479.49.496.2]when the whole Golgi is of interest and has its own natural boundaries a guard area is not required.
Final comments
The strength of newer volume-SEM technologies resides in their ability to produce large amounts of serial sec-tions and/or serial images. But the challenge is to process the information in a way that connects with the 3D real-ity of organelles (such as the Golgi) at both specimen and population levels, without engaging in massive amounts of work. A potential weakness of volume-SEM occurs when the investigator is drawn into analyzing large amounts of 3D information at a restricted number of cell locations. This not only takes time and produces digital waste but also requires substantial in silico storage. Sampling-based stere-ology offers an opportunity of sensing the Golgi population more widely than with exhaustive sectioning but retains enough information about the individual items and their parent population to provide estimates with satisfactory levels of precision. This is particularly important when EM is used for screening purposes, as in CLEM. With judicious selection of target parameters (volume, surface or number) combined with careful study design the “threat” of large data sets can then be averted, leading to efficient and accu-rate sensing of the “real” Golgi in 3D space (see Fig. 7).
Acknowledgements We are grateful to Christian Hacker who pre-pared the rabbit kidney cells for electron microscopy. John Lucocq was supported by a Programme grant from the Wellcome Trust (Num-ber 045404). Sophie Ferguson was a recipient of a 600th anniversary studentship from the University of St Andrews.
Open Access This article is distributed under the terms of the Creative Commons Attribution 4.0 International License (http:// creativecommons.org/licenses/by/4.0/), which permits unrestricted use, distribution, and reproduction in any medium, provided you give appropriate credit to the original author(s) and the source, provide a link to the Creative Commons license, and indicate if changes were made.
References
Amos WB, Grimstone AV (1968) Intercisternal material in the Golgi body of Trichomonas. J Cell Biol 38:466–471
Baddeley A, Jensen EBV (2004) Stereology for statisticians, Chap. 1, Chapman and Hall/CRC press, Boca Raton p 23
Baddeley AJ, Gundersen HJ, Cruz-Orive L (1986) Estimation of sur-face area from vertical sections. J Microsc 142:259–276 Ballerini M, Milani M, Costato M, Squadrini F, Turcu IC (1997) Life
science applications of focused ion beams (FIB). Eur J Histo-chem 41(Suppl 2):89–90
Bannykh SI, Rowe T, Balch WE (1996) The organization of endoplas-mic reticulum export complexes. J Cell Biol 135:19–35
Barlowe C (2002) COPII-dependent transport from the endoplasmic reticulum. Curr Opin Cell Biol 14:417–422
Berger EG, Roth JPDD (1997) The Golgi apparatus. Birkhäuser, Boston
Beznoussenko GV, Parashuraman S, Rizzo R et al (2014) Transport of soluble proteins through the Golgi occurs by diffusion via conti-nuities across cisternae. Elife 27:3
Bosch C, Martínez A, Masachs N et al (2015) FIB/SEM technology and high-throughput 3D reconstruction of dendritic spines and synapses in GFP-labeled adult-generated neurons. Front Neuro-anat 9:1–18
Braendgaard H, Gundersen HJ (1986) The impact of recent stereo-logical advances on quantitative studies of the nervous system. J Neurosci Meth 18:39–78
Brüel A, Nyengaard JR (2005) Design-based stereological estimation of the total number of cardiac myocytes in histological sections. Basic Res Cardiol 100:311–309
Cochran WG (1977) Sampling techniques. 3rd edn. Wiley, New York, p 167
Colanzi A, Hidalgo Carcedo C, Persico A et al (2007) The Golgi mitotic checkpoint is controlled by BARS-dependent fis-sion of the Golgi ribbon into separate stacks in G2. EMBO J 26:2465–2476
Cruz-Orive LM, Myking AO (1981) Stereological estimation of vol-ume ratios by systematic sections. J Microsc 122:143–157 Day KJ, Staehelin LA, Glick BS (2013) A three-stage model of Golgi
structure and function. Histochem Cell Biol 140:239–249 Denk W, Horstmann H (2004) Serial block-face scanning electron
microscopy to reconstruct three-dimensional tissue nanostruc-ture. PLoS Biol 2:e329
Domart MC, Hobday TM, Peddie CJ, Chung GH, Wang A, Yeh K, Jethwa N, Zhang Q, Wakelam MJ, Woscholski R, Byrne RD, Collinson LM, Poccia DL, Larijani B (2012) Acute manipula-tion of diacylglycerol reveals roles in nuclear envelope assembly and endoplasmic reticulum morphology. PLoS One 7:e51150 Donohoe BS, Mogelsvang S, Staehelin LA (2006) Electron
tomog-raphy of ER, Golgi and related membrane systems. Methods 39:154–162
Durisic N, Cuervo LL, Lakadamyali M (2014) Quantitative super-resolution microscopy: pitfalls and strategies for image analysis. Curr Opin Chem Biol 20:22–28
Elias H, Hyde DM (1980) An elementary introduction to stereology (quantitative microscopy). Am J Anat 159:412–446
Faini M, Prinz S, Beck R et al (2012) The structures of COPI-coated vesicles reveal alternate coatomer conformations and interac-tions. Science 336:1451–1454
Faini M, Beck R, Wieland FT, Briggs JA (2013) Vesicle coats: struc-ture, function, and general principles of assembly. Trends Cell Biol 23:279–288
Farquhar MG, Hauri HP (1997) Protein sorting and vesicular traffic in the Golgi apparatus. In: Berger EG, Roth JP (ed) The Golgi apparatus. Birkhäuser, Boston, pp 63–129
Farquhar MG, Palade GE (1981) The Golgi apparatus (complex) - (1954–1981) – from artifact to center stage. J Cell Biol 91:77s–103s
Farquhar MG, Palade GE (1998) The Golgi apparatus: 100 years of progress and controversy. Trends Cell Biol 8:2–10
Flottmann B, Gunkel M, Lisauskas T et al (2013) Correlative light microscopy for high content screening. Biotechniques 55:243–252
Fordyce N, McKenna S, Hacker C, Lucocq JM (2014) Finding Golgi stacks in electron micrographrs. In: Proceeding Medical Image Understanding and Analysis. pp 59–64
Glick BS, Luini A (2011) Models for Golgi traffic: a critical assess-ment. Cold Spring Harb Perspect Biol 3:a005215
Griffiths G, Warren G, Quinn P, Mathieu-Costello O, Hoppeler H (1984) Density of newly synthesized plasma membrane proteins in intracellular membranes. I. Stereological studies. J Cell Biol 98:2133–2141
Griffiths G, Fuller SD, Back R, Hollinshead M, Pfeiffer S, Simons K (1989) The dynamic nature of the Golgi complex. J Cell Biol 108:277–297
Gundersen HJ (1986) Stereology of arbitrary particles. A review of unbiased number and size estimators and the presentation of some new ones, in memory of William R. Thompson. J Microsc 143:3–45
Gundersen HJ, Jensen EB (1987) The efficiency of systematic sam-pling in stereology and its prediction. J Microsc 147:229–263 Gundersen HJ, Bagger P, Bendtsen TF et al (1988) The new
stereo-logical tools: disector, fractionator, nucleator and point sampled intercepts and their use in pathological research and diagnosis. APMIS 96:857–881
Hayworth KJ, Morgan JL, Schalek R, Berger DR, Hildebrand DG, Lichtman JW (2014) Imaging ATUM ultrathin section libraries with WaferMapper: a multi-scale approach to EM reconstruc-tion of neural circuits. Front Neural Circuits 8:68
Higaki T, Kutsuna N, Akita K, Sato M, Sawaki F, Kobayashi M, Nagata N, Toyooka K, Hasezawa S (2015) Semi-automatic organelle detection on transmission electron microscopic images. Sci Rep 5:7794
Hirose K, Osterby R, Nozawa M, Gundersen HJ (1982) Development of glomerular lesions in experimental long-term diabetes in the rat. Kidney Int 21(689):695
Howard CV, Reed MG (2005) Unbiased stereology: three-dimen-sional measurement in microscopy. 2nd edn. Garland Science/ BIOS Scientific Publishers, Abingdon
Hughes L, Hawes C, Monteith S, Vaughan S (2014) Serial block face scanning electron microscopy–the future of cell ultrastructure imaging. Protoplasma 251:395–401
Hughes L, Borrett S, Towers K, Starborg T, Vaughan S (2017) Pat-terns of organelle ontogeny through a cell cycle revealed by whole cell reconstructions using 3D electron microscopy. J Cell Sci
Jackson LP (2014) Structure and mechanism of COPI vesicle biogen-esis. Curr Opin Cell Biol 29:67–73
Jensen EB, Gundersen HJ, Østerby R (1979) Determination of mem-brane thickness distribution from orthogonal intercepts. J Microsc 115:19–33
Kasthuri N, Hayworth KJ, Berger R et al (2015) Saturated reconstruc-tion of a volume of neocortex. Cell 162:648–661
Kizilyaprak C, Bittermann AG, Daraspe J, Humbel BM (2014) FIB-SEM tomography in biology. Methods Mol Biol 1117:541–558 Klausner RD, Donaldson JG, Lippincott-Schwartz J (1992) Brefeldin
A: insights into the control of membrane traffic and organelle structure. J Cell Biol 116:1071–1080
Knott G, Rosset S, Cantoni M (2011) Focussed ion beam milling and scanning electron microscopy of brain tissue. J Vis Exp 53:e2588
Knust J, Ochs M, Gundersen HJ, Nyengaard JR (2009) Stereological estimates of alveolar number and size and capillary length and surface area in mice lungs. Anat Rec 292:113–122
Koga D, Kusumi S, Ushiki T (2016) Three-dimensional shape of the Golgi apparatus in different cell types: serial section scan-ning electron microscopy of the osmium-impregnated Golgi apparatus. Microscopy (Oxf) 65:145–157
Kreshuk A, Koethe U, Pax E, Bock DD, Hamprecht FA (2014) Automated detection of synapses in serial section transmis-sion electron microscopy image stacks. PLoS One 9:e87351
Kuwajima M, Spacek J, Harris KM (2013) Beyond counts and shapes: Studying pathology of dendritic spines in the context of the surrounding neuropil through serial section electron microscopy. Neuroscience 251:75–89
Lavieu G, Zheng H, Rothman JE (2013) Stapled Golgi cister-nae remain in place as cargo passes through the stack. Elife 2:e00558
Lavieu G, Dunlop MH, Lerich A, Zheng H, Bottanelli F, Rothman JE (2014) The Golgi ribbon structure facilitates anterograde transport of large cargoes. Mol Biol Cell 25:3028–3036 Leighton SB (1981) SEM images of block faces, cut by a miniature
microtome within the SEM—a technical note. Scan Electron Microsc Pt 2:73–76
Lippincott-Schwartz J, Liu W (2006) Insights into COPI coat assembly and function in living cells. Trends Cell Biol 16:e1–e4
Lovelock C, Lucocq J (1998) Quantitative immunoelectron micros-copy reveals alpha 2, 6 sialyltransferase is concentrated in the central cisternae of rat hepatocyte Golgi apparatus. Eur J Cell Biol 76:18–24
Lucocq J (1993) Unbiased 3-D quantitation of ultrastructure in cell biology. Trends Cell Biol 3:354–358
Lucocq JM (2003) Electron microscopy in cell biology. In: Davey J, Lord M (eds.) Essential cell biology: a practical approach. pp. 53–112 (Chap. 3)
Lucocq J (2008) Quantification of structures and gold labeling in transmission electron microscopy. Methods Cell Biol 88:59–82 Lucocq J (2012) Can data provenance go the full monty? Trends Cell
Biol 22:229–230
Lucocq JM, Hacker C (2013) Cutting a fine figure: on the use of thin sections in electron microscopy to quantify autophagy. Autophagy 9:1443–1448
Lucocq JM, Warren G (1987) Fragmentation and partitioning of the Golgi apparatus during mitosis in HeLa cells. EMBO J 6:3239–3246
Lucocq JM, Berger EG, Warren G (1989) Mitotic Golgi fragments in HeLa cells and their role in the reassembly pathway. J Cell Biol 109:463–474
Lucocq J, Berger E, Hug C (1995) The pathway of Golgi cluster for-mation in okadaic acid-treated cells. J Struct Biol 115:318–330 Lucocq JM, Mayhew TM, Schwab Y, Steyer AM, Hacker C (2015)
Systems biology in 3D space—enter the morphome. Trends Cell Biol 25:59–64
Marsh BJ, Pavelka M (2013) Viewing Golgi structure and function from a different perspective–insights from electron tomography. Methods Cell Biol 118:259–279
Marsh BJ, Mastronarde DN, Buttle KF, Howell KE, McIntosh JR (2001) Organellar relationships in the Golgi region of the pan-creatic β cell line, HIT-T15, visualized by high resolution elec-tron tomography. Proc Natl Acad Sci 98:2399–2406
Marsh BJ, Volkmann N, McIntosh JR, Howell KE (2004) Direct continuities between cisternae at different levels of the Golgi complex in glucose-stimulated mouse islet beta cells. Proc Natl Acad Sci USA 101:5565–5570
Martínez-Alonso E, Tomás M, Martínez-Menárguez JA (2013) Golgi tubules: their structure, formation and role in intra-Golgi trans-port. Histochem Cell Biol 140:327–339
Mayhew TM (2008) Taking tissue samples from the placenta: an illustration of principles and strategies. Placenta 29:1–14 Mayhew TM, Lucocq JM (2015) From gross anatomy to the
nano-morphome: stereological tools provide a paradigm for advanc-ing research in quantitative morphomics. J Anat 226:309–321 Micheva KD, Smith SJ (2007) Array tomography: a new tool for
Mogelsvang S, Gomez-Ospina N, Soderholm J, Glick BS, Staehelin LA (2003) Tomographic evidence for continuous turnover of Golgi cisternae in Pichia pastoris. Mol Biol Cell 14:2277–2291 Mourik MJ, Faas FG, Zimmermann H, Voorberg J, Koster AJ,
Eiken-boom J (2015) Content delivery to newly forming Weibel–Pal-ade bodies is facilitated by multiple connections with the Golgi apparatus. Blood 125:3509–3516
Narayan K, Subramaniam S. (2015) Focused ion beams in biology. Nat Meth 12:1021–1031
Nyengaard JR, Gundersen HJG (1992) The isector: a simple and direct method for generating isotropic, uniform random sections from small specimens. J Microsc 165:427–431
Nyengaard JR, Gundersen HJ (2006) Direct and efficient stereological estimation of total cell quantities using electron microscopy. J Microsc 222:182–187
Oke BO, Suarez-Quian CA (1992) Partitioning of the Golgi appara-tus in rat primary and secondary spermatocytes during meiosis. Anat Rec 233:245–256
Papanikou E, Glick BS (2014) Golgi compartmentation and identity. Curr Opin Cell Biol 29:74–81
Peddie CJ, Collinson LM (2014) Exploring the third dimension: vol-ume electron microscopy comes of age. Micron 61:9–19 Pellett PA, Dietrich F, Bewersdorf J, Rothman JE, Lavieu G (2013)
Inter-Golgi transport mediated by COPI-containing vesicles carrying small cargoes. Elife 2:e01296
Pepperkok R, Whitney JA, Gomez M, Kreis TE (2000) COPI vesicles accumulating in the presence of a GTP restricted arf1 mutant are depleted of anterograde and retrograde cargo. J Cell Sci 113:135–144
Robinson DG (1980) Dictyosome-endoplasmic reticulum associations in higher plant cells? A serial-section analysis. Eur J Cell Biol 23:22–36
Russell MR, Lerner TR, Burden JJ, Nkwe DO, Pelchen-Matthews A, Domart MC, Durgan J, Weston A, Jones ML, Peddie CJ, Car-zaniga R, Florey O, Marsh M, Gutierrez MG, Collinson LM (2017) 3D correlative light and electron microscopy of cultured cells using serial blockface scanning electron microscopy. J Cell Sci 130:278–291
Seguí-Simarro JM, Staehelin LA (2006) Cell cycle-dependent changes in Golgi stacks, vacuoles, clathrin-coated vesicles and multivesicular bodies in meristematic cells of Arabidopsis thali-ana: a quantitative and spatial analysis. Planta 223:223–236 Shomorony A, Pfeifer CR, Aronova M et al (2015) Combining
quan-titative 2D and 3D image analysis in the serial block face SEM: application to secretory organelles of pancreatic islet cells. J Micros 259:155–164
Simpson JC, Joggerst B, Laketa V et al (2012) Genome-wide RNAi screening identifies human proteins with a regulatory function in the early secretory pathway. Nat Cell Biol 14:764–774 Smythe E, Pypaert M, Lucocq J, Warren G (1989) Formation of
coated vesicles from coated pits in broken A431 cells. J Cell Biol 108:843–853
Sterio DC (1984) The unbiased estimation of number and sizes of arbitrary particles using the disector. J Microsc 134:127–136 Storrie B, Micaroni M, Morgan GP (2012) Electron tomography
reveals Rab6 is essential to the trafficking of trans-Golgi clath-rin and COPI-coated vesicles and the maintenance of Golgi cis-ternal number. Traffic 13:727–744
Tang D, Wang Y (2013) Cell cycle regulation of Golgi membrane dynamics. Trends Cell Biol 23:296–304
Titze B, Genoud C (2016) Volume scanning electron microscopy for imaging biological ultrastructure. Biol Cell 108:307–323 Trucco A, Polishchuk RS, Martella O et al (2004) Secretory traffic
triggers the formation of tubular continuities across Golgi sub-compartments. Nat Cell Biol 6:1071–1081
Tsai WT, Hassan A, Sarkar P, Correa J, Metlagel Z, Jorgens DM, Auer M (2014) From voxels to knowledge: a practical guide to the segmentation of complex electron microscopy 3D-data. J Vis Exp 90:e51673
Vanhecke D, Studer D, Ochs M (2007) Stereology meets electron tomography: towards quantitative 3D electron microscopy. J Struct Biol 159:443–450
Verissimo F, Pepperkok R (2013) Imaging ER-to-Golgi transport: towards a systems view. J Cell Sci 126:5091–5100
Wacker I, Spomer W, Hofmann A, Thaler M, Hillmer S, Gengenbach U, Schröder RR (2016) Hierarchical imaging: a new concept for targeted imaging of large volumes from cells to tissues. BMC Cell Biol 17:38
Walther P, Schmid E, Höhn K (2013) High-pressure freezing for scanning transmission electron tomography analysis of cellular organelles. Methods Mol Biol 31:525–535
Wanner G, Schäfer T, Lütz-Meindl U (2013) 3-D analysis of dicty-osomes and multivesicular bodies in the green alga Micras-terias denticulata by FIB/SEM tomography. J Struct Biol 184:203–211
Wei D, Jacobs S, Modla S, Zhang S, Young CL, Cirino R, Caplan J, Czymmek (2012) High resolution three-dimensional recon-struction of a whole yeast cell using focused-ion beam scanning electron microscopy. Biotechniques 53:41–48
Weibel ER (1979) Stereological methods. vol. I: practical methods for BiologicalMorphometry. Academic Press, London-New York-Toronto
Weibel ER, Paumgartner D (1978) Integrated stereological and bio-chemical studies on hepatocytic membranes. II. Correction of section thickness effect on volume and surface density esti-mates. J Cell Biol 77:584–597