UNIVERSITY OF CANTERBURY
3D Multi-user Interactive Visualization
with A Shared Large-scale Display
A thesis submitted in partial fulfillment of the requirements
for the Degree of Doctor of Philosophy
in the University of Canterbury
By
Hyungon Kim
Supervision Committee
Professor Christoph Bartneck Senior Supervisor Professor Mark Billinghurst Co-supervisor
Dr. Gun Lee Co-supervisor
Human Interface Technology Laboratory New Zealand
College of Engineering
Abstract
When the multiple users interact with a virtual environment on a large-scale display there are several issues that need to be addressed to facilitate the interaction. In the thesis, three main topics for collaborative visualization are discussed; display setup, interactive visualization, and visual fatigue. The problems that the author is trying to address in this thesis are how multiple users can interact with a shared large-scale display depending on the display setups and how they can interact with the shared visualization in a way that doesn’t lead to visual fatigue.
The first user study (Chapter 3) explores the display setups for multi-user interaction with a shared large-display. The author describes the design of the three main display setups (a shared view, a split screen, and a split screen with navigation information) and a demonstration using these setups. The user study found that the split screen and the split screen with navigation information can improve users’ confidence and reduce frustration level and are more preferred than a shared view. However, a shared view can still provide effective interaction and collaboration and the display setups cannot have a large impact on usability and workload.
ii
developed and were evaluated in the second user study. The Object Shift Technique translates the virtual objects in the opposite direction of movement of the Point of View (PoV) and the Activity-based Weighted Mean Tracking method assigns the higher weight to active users in comparison with stationary users to determine the location of the PoV. The results of the user study showed that these techniques can support collaboration, improve interactivity, and provide similar visual discomfort compared to the conventional method.
The third study (Chapter 5) describes how to reduce visual fatigue for 3D stereoscopic visualization with a single point of view (PoV). When multiple users interact with 3D stereoscopic VR using multi-user interactive visualization techniques and they are close to the virtual objects, they can perceive 3D visual fatigue from the large disparity. To reduce the 3D visual fatigue, an Adaptive Interpupillary Distance (Adaptive IPD) adjustment technique was developed. To evaluate the Adaptive IPD method, the author compared to traditional 3D stereoscopic and the monoscopic visualization techniques. Through the user experiments, the author was able to confirm that the proposed method can reduce visual discomfort, yet maintain compelling depth perception as the result provided the most preferable 3D stereoscopic visualization experience.
For these studies, the author developed a software framework and designed a set of experiments (Chapter 6). The framework architecture that contains the three main ideas are described. A demonstration application for multi-dimensional decision making was developed using the framework.
iii
Deputy Vice-Chancellor’s Office
Postgraduate Office
Co-Authorship Form
This form is to accompany the submission of any thesis that contains research reported in co-authored work that has been published, accepted for publication, or submitted for publication. A copy of this form should be included for each co-authored work that is included in the thesis. Completed forms should be included at the front (after the thesis abstract) of each copy of the thesis submitted for examination and library deposit.
Please indicate the chapter/section/pages of this thesis that are extracted from co-authored work and provide details of the publication or submission from the extract comes:
Chapter 4 / Page 85-112
1. Kim, H., Kim, Y., Lee, G., Billinghurst, M., & Christoph, B. (04/30/2017 submitted). Improving multi-user interactive visualization with a shared-large scale display. Computers & Graphics.
Chapter 5 / Page 109-125
1. Kim, H., Lee, G., & Billinghurst, M. (2015, March). Adaptive Interpupillary Distance Adjustment for Stereoscopic 3D
Visualization. In Proceedings of the 14th Annual ACM SIGCHI_NZ conference on Computer-Human Interaction (p. 2). ACM.
Please detail the nature and extent (%) of contribution by the candidate:
iv
Publication (2): 80% - Developed the system, conducted the study, and lead the writing of the paper.
Certification by Co-authors:
If there is more than one co-author then a single co-author can sign on behalf of all
The undersigned certifies that:
The above statement correctly reflects the nature and extent of the PhD candidate’s contribution to this co-authored work
In cases where the candidate was the lead author of the co-authored work he or she wrote the text
v
Publications from this dissertation
Material from this dissertation has been previously published or submitted in the peer-reviewed papers, posters, and extended abstracts listed below. The chapters of this thesis that relate to each publication are noted.
1. Kim, H., Lee, G., & Billinghurst, M. (2015, March). Adaptive Interpupillary Distance Adjustment for Stereoscopic 3D Visualization. In Proceedings of the 14th Annual ACM SIGCHI_NZ conference on Computer-Human Interaction (p. 2). ACM. Described in the Chapter 5.
2. Kim, H., Kim, Y., Lee, G., Billinghurst, M., & Christoph, B. (04/30/2017 submitted). Improving multi-user interactive visualization with a shared-large scale display. Computers & Graphics, Described in the Chapter 4.
During my doctoral studies, the following papers were also published, but are not a part of this thesis.
1. Kim, H., Lee, G., & Billinghurst, M. (2015, December). A Non-linear Mapping Technique for Bare-hand Interaction in Large Virtual Environments. In Proceedings of the Annual Meeting of the Australian Special Interest Group for Computer Human Interaction (pp. 53-61). ACM.
2. Piumsomboon, T., Altimira, D., Kim, H., Clark, A., Lee, G., & Billinghurst, M. (2014, September). Grasp-Shell vs gesture-speech: A comparison of direct and indirect natural interaction techniques in augmented reality. In Mixed and Augmented Reality (ISMAR), 2014 IEEE International Symposium on (pp. 73-82). IEEE.
Acknowledgments
I really appreciate to the following people for their support throughout my research. Without them, this thesis would not be possible.
Firstly, I would like to express my deepest gratitude to all my supervisors. Great thanks to Professor Mark Billinghurst, Christoph Bartneck and Gun Lee. There were many difficulties and problems during my Ph.D. and, I could not make the results without their help.
Also, thanks to Oliver, who gave me an opportunity of Ph.D. in New Zealand. I appreciate to Scion and LivingPlanIT which provided great support to finish the research.
My lovely wife, Namsun Yu. There are no words to describe my appreciation for her support and sacrifice throughout my Ph.D. Thank you.
Thanks to my friends, Alaeddin, David, Huidong and Thammathip, colleagues and staffs in the HITLab NZ who have provided me with their friendship and support.
Contents
Abstract ... i
Acknowledgments ... vi
Contents ... vii
List of Figures ... xii
List of Tables ... xix
Abbreviations ... xx
Introduction ... 21
1.1 Background ... 21
1.2 Problem statement ... 25
1.3 Research Aim ... 31
1.4 Research Approach ... 32
1.5 Experimental System ... 34
1.6 Research Contributions ... 35
1.7 Thesis Structure ... 37
Related Work ... 39
2.1 Display Setups for Multiple Users ... 39
2.1.1 Single Display Groupware and Multi-Display Groupware ... 39
2.1.2 Co-located Collaboration Display Interfaces ... 41
2.1.3 Research on other relevant topics. ... 44
viii
2.3 3D Visual Fatigue ... 53
2.3.1 Visual discomfort ... 53
2.3.2 Inappropriate disparity ... 56
2.4 Chapter Summary ... 59
Display Setups for Multiple Users ... 62
3.1 Display setup ... 63
3.1.1 Shared View ... 63
3.1.2 Split Screen ... 63
3.1.3 Split Screen with Navigation information ... 64
3.2 Experiment ... 64
3.2.1 Experimental Conditions ... 67
3.2.2 Experimental Procedure ... 68
3.3 Experimental Measures ... 71
3.4 Results ... 73
3.4.1 Task Completion Time Per Task ... 73
3.4.2 Touch distance... 74
3.4.3 System Usability Scale ... 75
3.4.4 NASA-TLX ... 76
3.4.5 Questionnaires ... 78
3.4.6 User Preference ... 81
3.5 Discussion ... 81
3.6 Insights for Display Setups ... 84
ix
Interactive Visualization for Multiple Users. ... 87
4.1 Methods to Support Multiple Viewers ... 88
4.1.1 Two Users vs. More Than Three Users ... 88
4.1.2 Object Shift Technique ... 89
4.1.3 Activity-based Weighted Mean Tracking Method ... 91
4.2 Implementation ... 92
4.2.1 Object Shift Technique ... 92
4.2.2 Activity-based Weighted Mean Tracking Method ... 93
4.2.3 Combination of the Object Shift Technique and the Activity-based Weighted Mean Tracking Method ... 95
4.3 Experiment ... 97
4.3.1 Experimental Condition ... 97
4.3.2 Experimental Setup and Procedure ... 98
4.3.3 Measurement ... 103
4.4 Result ... 104
4.4.1 Task Completion Time ... 104
4.4.2 Total Travel Distance ... 105
4.4.3 System Usability Scale ... 106
4.4.4 Dependency ... 107
4.4.5 Correct Answer Rate, Fatigue & Depth ... 108
4.4.6 Preference ... 110
4.4.7 Qualitative Feedback ... 110
x
4.6 Conclusion ... 114
Reducing 3D Visual Fatigue ... 115
5.1 Interpupillary Distance in 3D stereoscopy ... 116
5.1.1 Fixed Interpupillary Distance ... 118
5.1.2 Adaptive Interpupillary Distance Adjustment ... 120
5.2 Experiment ... 121
5.2.1 Experimental Environment ... 121
5.2.2 Experiment І ... 123
5.2.3 Result of Experiment I ... 124
5.2.4 Experiment II ... 124
5.2.5 Result of Experiment II ... 126
5.3 Discussion ... 128
5.4 Conclusion ... 131
A Framework for 3D Multi-user Interactive Visualization and Its Application to Multi-dimensional Decision-Making VR System ... 132
6.1 Overview of Framework Architecture. ... 135
6.2 Framework Components ... 137
6.2.1 Configuration Component ... 138
6.2.2 Graphic Component ... 139
6.2.3 Device Component ... 140
6.2.4 Rendering Component ... 142
xi
6.3.1 Multi-dimensional Decision Making ... 143
6.3.2 Implementation ... 147
6.3.3 Performance ... 154
6.4 Discussion ... 155
6.4.1 Summary of the framework ... 155
6.4.2 Lessons learned from the design and the development . 155 6.4.3 Limitation of the framework. ... 156
6.4.4 Limitation of the prototype VR system ... 157
6.5 Conclusions ... 158
Discussion ... 159
7.1 Display Setups with a Shared Large-scale Display for Multiple Users ... 159
7.2 Interactive visualization for multiple users ... 161
7.3 Reducing 3D Visual Fatigue ... 163
7.4 The Development of a Framework and its Prototype VR system. ... 164
7.5 Limitations of The Thesis ... 165
Conclusion... 168
8.1 Summary of the thesis... 169
8.2 Future work ... 171
References ... 174
List of Figures
Figure 1.1.1. A large-scale wall display(left) and multiple HMD hardware setup (right) (Cordeil 2017). ... 23
Figure 1.1.2. Augmented a real body into virtual space. (Bruder 2009) ... 23
Figure 1.2.1 Examples of collaborative visualization categorized by space-time matrix (Baecker 1993; Dix 1998) ... 27
Figure 1.4.1 Top down view of the experiment setup. ... 35
Figure 2.1.1 An example of Single Display Groupware (left) and Multi-Display Groupware (right) (Wallace 2009) ... 40
Figure 2.1.2 Fluid simulation on the responsive workbench (Wesche 1999) ... 41
Figure 2.1.3. Circular table interface (left) and radial tree representation (right) (Vernier 2002) ... 42
Figure 2.1.4. Independent display (left), shared display (center), and True groupware display (right) on the table-top interface (Tse 2007)... 42
Figure 2.1.5 Permulin hardware setup (left) and system concept (right) (Lissermann 2014) ... 43
xiii
Figure 2.1.7. MDG configuration(left) and SDG configuration (right) (Wallace 2009) ... 46
Figure 2.1.8. Single display with a shared controller (left), two displays with two controllers (center), and multi-view display with two controllers(right). (McGill 2015) ... 47
Figure 2.2.1. Multi-user interaction with visual filtering. Left and right users share the same information but have different views. (Agrawala 1997) ... 48
Figure 2.2.2. Time-sequential 3D system for one user. (Suzuki 2009) ... 48
Figure 2.2.3. Physical separation for multiple users. Each user has his/her own physical screen but they share the visualization (Arthur 1998)... 49
Figure 2.2.4. Breaks in the images due to screen edges (left) and no breaks with a per-pixel-column technique. (Simon 2004) ... 50
Figure 2.2.5. Hardware setup for AVIE (left) and an example application of the system (right) (McGinity 2007) ... 50
Figure 2.2.6. Image blending technique(left) and view clustering technique(right). (Marbach 2009) ... 51
Figure 2.2.7. Two users looking in a different direction (left) and the same direction (right). When they look in the same direction (right), the final PoV is calculated by the average of the users’ location. (Schulze 2012) ... 51
xiv
tracking; MSST, manually switched single tracking; CUT, closer-user tracking; MT, mean tracking; WMT, weighted mean tracking. (Tripicchio 2014) ... 52
Figure 2.3.1. Crosstalk (ghosting, left) and normal scene (right). ... 54
Figure 2.3.2. Without depth of field (left) and with depth of field (right). ... 55
Figure 2.3.3. An example of adaptive disparity mapping (Shibuhisa 2012). ... 56
Figure 2.3.4. The concept of scalable 3D image conversion (Kishi 2008). ... 57
Figure 2.3.5. Nonlinear disparity remapping. The original image (left) and nonlinearly remapped image. (Lang 2010) ... 57
Figure 2.3.6. An illustration of the view synthesis procedure. (a) forward mapping, (b) directional interpolation of disparity map along epipolar line (Park 2004). ... 58
Figure 2.3.7. Comparison between two different camera separation for a handheld device. (Mangiate 2012) ... 59
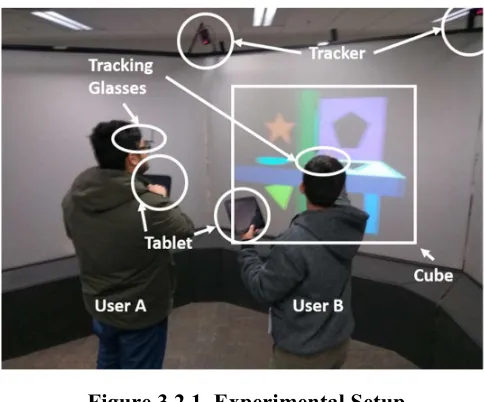
Figure 3.2.1. Experimental Setup. ... 65
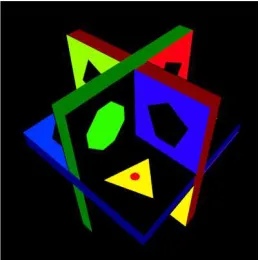
Figure 3.2.2. An example of a 3D object for the experiment. ... 66
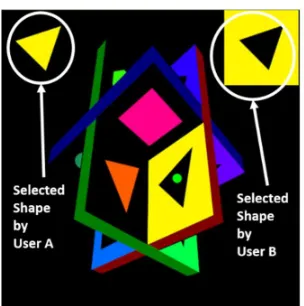
Figure 3.2.3. Red triangle shape (left) and black triangle shape with red background (right). ... 67
xv
Figure 3.2.5. The detailed procedure of a single task. ... 70
Figure 3.2.6. An example of the completed task with a shared view condition ... 71
Figure 3.4.1 Average task completion time per task. ... 74
Figure 3.4.2. Average touch distance for all conditions. .. 75
Figure 3.4.3 Average System User Scale Score for all conditions... 76
Figure 3.4.4. The results of the NASA-TLX subscales. .. 77
Figure 3.4.5 Average overall NASA-TLX scores. ... 78
Figure 3.4.6. Average preference scores for all conditions (High score means more preferred)... 81
Figure 4.1.1. Comparison between the conventional rendering and rendering with the OST. (When the PoV moves from the object and when PoV approaches to the object) ... 90
Figure 4.1.2. Comparison between the MT method and the AWMT method. ... 92
Figure 4.2.1. The best case and the worst case based on stationary users’ locations. ... 95
Figure 4.2.2 Comparison between the MT method and the AWMT with the OST. ... 96
Figure 4.2.3. Top down view of the experiment setup (left) and experiment Setup (right) ... 98
xvi
Figure 4.2.5. The graphic user interface on a user's tablet. ... 99
Figure 4.2.6. Procedure of the single task including 4 steps in the experiment ... 101
Figure 4.4.1. Task completion time for all conditions. .. 105
Figure 4.4.2.Total travel distance for all conditions. ... 106
Figure 4.4.3 System Usability Scale for all conditions. . 107
Figure 4.4.4. Dependency for all conditions. ... 108
Figure 4.4.5. Percentage of correct answer for all conditions... 109
Figure 4.4.6. Fatigue for all conditions. ... 109
Figure 4.4.7. Depth perception for all conditions. ... 109
Figure 4.4.8. Preference votes for all conditions. (High score means more preferred) ... 110
Figure 5.1.1 Stereoscopic visualization with the extreme disparity. ... 117
Figure 5.1.2. The difference convergence between the far object and the close object in the real world. ... 118
Figure 5.1.3. The difference between the toe-in method (left) and the off-axis method (right). ... 119
Figure 5.1.4. Typical fixed interpupillary distance in virtual reality. ... 120
Figure 5.1.5. The interpupillary distance is adjusted when the objects are close to the user. ... 121
xvii
Figure 5.2.2. 3D environment for the experiments ... 123
Figure 5.2.3. The result of average interpupillary distance. ... 124
Figure 5.2.4. Popping-out (left) and 3D depth perception (right) for all conditions. ... 127
Figure 5.2.5. Naturalness (left) and Discomfort (right) for all conditions. ... 127
Figure 5.2.6. Depth perception preference (left) and overall preference(right) votes for all conditions. (Higher score means more preferable) ... 128
Figure 6.1.1. Overview of the framework architecture. . 137
Figure 6.2.1. Command packet format. ... 142
Figure 6.3.1. An example of feasible solutions and Pareto set in 2D coordination. ... 144
Figure 6.3.2. An example of HRV. ... 146
Figure 6.3.3. An example of AMP. ... 146
Figure 6.3.4. Overview of the prototype VR system. .... 147
Figure 6.3.5 The prototype VR System. ... 148
Figure 6.3.6 The Hyper radial visualization in the prototype VR system. ... 149
Figure 6.3.7. The HRV parameter control interface on the mobile interface. ... 150
Figure 6.3.8. The HRV selection interface on the mobile interface. ... 150
xviii
interface (right). ... 151
Figure 6.3.10 Land use geometry and graphs visualization. ... 152
Figure 6.3.11 Mobile interface for the land use geometry and graph visualization. ... 152
Figure 6.3.12 The 2D land usage map (left-top), 3D DEM geometry model with the land use (right-top), distribution pie graphs left), line graphs for metrics (middle-right), and line graphs for 14 objectives (bottom). ... 153
xix
List of Tables
Table 3.3-I. Asked questions from the previous research. ... 72
Table 3.4-I. Statistical results of NASA-TLX subscales.. 77
Table 3.4-II. Statistical results for all conditions and comparison with the result of the user study by McGill et al. 2015. “1-2” denotes that there was a significant difference between condition 1(SV) and condition 2(SS). ... 79
Table 4.2-I. The target location on the cube and expected movement for the experimental tasks (L: Left, R: Right, and C: Center) ... 102
xx
Abbreviations
AWMT Activity-based Weighted Mean Tracking
FPS Frame Per Second
HMD Head Mounted Display
IPD Inter Pupillary Distance MDG Multi Display Groupware
MT Mean Tracking
NI Navigation Information
OST Object Shift Techniques
PoV Point of View
SDG Single Display Groupware SUS System Usability Scale
VE Virtual Environment
21
Introduction
This dissertation explores how multiple users interact with an immersive virtual reality visualization on a shared large-scale display and how to improve the multi-user interactive visualization.
1.1
Background
The first concept of Virtual Reality (VR) was a goggle-based “Pygmfalion’s Spectacle” from a science fiction story written in 1935, which included holographic imagery, smell, and touch (Weinbaum 1935). In 1962, Morton Heilig built the “Sensorama”, the first mechanical multi-sensory stereoscopic system engaging vision, sound, smell, and haptic1. In half century since these early concepts and prototypes, VR systems have developed in various ways. With the advance of display hardware and computer graphics technology, VR can now provide a very realistic virtual environment (VE). The high quality of auditory, olfactory, gustatory and haptic hardware and techniques additionally increase realism and immersion in VE. Early VR technology was focused on specialized and professional applications such as flight simulation (Jones 1999) or medical training (Ziv 2003; Kunkler 2006), but now VR is becoming more available to members of the public through inexpensive desktop and mobile VR solutions. VR is now
22
also available in a wide variety of domains such as cinemas2, games3, advertisement4, amusement parks5, and even museums6.
There are different types of display hardware that can be used in a VR system. In terms of display hardware for individual users, Head-Mounted Displays (HMD) have recently become popular as consumer grade computers can display high-quality graphics, and the price of HMD component hardware has become cheaper. With the introduction of the Oculus7 and the HTC VIVE8, HMD technology is available at an affordable price to consumers. Although an HMD provides an individual immersive VR experience, they may cause discomfort, and the user cannot see his/her real body which may limit the user’s level of presence in the VE (Cakmakci 2006). Another VE display technique is to use a large-screen or projected imagery. This setup can also provide an immersive VR experience and in addition can also easily support multiple users. However, this setup may require a large space and multiple displays to cover the space depending on the hardware setup.
Multi-user visualization and interaction techniques are becoming more popular as the number of people using VR increases. To support multiple users, two options are to use several HMDs, or a large-scale wall display (Cordil 2017) (see Figure 1.1.1). Several literature reviews describe the
2 VR cinema, https://thevrcinema.com/
3 VR games, http://store.steampowered.com/steamvr 4 VR advertisement, https://virtualsky.com/
5 VR amusement, https://thevoid.com/
6 VR museum, https://www.fi.edu/vr-at-the-museum 7 Oculus, https://www.oculus.com
23
positive and negative aspects of each approach (Urey 2011; Holliman 2011).
Figure 1.1.1. A large-scale wall display(left) and multiple HMD hardware setup (right) (Cordeil 2017).
Providing an individual HMD for each user is a simple way to implement multi-user interaction. Using multiple HMDs can provide an individual personal view to each user although this may increase the cost depending on the number of users and the sense of co-presence could be limited because the users cannot see each other in the VE (Cakmakci 2006). This problem could be solved by showing virtual avatars, but these are at a lower visual fidelity compared to physically seeing each other in the real world. Several researchers have attempted to show a realistic body of the user in a virtual environment using a camera (Bruder 2009; Gunther 2015). Such an approach can help a person to see him/herself in the virtual environment, however, the systems cannot provide views of other users (especially their faces) and are limited to showing only part of the body, such as a hand (see Figure 1.1.2).
24
Compared to the multiple HMDs setup, a single shared large-scale display can provide an immersive VE as well as co-location and co-presence cues as the display enables users to share the same physical space. In this thesis, the author employed the single shared large-scale display rather than using multiple HMDs for collaborative interaction. With a single shared large-scale display, users can understand other users’ emotion better by reading their face and body gestures. This can help collaboration and discussion between users.
For a single shared large-scale display, a common display setup for multiple users is to share a large-scale display with a single visualization view that all user’s share. This technique is cost-effective because it does not need special hardware. However, the technique usually employs a single point of view (PoV) for the visualization and may not provide a proper view for each user if they are standing in very different places in front of the display. This single PoV may cause visual sickness if 3D stereoscopy is provided and the users’ viewpoints and the single PoV are not aligned together. Also, there can be control issues if each user tries to have individual control over the display viewpoint. Another display setup is a split screen, which splits a large-scale display and each screen can be used by the single user. This setup can provide independent screens for users and can increase users’ presence. Also, it supports to share visualization and information. However, the number of split screens can be limited due to the screen space.
25
hardware limitation and there may be problems with lower resolution, lower brightness, and increased hardware cost (Holliman 2011). Providing individual views also does not guarantee better collaboration and sharing of information. The transition between individual and collaborative activities for the shared information and methods for supporting mutual awareness of other’s activities must be designed explicitly (McGill 2015).
In spite of the disadvantages of a shared large-scale display, they have been widely used for multi-user interaction because users can collaborate in the same space and discuss the same visualization. Although many techniques have been developed for multi-user interaction with a shared large-scale display, there is still a lack of effective interaction techniques and many topics that have not been explored yet. Therefore, it is important to research multi-user interactive visualization with a shared large-scale display.
This dissertation explores how multiple people can interact with immersive visualization with a shared large-scale display effectively with less visual fatigue. The remainder of this chapter describes research questions, research approach, a main experimental system, contribution of the thesis, and an overview of the Ph.D. work (thesis structure).
1.2
Problem statement
26
visual fatigue. A display setup for multiple users is an important problem because this can have an impact on the interaction performance, usability, and workload. Secondly, multiple users can have difficulties in interacting with visualization and can perceive visual fatigue more if a collaborative visualization system cannot provide proper interactive visualization for multiple users. Thirdly, collaborative visualization has to provide a visually comfortable environment with less visual fatigue to let users interact with visualization effectively.
Traditionally, visualization systems are designed for a single user on a desktop computer and collaborative visualization (or multi-user visualization) systems have extended the traditional concept of visualization in order to support multiple users. Collaborative visualization also incorporates research from other fields such as distributed computing, human-computer interaction, and computer-supported cooperative work (CSCW) (Isenberg 2011). While collaborative visualization benefits from work in these disciplines, there are many challenges, aspects, and issues that are unique to the intersection of collaborative work and visualization. These include human-centered interactive visualization, fatigue for multi-user interaction, and coordinating user input in collaborative visualization systems.
Previously, several definitions of collaborative visualization have been given (Pea 1993; Raje 1998; Li 2006), but these were typically a general definition for visualization as the use of computer-supported, interactive, visual representations of information to amplify cognition (Card 1999). Recently Isenberg et al. (2011) redefined it to describe the entire scope that collaborative visualization can encompass;
27
joint information processing activities.
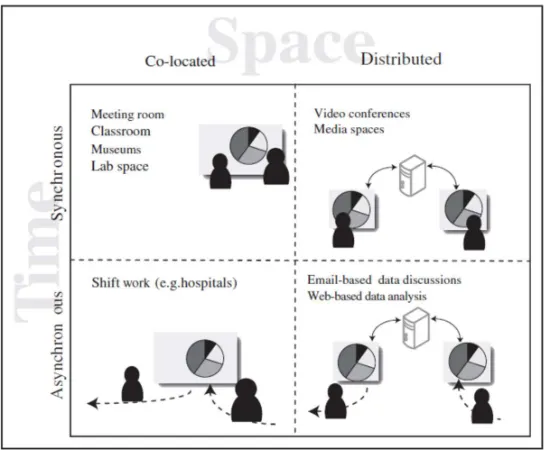
[image:29.612.168.440.300.525.2]There are many ways to categorize collaborative visualization, however, the space-time matrix is often broadly used (see Figure 1.2.1). This classifies collaborative systems according to where they occur in space (distributed or co-located) and in time (synchronous or asynchronous). Collaborative visualization systems can cross the boundaries of this matrix. For instance, both synchronous or asynchronous collaboration can be supported by the same system. Figure 1.2.1 depicts examples of the collaborative visualization categorized by space-time matrix.
Figure 1.2.1 Examples of collaborative visualization categorized by space-time matrix (Baecker 1993; Dix 1998)
28
has moved from technical aspects such as network latency, synchronization, and framerate to social and human-centered questions such as how to engage a number of audiences in discussing and exploring information or how non-experts can share data and visualization effectively on online (Heer 2008).
For co-located collaborative visualization, systems can be categorized into Single Display Groupware (SDG) and Multi Display Groupware (MDG) (Stewart 1999). Examples of SDG are large interactive walls (Guimbretière 2001) or table-top displays (Wellner 1993). Some of the main research topics in SDG are coordination of activities in the workspace (Morris 2004; Scott 2004; Nacenta 2007), awareness of member’s activities (Tang 2006), and access and transfer in/between workspace(s) (Kruger 2004). Multi-touch technology enables users to interact with the system independently and synchronously, but, these synchronous inputs lead to new challenges. Research has been conducted to address methods for coordinating user input in collaborative visualization systems (Forlines 2005; Isenberg 2007; Heer 2008; Isenberg 2009; Tobiasz 2009).
Examples of MDG are distributed multiple displays and a single display with multiple individual devices. Research on MDG has included exploring coordinating input and output from multiple different display devices such as a large display with mobile devices (Johanson 2002). Previous research addressed molecular visualization across large displays and a table-top (Forlines 2008), geospatial visualization across a similar display (Forlines 2006), and multiple display setups using a network communication to share visualizations from laptops on large displays (Wigdor 2009).
29
how to leverage visualization techniques in scientific fields (Kilman 1997; Schissel 2004; Bernholdt 2005), and how to improve social interaction (Isenberg 2011; Cogburn 2003). However, there haven’t been much study on how to design display interfaces, how to improve interactive visualization and how to reduce 3D visual fatigue, that this thesis mainly focuses on.
Many visualization applications have been developed and for table-top interfaces (Vernier 2002; Shen 2003; Tse 2007; Forlines 2008; Lissermann 2014), and wall-size displays (Stefik 1987; Streitz 1999; Johanson 2002; Izadi 2003; Prante 2004; Wigdor 2009) to support seamless, effective and natural multi-user interaction. They mostly employed a shared view that enables users to access the whole space on the screen together. Several studies (Tse 2007; Lissermann 2014; McGill 2015) evaluated their interfaces by comparing a shared view and a split screen. In a few studies in the television industry (McGill 2014), several advantages and disadvantages of a shared view and a split screen display setup for multi-user interaction were briefly discussed, but they were not explored in detail. McGill et al (2015) also evaluated display setups for multiple users, but they did not provide equitable control interfaces to evaluate their visual interfaces. Therefore, it is necessary to evaluate display setups for multi-user visualization with a shared large-scale display in order to investigate the effect of display setup and the relationship between display setups and multi-user interaction.
30
fatigue can become worse in collaborative visualizations with 3D stereoscopy. An alternative is tracking multiple users instead of tracking a single user (the leader). This approach often employs a Mean Tracking method that averages the locations of all the users to determine the location of a single point of view (PoV). This is a common tracking method for multi-user visualization (Marbach, 2009; Schulze 2012; Tripicchio 2014), and can reduce visual sickness for users, but it is not able to efficiently reflect individual users' movement. Users can be frustrated when they move because the PoV moves slowly as the system averages the movements of all users sharing a screen. Therefore, the Mean Tracking method is not an optimal solution for interactive collaboration visualization and it is necessary to enhance interactive collaborative visualization.
When designing interactive visualization for multiple users, 3D visual fatigue can be another problem. There are several causes of the visual fatigue in 3D stereoscopic visualization such as crosstalk, depth of field, motion, inappropriate disparity, and cardboard effect. Inappropriate disparity is one of the major causes of 3D visual fatigue and many techniques have been developed to reduce this. The approaches to reduce visual discomfort from inappropriate disparity can be categorized into depth (disparity) remapping techniques (Konrad 1999; Kishi 2008; Ide 2010; Holliman. 2004; Lang 2010; Wu 2011; Sohn 2014; Oh 2015), generating empty depth information (Park 2004), and adjusting camera separation (Mangiate 2012). These techniques can increase visual comfort although they have several limitations such as computation complexity. Therefore, another approach is required to reduce visual discomfort for multi-user interactive visualization.
This thesis has a number of novel contributions compared to previous research as following:
31
2. Proposed the novel interactive visualization techniques for multiple users with a shared large-scale display in order to provide effective interaction and visualization.
3. Proposed the 3D visual fatigue reduction technique for 3D multi-user interactive visualization.
4. Developed the multi-user interactive visualization framework to facilitate building a multi-user virtual environment.
1.3
Research Aim
The dissertation investigates display setups for multiple users with a shared large-scale display and explores how to improve interactive visualization for multiple users and how to reduce the visual fatigue in 3D stereoscopy for collaborative visualization. The main aims of the thesis are to:
1. Understand the approaches and limitations of the technology of current multi-user interactive visualization with a shared large-scale display (Chapter 2).
2. Understand the display setups for multi-user visualization with a shared large-scale display and relevant display interfaces (Chapter 3).
3. Learn the effects of the display setups and the relationship between display setups and multi-user interaction (Chapter 3).
4. Understand the current interactive visualization techniques for multiple users with a shared large-scale display and limitations of them (Chapter 2 and Chapter 4).
32
6. Understand the causes of the visual fatigue from 3D stereoscopy and limitations of the techniques to reduce 3D visual fatigue (Chapter 2 and Chapter 5).
7. Learn the relation between interpupillary distance and visual fatigue (Chapter 5).
8. Suggest how to increase visual comfort when multiple users interact with a shared large-scale display and evaluate them (Chapter 5).
9. Develop a multi-user interactive visualization framework to utilize the ideas from the user studies (Chapter 6).
1.4
Research Approach
This section addresses the research approach, the relationship between the studies.
This research starts with exploring how to improve 3D interactive visualization with a shared large-scale display for multiple users. The first main user study in Chapter 3 was designed to investigate display setups with a shared large-scale display for multiple users. The second study in Chapter 4 was about how to improve interactive visualization when many users interact with a shared large-scale display. In the third study in Chapter 5, a technique for reducing visual fatigue in an interactive visualization system was discussed. For these studies, the author developed an underlying software framework (Chapter 6) and designed a set of experiments.
33 stereoscopy.
From the literature review, the author doubted which display setups are effective for multi-user visualization and how the display setups can influence the multi-user interaction. To investigate the effect of display setups and the relation between display setups and multi-user interaction, the author conducted a user study to evaluate the common display setups for multiple users (a shared view, a split screen, and a split screen with navigation information). From the results of the experiment, the author made several insights into the design of a display setup for multiple users.
From the first study, the author employed a shared view for multi-user interactive visualization with a shared large-scale display due to the advantages of the shared view. The split screen and the split screen with navigation information can improve users’ confidence and reduce frustration level and are more preferred than a shared view. However, a shared view can still provide effective interaction and collaboration and the display setups cannot have a large impact on usability and workload. Therefore, a shared view was employed in the thesis research because the exploration and discussion in a virtual environment require more information and space to display.
To improve interactive visualization with a shared view for multiple users, the author designed and conducted the second user study. A pilot study using a conventional interaction technique, the mean tracking method, with three users showed that this was not effective. Therefore, two interactive visualization techniques were developed for multi-user interaction and were evaluated in the second user study. These techniques can support collaboration, improve interactivity, and provide similar visual discomfort compared to the conventional method.
34
multiple users interact with 3D stereoscopic VR using multi-user interactive visualization techniques and they are close to the virtual objects, they can perceive 3D visual fatigue from the large disparity. So, the author introduced a 3D visual fatigue reduction technique for 3D stereoscopy. Multi-user interaction with a shared view uses a single point of view (PoV) to visualize on the screen, so the author simulated visualization with a single PoV and tested it with a single user. From the findings of the evaluation, the author suggested a 3D visual fatigue reduction technique for multi-user interactive visualization systems.
For these studies, the author developed a software framework described in Chapter 6 and designed a set of experiments. Chapter 6 describes the framework architecture that contains the three main ideas. A demonstration application for multi-dimensional decision making was developed using the framework.
1.5
Experimental System
To study the 3D multi-user interactive visualization with a shared large-scale display, the author used a three-sided projection based immersive visualization display (2.8m by 1.8m for each screen) (see Figure 1.4.1), named “VisionSpace”. The system provides immersive virtual environment for multiple users with a multi-user tracking system. The whole display has resolution of 3072 by 768 pixels. The three screens were aligned at an angle of 120 degrees so that they formed a shape of a half of a hexagon from the top down view. For 3D stereoscopic visualization, the system uses passive circular polarization filters on the projectors and on the glasses. A set of reflective balls attached to glasses is tracked by an ART tracking camera system (ART)9 to obtain the position and rotation of the two participants. The
35
interactive visualization was run on the computer with an Intel Quad-core Q9550 2.83GHz with triple SLI Nvidia GTX 260 graphics cards. Samsung Nexus 1010 tablets were used as control devices and a mobile user interface was built for them with the Unity 3D 11 graphics engine. The OpenSceneGraph12 library and the Virtual Reality Peripheral Network (VRPN)13 library were used to render the data visualization and to communicate with the ART tracking system, respectively. The visualization system communicated with the tablets using the Window Socket protocol14. Details of each interface design used in the studies are addressed in the corresponding chapters of each user study.
Figure 1.4.1 Top down view of the experiment setup.
1.6
Research Contributions
This thesis makes a number of contributions to research in multi-user interaction with a shared large-scale immersive display.
1. A literature review of multi-user interaction with a shared large-scale
10 Samsung Nexus 10
(http://www.samsung.com/us/support/owners/product/google-nexus-10-tab-wi-fi)
11 Unity3D (https://www.unity3d.com/)
12 Open Scene Graph (https://www.openscenegraph.org)
13 Virtual Reality Peripheral Network (https://github.com/vrpn/vrpn) 14 WinSock
36
display and relevant areas. The review focused on display setups, interactive visualization, and 3D visual fatigue for multiple users.
2. Deeper insights into three display setups for multi-user interaction with a shared large-scale display.
3. Development of two novel multi-user interactive visualization techniques (the Object Shift Techniques and the Activity-based Weighted Mean Tracking method) that support interaction with multiple users and help to reduce the visual fatigue.
4. Development of an Adaptive Interpupillary Distance Adjustment technique that can reduce visual fatigue caused by the extreme disparity between the views of the users’ left and right eyes.
5. Demonstration and user evaluation of three display setups (a shared view, a split screen, and a split screen with navigation information). The user study includes the evaluation of interaction performance, collaborative usability, and user preference.
6. Implementation and evaluation of the three novel interaction techniques (the Object Shift Techniques, the Activity-based Weighted Mean Tracking method, and the Adaptive Interpupillary Distance Adjustment technique). Each user study measured interaction performance, depth perception, visual fatigue, usability, and performance.
37
1.7
Thesis Structure
This thesis aims to understand multi-user interactive visualization with a shared large-scale display and to improve the user experience. Based on these goals, the rest of this thesis includes chapters on investigating display setups for a shared large-scale display, improving multi-user interactive visualization, and reducing 3D visual fatigue.
In Chapter 2, the state art of 3D multi-user interactive visualization with a shared large-scale display is introduced. Firstly, the review of the display setups for multi-user interaction is explored, then an overview of interactive visualization for multiple users is given, and the main limitations of conventional multi-user visualization is discussed. Lastly, the main causes of visual fatigue with 3D stereoscopy are explored and the problem of large disparity is mainly discussed.
Chapter 3 investigates the display setups for multi-user interaction with a shared large-display. The author describes the design of the three main display setups and a demonstration using these setups. Using these display setups, a user study was conducted and its results are discussed.
In Chapter 4, interactive visualization techniques for multiple users are discussed. In order to overcome the limitation of the current multi-user interactive visualization techniques, two new interaction techniques are discussed and a detailed implementation of the techniques are described. A user study to evaluate the interaction techniques is presented and the results of the user study and further comments are discussed.
38
is described and then based on the result of this first study, the second user study was conducted to evaluate the adaptive IPD method compared to traditional 3D stereoscopic and the monoscopic visualization techniques.
In Chapter 6, a framework for 3D multi-user interactive visualization and a prototype application for multi-dimensional decision making are covered. Firstly, the architecture and main features of the framework are described in detail. Secondly, the definition and the terminology of a multi-dimensional decision making are briefly introduced, then a detailed implementation of the application is discussed, using the framework the author has developed.
39
Related Work
This chapter describes relevant prior research in 3D multi-user interactive visualization with a shared large-scale display. First, previous research is discussed on display setups for multiple users with a shared large-scale display including related display interfaces. Secondly, previous works on interactive visualization with a shared large-scale display for multi-user interaction are explored. Thirdly, the causes of the visual fatigue from the 3D stereoscopy and previous works to reduce the fatigue are described.
2.1
Display Setups for Multiple Users
This section describes the fundamental categories for display setups (Single Display Groupware and Multi-Display Groupware) for multi-user interaction including their advantages and disadvantages. Next, the related work including other similar research to the thesis is explored.
2.1.1 Single Display Groupware and Multi-Display Groupware
40
The MDG allows users to have task independence and selective or casual awareness (McGill 2015) and can provide a collaborative environment. However, the MDG can disperse users’ attention due to having multiple displays and it may not be cost-effective because it requires multiple display hardware. In this thesis, SDG is mostly discussed for multi-user interaction because it can be better for providing collaborative environments for multiple users. Figure 2.1.1 shows an example of SDG and MDG.
Figure 2.1.1 An example of Single Display Groupware (left) and Multi-Display Groupware (right) (Wallace 2009)
41
2.1.2 Co-located Collaboration Display Interfaces
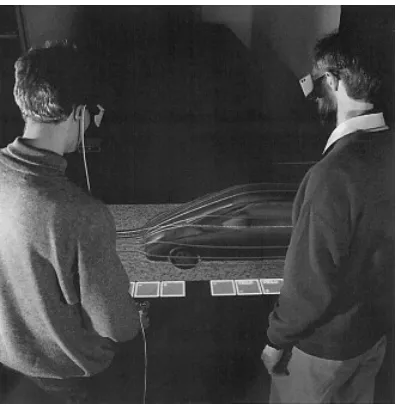
[image:43.612.207.405.281.484.2]The responsive workbench was one of the earliest visualization systems for co-located collaboration around a large horizontal surface (Kruger 1995). It provided a virtual reality environment that displayed shared 3D scenes via shutter glasses to people standing around the table. Several scientific visualization applications such as fluid simulation and situational awareness applications were developed on the platform as shown in Figure 2.1.2. (Wesche 1999).
Figure 2.1.2 Fluid simulation on the responsive workbench (Wesche 1999)
42
Figure 2.1.3. Circular table interface (left) and radial tree representation (right) (Vernier 2002)
Tse et al. (2007) explored a multimodal independent display, shared display, and True groupware display (remote display) on a table-top interface and offered a generalized approach for each setup. The independent display setup provides separable interaction, the shared display supports rich awareness for each user, and the True groupware display allows remote users to work in parallel on a large screen. Figure 2.1.4 shows the different display setups.
Figure 2.1.4. Independent display (left), shared display (center), and True groupware display (right) on the table-top interface
(Tse 2007).
43
techniques for multiple users using a table-top display and a shutter display to support co-located collaboration (Lissermann 2014). This system provided not only private views but also a shared view, and additional gesture interaction allowed users to independently control each view. They evaluated the prototype system by comparing it to a conventional table-top setup and a split screen configuration. From the evaluation, they found that the Permulin setup enables users to share information as well as to support private work unobtrusively. However, the system is basically a multi-view system, which may not be optimal for collaboration with a large-scale display in terms of sharing information. Figure 2.1.5 shows the overall hardware setup and system concept.
Figure 2.1.5 Permulin hardware setup (left) and system concept (right) (Lissermann 2014)
Compared to the table top display for collaboration, several wall-display techniques have also been developed. The Collab system was one of the first to provide a collaborative environment for people to work together face to face or remotely on multiple desktops and a large display wall (Stefik 1987).
Dynamo supported the ability to transfer users’ media to a shared display (Izadi 2003). Digital furniture and interaction techniques were designed to support spontaneous collaboration using the InteractTable, Dyna Wall, and
44
collaborative spaces. UbiTable developed by Shen et al. (2003) provided spontaneous, walk-up-and-use functionality to share data, such as photos and notes. Everitt et al. (2006) designed interaction and document transfer techniques between vertical displays, a table, and portable devices. iRoom
was designed to provide a seamless interactive environment (Johanson 2002).
WeSpace was a collaborative workspace that integrated a large data wall with a multi-user multi-touch table for small groups for data exploration and visualization (Wigdor 2009). These interfaces could improve collaborative interaction using various hardware. In their studies and development, they employed a single shared view and the research mainly focused on the development of user interfaces and interaction between interfaces and users or between interfaces.
Rogers and Lindley made several observations from user studies comparing vertical and horizontal interactive displays in a city tour planning task (Rogers 2004). Users with the table display were more encouraged to switch roles, explore ideas and follow closely what each user was doing. In contrast, users found that a wall display is socially awkward for collaboration. Tan et al. (2006) showed that large displays can improve productivity in spatial tasks, and Ball and North (2005) showed the potential performance benefits of large displays in low-level navigation and visualization tasks. Hou et al. (2012) found that the larger displays are suitable for increasing immersion. They discovered that large displays increase the sense of self-presence than smaller displays and a user sacrifices many benefits of larger displays to indulge in using a personal device. They suggested that if possible the shared utilization of the screen would be preferable than the use of personal devices.
2.1.3 Research on other relevant topics.
45 display.
The proxemic approach was suggested by Ballendat et al. (2010). The interaction technique was demonstrated with dynamic visualization on a shared view using proxemic information, location, and user view directions. The system varied the display setups such as the shared view and the multi-screen based on multiple users’ behavior. Figure 2.1.6 depicts various display setups for multi-user interaction.
Figure 2.1.6 Examples of multi-user interaction using proximity. (Ballendat 2010)
46
compared to manual and fixed access schemes. However, the result of the solution optimality with the shared access scheme was lower than the other schemes.
Figure 2.1.7. MDG configuration(left) and SDG configuration (right) (Wallace 2009)
47
Figure 2.1.8. Single display with a shared controller (left), two displays with two controllers (center),
and multi-view display with two controllers(right). (McGill 2015)
Although researchers have developed special purpose interaction components to mitigate the spatial interference in a shared SDG, the fact that the interference was not high in a shared SDG was found (Tse 2004). They studied how co-located people partitioned their collaborative drawing activities within a shared SDG environment. The result of the experiment revealed that people tend to avoid interfering with their partners by spatially separating their actions in the workspace.
2.2
Interactive Visualization for multiple users
This section explores interactive visualization techniques with a shared large-scale display for multiple users.
48
Figure 2.2.1. Multi-user interaction with visual filtering. Left and right users share the same information but have different views.
(Agrawala 1997)
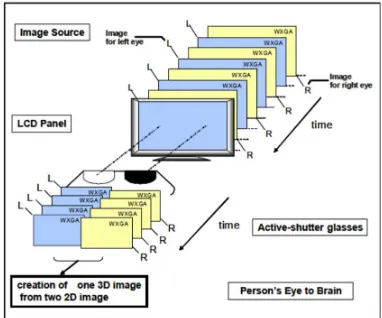
The time multiplexing technique displays the images for each eye and each user alternatively. Figure 2.2.2 illustrates the system configuration for time multiplexing technique. If the number of user increase, more images are required to be displayed, so that the system needs high-frequency refresh rate display to implement it.
Figure 2.2.2. Time-sequential 3D system for one user. (Suzuki 2009)
49
Figure 2.2.3. Physical separation for multiple users. Each user has his/her own physical screen but they share the visualization
(Arthur 1998).
On the other hand, using a single shared viewpoint is another way to support multiple users, providing an identical view on a single display. This approach could be more cost effective than the individual view techniques mentioned. Early shared viewpoint techniques include the use of a common PoV (Blom 2002) and deformation of the projection method (Naemura 1998) to share viewpoints by distorting rendering scenes. Despite the advantages of using a shared viewpoint technique (i.e. low cost and easy implementation), it does not guarantee a correct perspective to all the users. However, the quality of the implemented visualization can be acceptable (Tripicchio 2014).
50
Figure 2.2.4. Breaks in the images due to screen edges (left) and no
breaks with a per-pixel-column technique. (Simon 2004)
McGinity et al. (2007) built a cylindrical VR theater where up to 20 users could work together simultaneously using the Omnistereo technique. However, the Omnistereo does not use user-tracking hardware, so the capability of individual users to look around objects in the 3D world was limited.
Figure 2.2.5. Hardware setup for AVIE (left) and an example application of the system (right) (McGinity 2007)
51
Figure 2.2.6. Image blending technique(left) and view clustering technique(right). (Marbach 2009)
Schulze et al. (2012) demonstrated the use of democratic rendering for multi-viewers in surround VR systems using dynamic zone, dynamic tiling and per pixel camera techniques. Although the rendering techniques provided a sophisticated result for multiple users, it still averages the users' position and rotation when the users look at a nearby point. Also, the per pixel camera technique has the drawback of slowing down the frame rate due to computation complexity.
Figure 2.2.7. Two users looking in a different direction (left) and the same direction (right). When they look in the same direction (right), the
final PoV is calculated by the average of the users’ location. (Schulze 2012)
52
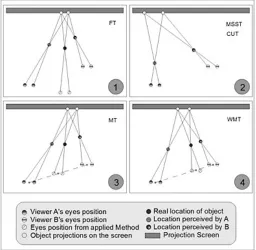
the PoV is averaged over all users) and a weighted mean tracking method (where a closer user has larger weight in deciding PoV) are the best ways for visual comfort and overall usability. In the MT method, the final point of view
is determined by the equation: PoV = ∑ 𝑈𝑠𝑒𝑟𝑃𝑜𝑠𝑖𝑡𝑖𝑜𝑛 , where
[image:54.612.178.434.261.511.2]PoV is the final position of view and N is the number of users. In the weighted mean tracking method, a closer user contributes a higher weight to when computing the PoV.
Figure 2.2.8. Schematic two-dimensional diagrams of common point-of-view calculation methods. FT, fixed tracking; MSST, manually switched single tracking; CUT, closer-user tracking; MT, mean tracking; WMT, weighted mean tracking. (Tripicchio 2014)
53
had better performance than tracked interaction, interaction with head-tracking performed better than multi-viewpoint interaction in a simple manipulation task.
2.3
3D Visual Fatigue
Multi-user interactive visualization for a shared large-display using 3D stereoscopy can create visual fatigue. The common causes of visual fatigue from 3D stereoscopy and reduction approaches are discussed. In this section, the main causes of visual discomfort in 3D stereoscopy are introduced and the reduction techniques to reduce visual fatigue caused by one of the major causes, inappropriate disparity, are reviewed.
2.3.1 Visual discomfort
There are many literature reviews about the causes of visual discomfort in 3D stereoscopy. (Howarth, 2011; Tam 2012; Bando 2012; Urvoy 2013; Li 2015) and they introduced several main causes of visual discomfort from stereoscopy.
2.3.1.1 Crosstalk
54
Figure 2.3.1. Crosstalk (ghosting, left) and normal scene (right).15
2.3.1.2 Depth of Field
Depth-of-Field is the depth range at which sharp shapes appears. In normal viewing, eyes converge on an object of attention and then the object is drawn into sharp focus (using the coupling between vergence and accommodation). The other objects behind and in front of the object become blurred. This process helps to prevent binocular rivalry and excessive disparities caused by being far from the plane of convergence. Figure 2.3.2 illustrates the difference between without depth of field and with depth of field.
The vergence varies depending on the disparity of targets, while the accommodation is fixed at the screen distance. The conflicting between the vergence and the accommodation, called vergence-accommodation conflict, makes the visual system more difficult to respond quickly and accurately compared to normal viewing. Artificial blurring technique can help reducing this discomfort and the vergence-accommodation conflict (Torii 2008; Carnegie 2015).
55
Figure 2.3.2. Without depth of field (left) and with depth of field (right)16.
2.3.1.3 Motion
Motion is another factor that can cause visual discomfort. Especially, fast motion in depth can create visual discomfort. Fast switching between crossed and uncrossed disparities may also affect visual discomfort. (Speranza 2006)
2.3.1.4 Inappropriate disparity
Inappropriate disparity is a major factor in visual discomfort, known as “on-screen disparity (parallax) or retinal disparity”. It is caused by misalignment of left and right views and views with different projections. (Kooi 2004; Banks 2012). Excessive disparities are difficult to fuse left and right images, which disturbs to create depth perception and makes users discomfort.
2.3.1.5 Cardboard effect
Cardboard effect is a flattening effect on the screen caused by missing depth cues, small camera baseline, and limited depth resolution. This can be addressed by generating missing depth information using adaptive disparity mapping (Shibuhisa 2012). Figure 2.3.3 shows an example of the of adaptive disparity mapping suggested by Shibuhisa et al. Original 3D image (upper left), original disparity information (upper right), disparity information after modifying spatial layout (bottom left), and disparity information after
56 adaptive disparity mapping (bottom right).
Figure 2.3.3. An example of adaptive disparity mapping (Shibuhisa 2012).
2.3.2 Inappropriate disparity
Although there are many factors that cause visual discomfort, inappropriate disparity is one of the major factors. To reduce the discomfort from inappropriate disparity, many techniques were developed. For example, there are various approaches for enhancing visual comfort by adjusting the depth range using view synthesis (Konrad, 1999; Kishi 2008; Ide 2010).
Early, Konrad (1999) developed a block-based linear interpolation method. This method interpolated the disparity map using a block window and compensated the big disparity among pixels.
Ide et al. (2010) presented a novel idea about how to maintain the 3D aspect ratio of 3D images for resizing or changing viewing window and display size. Using non-linear resize that alters the depth dependent disparity of 3D stereoscopy, they preserved skewed z-axis that causes visual comfort.
57
by reducing excessive parallax using interview rendering methods.
Figure 2.3.4. The concept of scalable 3D image conversion (Kishi 2008).
Holliman implemented non-linear depth scaling (Holliman 2004). He provided the improved depth perception in a defined region of interest compared to other regions of the scene. To find the interesting region, the position of view was tracked.
Another non-linear disparity mapping technique for stereoscopic 3D was developed by Lang et al. (2010). This technique used sparse correspondence and image warping with non-linear and locally adaptive depth mapping methods. This technique used temporal and special depth information in 3D videos and could reduce discomfort. Figure 2.3.5 depicted the original image and the result image after applying the non-linear remapping method.
Figure 2.3.5. Nonlinear disparity remapping. The original image (left) and nonlinearly remapped image. (Lang 2010)
58
They used the linear function for average image disparities and the nonlinear function for extreme disparities, which can improve the visual comfort level. Sohn et al. (2014) developed a technique combining global linear scaling with local nonlinear scaling for extreme disparity regions. Oh et al. (2015) estimated visual fatigue using disparity magnitude, disparity motion, and spatial frequency and then remapped the disparity with the nonlinear function.
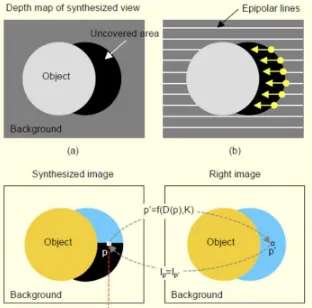
[image:60.612.228.384.320.474.2]Park et al. (2004) developed a novel technique to synthesize the virtual views at the location of the interval between two physical cameras. They could reduce visual discomfort by created depth information in empty depth area. Figure 2.3.6 showed the view synthesis procedure.
Figure 2.3.6. An illustration of the view synthesis procedure. (a) forward mapping, (b) directional interpolation of disparity map along
epipolar line (Park 2004).
59
Figure 2.3.7. Comparison between two different camera separation for a handheld device. (Mangiate 2012)
2.4
Chapter Summary
This chapter reviewed previous research in 3D multi-user interactive visualization with a shared large-scale display focusing on the three main topics of this thesis: display setup, interactive visualization, and 3D visual fatigue.
60
effect of display setups and the relationship between display setups and multi-user interaction, Chapter 3 investigates display setups for multi-multi-user visualization.
Section 2.2 described previous works on interactive visualization with a shared large-scale display for multiple users. Many visualization techniques with a shared large-scale display for multiple users have been developed in order to support interactive visualization, effective collaboration, and less visual fatigue. However, they still have limitations such as requiring special hardware and limiting the individual user’s view. Most multi-user interactive visualization systems employed the MT method because it could reduce visual discomfort. However, the MT method cannot reflect individual users' movement effectively for visualization as the PoV is calculated using the average of multiple users' locations, which makes the movement of the PoV less than the physical traveling distance. In stationary tasks where users do not need to travel frequently, such as object manipulation, the MT method could be tolerable. However, in applications requiring frequent movements, such as spatial exploration, the MT method may not be the optimal solution. To overcome the limitation of the MT method, Chapter 4 introduces interactive visualization techniques for multiple users and evaluates the combination of these methods.
61
separation. The depth remapping techniques can decrease the overall depth perception. Also, they are computationally complex or some approaches require sequential information to adjust the depth map. The generating empty depth information approach may not be the optional solution for the real-time virtual environments because it requires more computation. In a virtual environment, the depth information can be easily obtained using a depth buffer as well. The fixed camera separation approach for handheld devices may not give immersive 3D depth perception in general virtual environment due to the short interpupillary distance. The previous research could reduce visual discomfort effectively although they have several limitations. It requires more computation or more information to adjust disparity information, which may not be suitable for a real-time virtual environment. It is also possible to degrade overall depth perception. In Chapter 5, the author proposes a method for adaptively and automatically adjust the IPD according to the configuration of the 3D scene, so that the visualization can maintain sufficient stereo effect while reducing visual discomfort.
The next Chapter introduces common display setups for multiple users and discusses the effect of display setups and the relation between display setups and multi-user interaction.