Journal of Software Engineering and Applications, 2019, 12, 101-126 http://www.scirp.org/journal/jsea ISSN Online: 1945-3124
ISSN Print: 1945-3116
DOI: 10.4236/jsea.2019.125008 May 23, 2019 101 Journal of Software Engineering and Applications
Transformation of User Interface to Activity
Models and Assessing Performance of WA/WS
Ch. Ram Mohan Reddy , D. Evangelin Geetha, R. V. Raghvendra Rao, T. V. Suresh Kumar
1B.M.S College of Engineering, Bengaluru, India 2Ramaiah Institute of Technology, Bengaluru, India
Abstract
Quality of Service is an important attribute of a software system. In retros-pect, performance assessment based on user interaction with the system has given a better understanding of underlying disciplines of the product. In this paper, we capture user interaction with the prototype/User Interface (UI). An approach for developing activity model from the user interface model is pre-sented using workflows and functional elements. A methodology is proposed to transform UI into activity diagram. The approach is validated by an expe-rimental setup using Amazon service. The performance of Amazon service is assessed using activity based performance prediction methodology, and the simulation results are obtained using SMTQA.
Keywords
Web Services, Software Performance Engineering, Web Applications, Software Size Estimation, Activity Based Performance Prediction, Unified Modeling Language
1. Introduction
Web services are software components that provide flexibility to operate be-tween different applications through the Internet [1]. Performance plays a sig-nificant role in achieving the Quality of Services (QoS) of web services. Every aspect in the analysis, design, code, and deployment of web services has an im-pact on its performance. Hence, it is difficult to understand the complexity at a given point in time. Performance is an essential attribute to be assessed for web applications/web services (WA/WS) of all the other quality attributes. The cus-tomers or users of the software expect the web services to respond fast as they don’t want to wait for a long time.
How to cite this paper: Ram Mohan Red-dy, Ch., Evangelin Geetha, D., Raghvendra Rao, R.V. and Suresh Kumar, T.V. (2019) Transformation of User Interface to Activ-ity Models and Assessing Performance of WA/WS. Journal of Software Engineering and Applications, 12, 101-126.
https://doi.org/10.4236/jsea.2019.125008
Received: February 25, 2019 Accepted: May 20, 2019 Published: May 23, 2019
Copyright © 2019 by author(s) and Scientific Research Publishing Inc. This work is licensed under the Creative Commons Attribution International License (CC BY 4.0).
DOI: 10.4236/jsea.2019.125008 102 Journal of Software Engineering and Applications The poor performance of service from the user point of view may generate customer dissatisfaction and damage the external image of the company, leading to loss of business. To prevent this kind of dissatisfaction, it is imperative to look for methods to assess performance in various aspects of Software Development Life Cycle (SDLC) and also from the user point of view.
To identify the optimal web services, QoS is important in the service compu-ting field based on the user's request by considering both functional and non-functional requirements. Increased in a number of web services, it will be difficult for users to identify the relevant web service that satisfies both function-al and non-functionfunction-al specifications. It is most criticfunction-al to anticipate the perfor-mance of applications under development. However, we exploited these tech-niques in our methodology to assess performance with respect to the user point of view. User interaction based studies of WA/WS are done in [2] [3] [4].
In practical terms, this implies that we can estimate performance early (pro-totype) with a user point of view based on activities. The primary purpose of ac-tivity models of UML is to interpret the activities of a user in association with the WA/WS system, as a means of uncovering functional requirements to be supported by the system. This approach has techniques that can be applied in any phase of software development. Unified Modeling Language (UML) [5] is the leading modeling language in the field of systems engineering and has gained much tool support.
Categorizing the requests into a number of activities and modeling of these activities helps in estimating performance. The models we offer to address this situation are the activity based size models as discussed in [6]. Different activities are associated with requests for documents of different sizes.
Building a prototype of applications during the analysis phase of the software development life cycle is a usual industry practice. The graphical user interface has become predominant, and the design of the visible or external system [7] has acquired increasing importance. This has derived attention being given to usa-bility aspects of an interactive system and a need for evolution of tools to aid in the design of the external system [8], [9], [10]. Models and notations are in-volved to describe user tasks and to map these tasks with the User Interface (UI) of Web Applications (WA)/Web services (WS). This gives the Web Service Us-ers (WSU)/Web Service DevelopUs-ers (WSD)/Web Application DevelopUs-ers (WAD)/Web Applications Users (WAU) a guideline in selecting the web appli-cation/web service. An approach that helps to transform user interface into ac-tivities is proposed in this paper.
2. Related Work
In the literature, quite a significant amount of attention has been paid to utilize the flexibility of user interface design in the implementation and analysis of web applications/web services.
Ch. Ram Mohan Reddy et al.
DOI: 10.4236/jsea.2019.125008 103 Journal of Software Engineering and Applications aspects to the development process requires that SPE process be tightly inte-grated with the software development methods. For any application, SPE is vital to ensure that the architecture and design are appropriate for meeting perfor-mance objectives before implementation begins. SPE models [12] help to eva-luate the software architecture, the technical architecture, and the implementa-tion choices for the web services. Performance predicimplementa-tion can be accomplished through the performance models.
The software performance engineering to the web service based infrastructure to support Clinical Decision Support System (CDSS) is applied in [13]. System Performance Validation is a mechanism by which the e-commerce systems try n keep up to reach its performance imperatives by employing performance engi-neering procedures at the system development phase. A case study has been presented, which deals with the transformation of the UML models to software execution models to replicate the performance prediction by implying functio-nalities of UML 2.0 for e-commerce systems [14].
Three use case representations are compared by reviewing the use case mod-eling from the viewpoints of its suitability as input to the graphical UI design and are presented in [15]. It provides a tabular representation independent of the user interface style of identifying the use case elements to support User In-terface (UI) design within the framework of Unified Development Process as this provides an alternative notation to specify the behavior of the use case in
[16]. This article sets up a panel to discuss the features needed to extend UML to support system engineering and investigate the advisability and feasibility of the extensions with respect to audience’s opinion as they have diverse engineering system experience. The design and implementation of a prototype web service for performance modeling tools are implemented in a plug and play manner. It is used for analysis by reviewing information about web services and previous works on XML based performance model by demonstrating the experiment re-sult to show the viability of the model [17]. It is interesting to use UML in vari-ous stages of the web services development process. Also, the non-functional requirements also can be modeled using UML. In [18], the authors presented a survey, mapping UML concepts with web services and classify various UML based approaches that are used to model web services.
illu-DOI: 10.4236/jsea.2019.125008 104 Journal of Software Engineering and Applications strated by using a dynamic travel recommended system.
The usage of web widgets has been speedily growing on the mobile devices and desktops. Web widgets give access to the activities, and the details are also accessible from different sources on the web. With the increasing supporting widgets, supervising widgets and looking appropriate widgets becomes tedious. Hence, the behavior of the users is analyzed using the user interfaces. An explo-ratory analysis which is based on the user interfaces of web widgets regarding the workflow analysis and state diagramming techniques were given in [21]. The functional flows to execute the given tasks in every website are being presented in the workflow diagrams, where each of these is built to visually and systemati-cally to study their detailed pattern usage. From the exploratory analysis results, the authors have extended instructions for thorough usefulness and the accessi-ble interface design of web widgets.
To address the high level performance issues from the initial specification of the system which is incomplete and embodies use case and identifies the se-quence of responsibilities which are incomplete is presented in [22]. It also ad-dresses the use of a specification designed primarily for software design. The in-crease in performance and utilization of adaptive user interface by increasing predictability and accuracy to improve satisfaction study is shown in [23]. The results say that accuracy affects the user performance, utilization and satisfaction of adaptive user interface than predictability. A simple, user-friendly tool to evaluate the best applicable design of software performance attributes at design level using a UML diagram to reduce cost is presented in [24].
In the following literature, [25] [26] [27] [28], methodologies are given to generate User Interface from UML models. The objective of the authors is to develop a prototype from UML models that can be coded easily. The goal of these papers is developing functionalities of the system.
Nowadays, developing UML models is not a mandatory activity within the industry, whereas designing GUI is the common industry practice. Our objective is to assess the performance of WA/WS. Methodologies to predict the perfor-mance from UML models are available through the literature. The proposed methodology helps to generate UML models from the user interface.
The following literature, [29]-[35], methodologies to assess the performance from UML models are presented. Performance prediction from GUI is not ad-dressed in the literature. The proposed methodology provides an approach to assess the performance from the given User Interface. Numerical Results related to performance of Amazon are not discussed within the literature to have a comparative study.
ser-Ch. Ram Mohan Reddy et al.
DOI: 10.4236/jsea.2019.125008 105 Journal of Software Engineering and Applications vices. First, developing user interface as a prototype is an industry practice, and moreover, the user interface plays an important role in the implementation and analysis of web services. Second, methodologies are available to predict the per-formance from UML diagrams. Hence, identifying a methodology to transform the user interface design into UML models can ease the prediction process [36]. In this paper, we propose a methodology to transform the user interface de-sign into the activity model. The methodology is illustrated with the help of an Amazon service prototype model. Furthermore, the performance assessment of the model is done using the Activity Based Performance Prediction (ABPP) ap-proach, and the environment is simulated using SMTQA tool.
In this paper, an approach for implementing the user interface model to Ac-tivity model is presented, and the approach is illustrated through an experimen-tal setup of Amazon service. Using Activity models, the performance of Amazon service are assessed and compared with the results of experimental setup. Two types of UML diagrams are used a). Use case diagrams are used to capture the requirements of the Web service application and to derive the services, which are provided by the Web service, b). The activity diagrams represent the Web ser-vice architecture and showing the flow of control from activity to activity of the services.
For performance assessment, we have used a tool SMTQA, which is validated. A simulation tool, Simulation of Multi-Tier Queuing Applications (SMTQA) to predict the performance of software systems is described in [37]. It provides full visualization of model structure, parameters, and output reporting. The tool si-mulates the behavior of the servers with replicas. The performance metrics av-erage response time, avav-erage waiting time, avav-erage service time, the probability of idle server and the probability of dropping of requests are obtained. The tool also supports the probability distributions, exponential, normal and Weibull for obtaining the inter-arrival time between the requests, and the service time re-quired to process the applications.
The structure of the paper is organized as follows. In Section 2, we discuss the basic concepts and the proposed methodology. Section 3 illustrates the algo-rithm for transformation of UI into the activity diagram. The illustration of the methodology is presented using a case study on Amazon service in Section 4. In Section 5, the simulation aspect of the case study is discussed with validated re-sults. Finally, Section 6 concludes the paper and proposes directions for future research.
3. Concepts and Methodology
3.1. Basic Concepts
Web Services: A web service is an independent component that communi-cates with other applications using standard protocols over the network. An example of the general form of Web Services is shown in [38].
sys-DOI: 10.4236/jsea.2019.125008 106 Journal of Software Engineering and Applications tem and the user (actor). In a particular environment, a set of possible sequences and interactions is created between systems and actors. As an example, the use diagram is presented in [35] describes the various interactions between the users, service consumer, service provider and service registry for web applications.
Activity Diagram: An activity diagram is nothing but a flowchart that represents the flow from one activity to another. They are graphical representa-tions of workflows that will show the step by step activities and acrepresenta-tions. It exhi-bits the object flow or flow of control with significance of the conditions and se-quence of flow [39]. An example of an activity diagram that represents the inte-raction between the service consumer, service provider, and service registry is presented in [35]. The activity diagram represented shows the visual flow of tasks in a particular time sequence along with the condition under which they occur. The round angles in the diagram define the process. The process includes operation with one incoming and, at least, one outgoing edge. There can be more than one outgoing edge based on the operation and tagging with guard condition sometimes defining parallelism. The activity diagram shows the inte-raction clearly. The activity diagram is very appropriate for the complex process of server exception flows as it provides a visual description of the alternate paths. Workspace: Workspace is defined as an environment which helps the pro-grammer to work in task duration.
Workflows: Workflows are a series of tasks that are carried out to produce a desirable outcome. It usually involves several procedures, multiple participants, and several stages in an organization. An example of the workflow of Business Process Management is presented in [16].
Main flow: Main flow is the set of paths of sequence flow that originates from an event. For example, it explains the sequence of flow that happens during the placement of online order using mailing address and credit card information.
Sub-flow: Sub flows are data flows that can be reused by other data flows. The parent workflow will trigger the sub-flow, and wait for the sub flow to complete before continuing as shown in [16]. An example of creating a new account for application is the sub flow of the main flow Login activity of an application.
Exception flow: The set of paths of sequence flow that generate from an in-termediate event which is attached to the boundary of activity is an exceptional flow. Example: Initialization Exception explains the flow of how the exception occurred during the initialization handled.
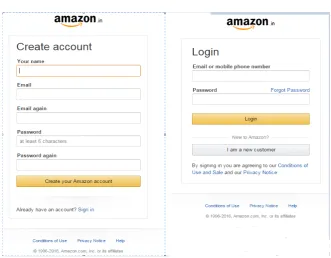
User Interface (UI) elements: The UI elements are the workspaces and func-tional elements. These are required to assist the user and system tasks which perform for each use case. For example, user details will be in workspaces and buttons represent the functional elements. The workspaces are an email address and password whereas functional elements are Sign In using a secure server.
Ch. Ram Mohan Reddy et al.
[image:7.595.207.539.59.317.2]DOI: 10.4236/jsea.2019.125008 107 Journal of Software Engineering and Applications Figure 1. Screenshot of login page of Amazon.com.
3.2. Methodology
The methodology proposed in this paper provides guidelines for generating ac-tivity models from user interfaces with the help of workspaces. As developing user interface prototype is the industry’s normal practice, it is considered as a base for performance assessment. This helps us in perusing activity model from the user point of view. Moreover, assessment of performance in various aspects of software development is supported by the Activity Based Performance Predic-tion (ABPP) approach [6]; this is followed in order to predict the performance. The steps involved in the process are:
1) Consider the prototype of a web service
The prototype defines a model based upon which the system is developed. The prototype defines the physical user interface design of the system. The possible workspaces can be identified from the chosen prototype.
2) Identify User Interface (UI) elements in the selected prototype
UI elements are identified in the form of workspaces and functional elements. For a given prototype, the UI elements are identified which defines the mode of supporting the user tasks and functionalities of the prototype representing the system tasks. Each workspace has one functional element.
3) Generate the UI elements Cluster
DOI: 10.4236/jsea.2019.125008 108 Journal of Software Engineering and Applications 4) Develop the flow diagram of the UI elements
For each UI cluster, identify the functional elements, and in turn, the main flows, sub-flows, and exception flows. For all the UI elements defined in the prototype, develop the flow diagram and understand how the system behaves for the activities mentioned in the flow diagram.
5) Generate the activity model from the flow diagram
Develop the activity model from the flow diagram as follows: Each UI element will become a high level activity of the activity model. By elaborating on the ac-tivities that are implicitly available in the workspace, the low level acac-tivities can be developed. The activity model should have a definite start and end to ensure end-to-end activity.
6) Generate use case model for the functionalities identified from the flow diagram of UI elements
Generate the use case model for each UI element cluster. All the UI elements that represent the main flow of the flow diagram become the primary use cases. The secondary use cases are developed from the UI elements that represent the sub flow and exception flow. The use cases derived from sub flow elements will be related to primary use cases by the relationship includes or uses whereas the use cases derived from exception will be related by extending the relationship. Each use case should describe the single functionality of the service. The use case model should also represent the actors interacting with the functionality represented as a use case.
7) Refine and iterate the developed models
The prototype model defines the concept of refinement of the model, based on either a change in requirement or fault in the design. Hence, the final step in the methodology allows for refinement of the model that has been developed for the identified functionalities either to accommodate new requirements or to consid-er the requirements that wconsid-ere earliconsid-er ignored, based on the priority.
8) Assess the performance of the system using activity based performance prediction approach
Once the refined activity model is obtained, the model will be solved to obtain the response time using the ABPP approach.
9) Solve the system model in SMTQA tool
Simulation of the performance model helps to identify the behavior of the hardware resources as well as the bottleneck resources. The model environment will be simulated using the simulation tool, SMTQA.
4. Algorithm
See Algorithm 1.5. Experimental Study
Ch. Ram Mohan Reddy et al.
DOI: 10.4236/jsea.2019.125008 109 Journal of Software Engineering and Applications Algorithm 1. User interface to activity model.
5.1. Prototype of Amazon Service
To elucidate the proposed methodology, the Amazon.com website is considered, and the algorithm is applied to the module Login for illustration. The prototype of the Login page is presented in Figure 1. The prototype expects the developer to develop an interface for the new user to create an account and for the existing user to login to the secured server of Amazon. After entering into the server, it has to allow the user access to any of the following activities: search for an item, shopping cart, online payment, wish list and such other workspaces and to func-tional elements such as Add to cart, Proceed to checkout, etc. The GUI of the Login page consists of the UI elements: input controls that are available for bet-ter user inbet-teraction with the UI screen and the functional elements, namely, Create Account and Sign in Using Secure Server in the form of buttons.
5.2. Identification of UI Elements for Login
DOI: 10.4236/jsea.2019.125008 110 Journal of Software Engineering and Applications Figure 2. UI element cluster of the login.
The workspace W1 and W2 share space and hence they are overlapped. The functional elements are identified to support user tasks. Based on this informa-tion, the sequential flow of tasks can be represented using the main flow and the flow of tasks for different conditions can be represented using the exception flow diagrams. The sub-flow for the main flow can be created by analysing the UI Element Cluster. This UI Element Cluster is the primary support to identify the performance of the activities for the designers.
5.3. Developing the Flow Diagram
5.3.1. Main Flow
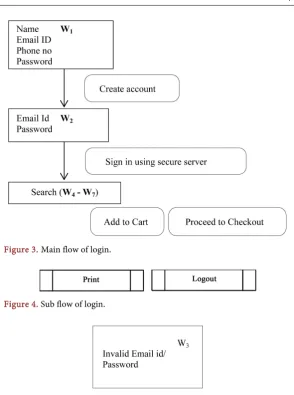
The main flow represents the activities based on time sequence which is sup-ported by the UI elements in the workspace. The first workspace, W1 provides the flexibility to enter the Name, Email id, Phone number and Password for creating an account and similarly W2 for Sign In using a secure server. For any new user, the flow starts with the functional element Create account along with the workspace W1.
After creating the account successfully, the control goes to workspace W2 that shows the data to be provided by the user to login, i.e., Email-id and password. If Email-id and password are correct, then it enters in a secure server. The UI ele-ment represents the secure server, and it consists of four workspaces (W4 - W7) with corresponding functional elements. This UI element shows the functionali-ties accessible while entering into the system. The main flow of “Login”, derived from Figure 10 is presented in Figure 3.
5.3.2. Sub Flows
The identified sub flow events are print and log out. These sub flows are used to print the details of the content page and to exit from the web page respectively, and they are presented in Figure 4.
5.3.3. Exception Flow
Ch. Ram Mohan Reddy et al.
[image:11.595.225.520.52.448.2]DOI: 10.4236/jsea.2019.125008 111 Journal of Software Engineering and Applications Figure 3. Main flow of login.
Figure 4. Sub flow of login.
Figure 5. Exception flow of login.
the control goes to W3 instead of W2. The exception flow represents the activity supported by workspace W3.
5.3.4. Generation of Activity Model
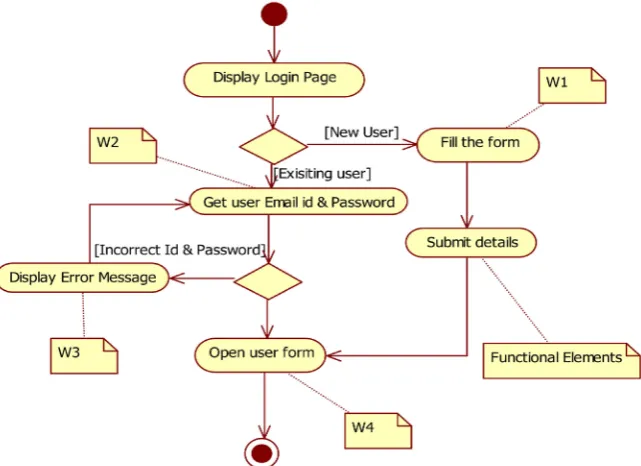
DOI: 10.4236/jsea.2019.125008 112 Journal of Software Engineering and Applications Figure 6. High level activity model for login.
Figure 7. Detailed activity model for login.
Ch. Ram Mohan Reddy et al.
DOI: 10.4236/jsea.2019.125008 113 Journal of Software Engineering and Applications workspace W2 and with functional element Sign In button. If the authentication fails, then he has to re-enter the details. The incorrect id/password is workspace W3. The workspace W4 is open user form which contains other workspaces like the Search for an item, Shopping cart, Online payment, Wishlist, etc. with the functional elements.
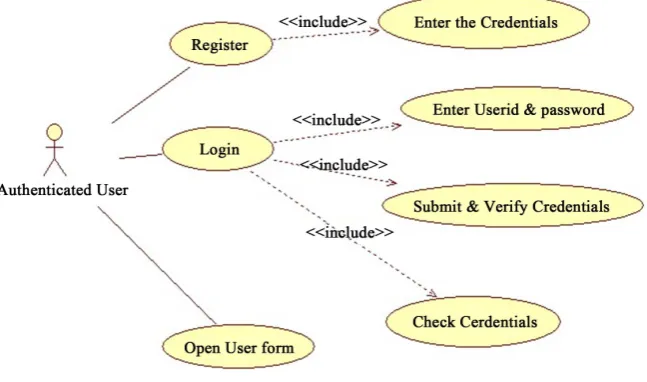
5.3.5. Use Case Diagram
The use case diagram for Login is shown in Figure 8. A single actor (user) inte-racts with the system. For a new user, the user should enter the credentials and then the system redirects the user to the web page. If it is an already existing us-er, the user enters and submits his/her Username and password. The System va-lidates and authenticates the user Information. The System re-directs the user to the web page.
The UI Elements and Activity models for the remaining web pages of Amazon Service, such as Search, shopping cart, online payment, and Wishlist are ob-tained in a similar way.
5.4. Performance Prediction for Amazon Service
[image:13.595.213.537.520.711.2]The methodology, Activity-Based Performance Prediction (ABPP) for Software Systems is applied to estimate the response time of the activities in Web Appli-cations (WA)/Web Services [6]. Activity based performance prediction for WA/WS is about assessing the response time of each activity involved in the web application/web services, Activity based performance estimation is a method of assessing the performance of software systems, considering the type of the users, activities of the web services, technical factors and environmental factors that are available with feasibility study data or preliminary design phase data. For this activity, models are to be developed. The assessment is based on quantifying the amount of resources (efforts) required to execute each activity in the software system [6].
DOI: 10.4236/jsea.2019.125008 114 Journal of Software Engineering and Applications The technical and environmental factors, the type of users and the activities involved in the software components are useful in categorizing the various types of the software such as they contain the inherent characteristics of the applica-tion. The combinations of rates for technical factors help to represent the cate-gory or complexity of the software systems. For example, the technical factors, namely distributed system, response or throughput performance objectives, complex internal processing and concurrent help to represent the protocols used for communicating between the components of the proposed software or be-tween different software systems to be assessed.
The weighting factor for Actor and weights for activities and the technical factors distributed system includes security features, provides access to third parties help to represent the category and complexity of the proposed software system. For instance, if we consider a web application, the actors may be the us-ers (pus-erson interacting with a GUI or web page). In the case of web services, the actors will be the users as well as the service providers since, in web services, the web service is, in fact communicating with the service providers via, the applica-tion programming interface (API).
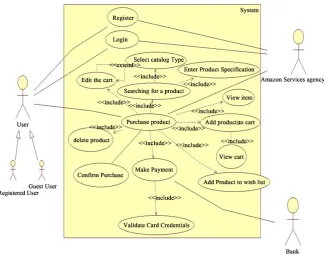
5.4.1. Use Case Model for Amazon
[image:14.595.212.537.450.705.2]The use case diagram of the Amazon Service is shown in Figure 9, with the fol-lowing multiple functionalities: Registering and login to the Amazon Web site, Searching for a product of interest, Viewing the details of the product, Adding the product to cart for further purchase, Adding the product to wishlist, Viewing the cart to proceed for payment, Editing the quantity of selected product, Delet-ing the product from cart, ConfirmDelet-ing or CancellDelet-ing the order, MakDelet-ing order.
Ch. Ram Mohan Reddy et al.
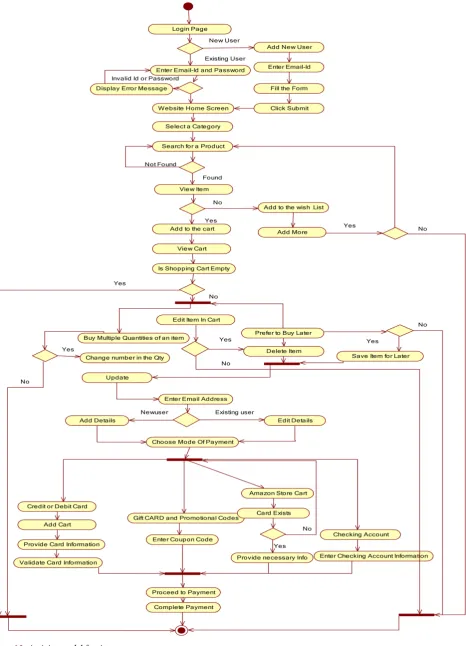
DOI: 10.4236/jsea.2019.125008 115 Journal of Software Engineering and Applications 5.4.2. Activity Model for Amazon
The flow of activities of Amazon Service is presented in the activity diagram as shown in Figure 10. The customer logs into the Amazon website with his Email Id and password. When the home screen is displayed, the customer selects the category of the product and searches for the product. Once the customer views the product features, it is either added to the cart or the wish list. The customer can also edit the item in the cart by changing the quantity of the product or de-lete the item in it. The product is placed for order by providing the delivery ad-dress and other required details. There are various ways of payment made for the product purchase like Credit or Debit Card, Gift card, Cash on Delivery, etc.
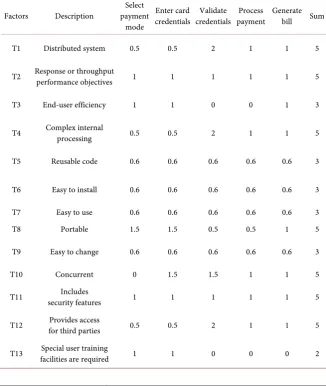
5.4.3. Estimation of Response Time Using Activity Point Calculation For illustration purpose, the ABPP methodology is applied to the activities of the use case payment. The rates for the technical and environmental factors of the activities involved in the payment use case are shown in Table 1 and Table 2
[image:15.595.209.536.351.738.2]respectively. The size of the use cases and the corresponding response time are estimated using the ABPP approach [6], and the results are tabulated in Table 3.
Table 1. Technical factors for activities involved in payment use case.
Factors Description payment Select mode
Enter card
credentials credentials Validate payment Process Generate bill Sum
T1 Distributed system 0.5 0.5 2 1 1 5
T2 Response or throughput performance objectives 1 1 1 1 1 5
T3 End-user efficiency 1 1 0 0 1 3
T4 Complex internal processing 0.5 0.5 2 1 1 5
T5 Reusable code 0.6 0.6 0.6 0.6 0.6 3
T6 Easy to install 0.6 0.6 0.6 0.6 0.6 3
T7 Easy to use 0.6 0.6 0.6 0.6 0.6 3 T8 Portable 1.5 1.5 0.5 0.5 1 5
T9 Easy to change 0.6 0.6 0.6 0.6 0.6 3
T10 Concurrent 0 1.5 1.5 1 1 5
T11 security features Includes 1 1 1 1 1 5
T12 for third parties Provides access 0.5 0.5 2 1 1 5
Ch. Ram Mohan Reddy et al.
[image:17.595.208.539.92.286.2]DOI: 10.4236/jsea.2019.125008 117 Journal of Software Engineering and Applications Table 2. Environmental factors for activities involved in payment use case.
Factors Description payment Select mode
Enter card
credentials credentials Validate payment Process Generate bill Sum
E1 Familiar with Rational Unified Process 0.6 0.6 0.6 0.6 0.6 3
E2 Application experience 0.6 0.6 0.6 0.6 0.6 3 E3 Object-oriented experience 0.6 0.6 0.6 0.6 0.6 3 E4 Lead analyst capability 0.4 0.4 0.4 0.4 0.4 2 E5 Motivation 0.6 0.6 0.6 0.6 0.6 3 E6 Stable requirements 0.6 0.6 0.6 0.6 0.6 3 E7 Part – time workers 0 0 0 0 0 0
E8 programming language Difficult 0.6 0.6 0.6 0.6 0.6 3
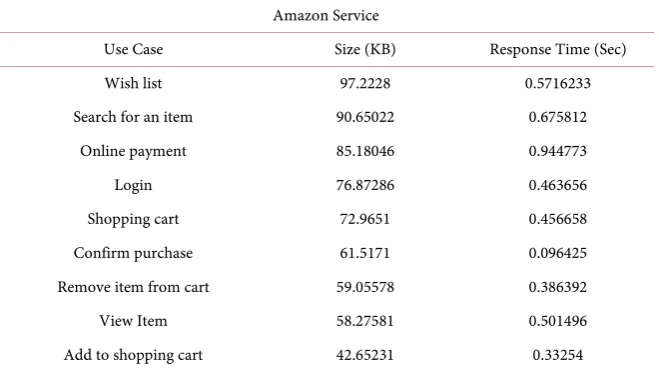
Table 3. Size and response time of use cases.
Amazon Service
Use Case Size (KB) Response Time (Sec) Wish list 97.2228 0.5716233 Search for an item 90.65022 0.675812
Online payment 85.18046 0.944773
Login 76.87286 0.463656
Shopping cart 72.9651 0.456658 Confirm purchase 61.5171 0.096425 Remove item from cart 59.05578 0.386392 View Item 58.27581 0.501496 Add to shopping cart 42.65231 0.33254
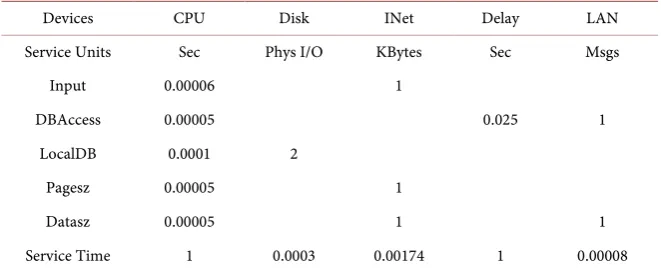
The overhead matrix representing the resource usage used for the calculation of the response time is given in Table 4. If we consider Amazon as a web applica-tion, the request will be given by a human user and the authentication is done by the user. In case, the request is received by Amazon from another program or website, the user is a program, and the authentication is verified for that pro-gram and the communication between both the propro-grams is done through Ap-plication Programming Interface (API).
From Table 3, it can be observed that the response time of the use cases is not proportional to the size, and that is due to the varying processing speed of the hardware resources.
5.4.4. Simulation Results
[image:17.595.211.541.319.504.2]DOI: 10.4236/jsea.2019.125008 118 Journal of Software Engineering and Applications Table 4. Overhead matrix/processing speed of the hardware resources.
Devices CPU Disk INet Delay LAN Service Units Sec Phys I/O KBytes Sec Msgs
Input 0.00006 1
DBAccess 0.00005 0.025 1
LocalDB 0.0001 2
Pagesz 0.00005 1
Datasz 0.00005 1 1
Service Time 1 0.0003 0.00174 1 0.00008
helps to identify the bottleneck resources. Hence, the simulation is carried out using the simulation tool, SMTQA to obtain the performance metrics taking into consideration the overhead matrix given in Table 4 [40]. The five parameters of SPE approach, namely performance goal, workload specification, software ex-ecution structure, exex-ecution environment, and resource usage are supported by the tool. The tool helps to generate the arrival rate of the requests using the probability distribution. It also facilitates to get the size of activities to be ex-ecuted by the user as the workload for the system which is one of the five para-meters of the SPE approach. As a further simplification, the activities involved in the Login use case are considered for simulation. The size of the activities that are given in Table 3 is used as the input workload for the simulation. The arrival rate of the requests is considered as 0.05 following an exponential distribution. The flow of activities can be given in the tool to specify the software execution structure. The performance metrics obtained in the simulation are presented in
Table 5. The observations that are made from the values of the performance metrics are:
The average waiting time and the probability of the dropping of sessions on the internet are 0.005 seconds and 0.007 respectively.
The average waiting time and the probability of dropping of sessions in dbdisk are 0.023 seconds and 0.155 seconds respectively.
It is due to the low processing speed of Internet and dbdisk. As a conse-quence of dropping more requests in dbdisk, the robability of idle for other hardware resources are closer to 1.
5.4.5. Sensitivity Analysis
To identify the behavior of the hardware resources, sensitivity analysis is carried out. To improve the performance of the dbcpu, its processing speed is increased to 50 access/sec. The improved results are given in Table 6. The average re-sponse time is reduced from 0.099 to 0.071. Moreover, the dropping of sessions also is reduced from 0.155 to 0.059.
Ch. Ram Mohan Reddy et al.
[image:19.595.58.540.89.253.2]DOI: 10.4236/jsea.2019.125008 119 Journal of Software Engineering and Applications Table 5. Performance metrics of Internet speed 575 KBps with Arrival distribution is 0.05; dbdisk is 40.
S. No Layer name distribution Arrival Processing speed Response time Average Service Time Average waiting Time Average Probability of Idle server dropping sessions Probability of
1 Client 0.05 17000 0.001 0.001 0.000 0.988 0.000
2 Internet 575 0.026 0.021 0.005 0.661 0.007
3 WS-wscpu 20000 0.001 0.001 0.000 0.991 0.000 4 WS-wsdbcpu 10000 0.001 0.001 0.000 0.991 0.000 5 WS-wsdbdisk 3333 0.001 0.001 0.000 0.996 0.000
6 LAN 12500 0.001 0.001 0.000 0.995 0.000
7 Database-Dbcpu 20000 0.000 0.000 0.000 0.994 0.000
[image:19.595.64.539.285.449.2]8 dbdisk 40 0.099 0.077 0.023 0.457 0.155
Table 6. Performance metrics of Internet speed 575 KBps with Arrival distribution is 0.05; dbdisk is 50.
S. No. Layer name distribution Arrival Processing speed Response time Average Service Time Average waiting Time Average of Idle server Probability dropping sessions Probability of
1 Client 0.05 17,000 0.001 0.001 0.000 0.991 0.000
2 Internet 575 0.023 0.020 0.003 0.746 0.000
3 WS-wscpu 20,000 0.001 0.001 0.000 0.993 0.000 4 WS-wsdbcpu 10,000 0.001 0.001 0.000 0.995 0.000 5 WS-wsdbdisk 3333 0.001 0.001 0.000 0.997 0.000
6 LAN 12,500 0.467 0.001 0.466 0.996 0.426
7 Database-Dbcpu 20,000 0.000 0.000 0.000 0.995 0.000
8 Dbdisk 50 0.071 0.060 0.011 0.616 0.059
Table 7. Performance metrics of Internet speed 575 KBps with Arrival distribution is 0.01; dbdisk is 40.
S. No Layer name distribution Arrival Processing speed Response time Average Service Time Average waiting Time Average of Idle server Probability dropping sessions Probability of
1 Client 0.01 17,000 0.001 0.001 0.000 0.962 0.000
2 Internet 575 0.042 0.020 0.021 0.085 0.261
3 WS-wscpu 20,000 0.001 0.001 0.000 0.971 0.000 4 WS-wsdbcpu 10,000 0.001 0.001 0.000 0.978 0.000 5 WS-wsdbdisk 3333 0.001 0.001 0.000 0.988 0.000
6 LAN 12,500 0.121 0.001 0.120 0.984 0.247
7 Database-Dbcpu 20,000 0.000 0.000 0.000 0.974 0.000
8 Dbdisk 40 0.132 0.078 0.054 0.011 0.669
[image:19.595.66.538.483.651.2]DOI: 10.4236/jsea.2019.125008 120 Journal of Software Engineering and Applications The results are observed by changing the processing speed of dbdisk and pre-sented in Table 8. From the results, we can observe that the probability of drop-ping of sessions in dbdisk, LAN, and the internet is reduced compared to the earlier configuration. But still, it is 0.606 in the case of dbdisk, i.e., the higher value. This might be the consequence of high processing speed of dbcpu where the average response time is 0, and the probability of idle server is 0.975. Hence, we have decided to reduce the processing speed of dbcpu and increase the speed of dbdisk. The obtained performance matrix for the updated configuration is presented in Table 9. The probability of sessions in dbdisk is reduced. However, it still is 0.563, and as a result, the probability of dropping sessions on the Inter-net is increased to 0.338. Hence, the processing speed of both the hardware re-sources is improved, and the results are given in Table 10.
[image:20.595.66.537.372.539.2]The graphs generated for the performance metrics tabulated in Table 10 are presented in figures, from Figures 11-15. From Figure 11, it is observed that the response time of Client CPU is gradually increasing up to the arrival rate of 50 and after that, it is fluctuating. The response time of Internet as given in Figure 12 increases gradually up to arrival rate of 50 and fluctuating up to 75, and up-ward of that, it remains constant.
Table 8. Performance metrics of internet speed 575 KBps with arrival distribution is 0.01; dbdisk is 50.
S. No Layer name distribution Arrival Processing speed Response time Average Service Time Average waiting Time Average Probability of Idle server dropping sessions Probability of
1 Client 0.01 17,000 0.001 0.001 0.000 0.963 0.000
2 Internet 575 0.041 0.020 0.020 0.106 0.240
3 WS-wscpu 20,000 0.001 0.001 0.000 0.972 0.000 4 WS-wsdbcpu 10,000 0.001 0.001 0.000 0.978 0.000 5 WS-wsdbdisk 3333 0.001 0.001 0.000 0.989 0.000
6 LAN 12,500 0.134 0.001 0.133 0.985 0.379
7 Database-Dbcpu 20,000 0.000 0.000 0.000 0.975 0.000
8 Dbdisk 50 0.094 0.058 0.036 0.044 0.606
Table 9. Performance metrics of internet speed 575 KBps with arrival distribution is 0.01; dbdisk is 50, dbcpu 15,000.
S. No Layer name distribution Arrival Processing speed Response time Average Service Time Average waiting Time Average of Idle server Probability dropping sessions Probability of
1 Client 0.01 17,000 0.001 0.001 0.000 0.959 0.000
2 Internet 575 0.046 0.021 0.025 0.056 0.338
3 WS-wscpu 20,000 0.001 0.001 0.000 0.968 0.000
4 WS-wsdbcpu 10000 0.001 0.001 0.000 0.966 0.000
5 WS-wsdbdisk 3333 0.001 0.001 0.000 0.982 0.000
6 LAN 12,500 0.001 0.001 0.000 0.973 0.000
7 Database-Dbcpu 15,000 0.001 0.001 0.000 0.975 0.000
[image:20.595.56.538.570.738.2]Ch. Ram Mohan Reddy et al.
[image:21.595.51.540.57.715.2]DOI: 10.4236/jsea.2019.125008 121 Journal of Software Engineering and Applications Table 10. Performance metrics of internet speed 675 KBps with arrival distribution is 0.01; dbdisk is 75, dbcpu 15,000.
S. No. Layer name distribution Arrival Processing speed Response time Average Service Time Average waiting Time Average of Idle server Probability dropping sessions Probability of
1 Client 0.01 17,000 0.001 0.001 0.000 0.958 0.000
2 Internet 675 0.036 0.018 0.017 0.110 0.260
3 WS-wscpu 20,000 0.001 0.001 0.000 0.966 0.000
4 WS-wsdbcpu 10,000 0.001 0.001 0.000 0.966 0.000
5 WS-wsdbdisk 3333 0.001 0.001 0.000 0.982 0.000
6 LAN 12,500 0.001 0.001 0.000 0.984 0.000
7 Database-Dbcpu 15,000 0.001 0.001 0.000 0.967 0.000
[image:21.595.167.533.91.485.2]8 dbdisk 75 0.062 0.040 0.022 0.104 0.439
Figure 11. Client CPU-average response time vs. arrival time.
[image:21.595.234.516.518.707.2]DOI: 10.4236/jsea.2019.125008 122 Journal of Software Engineering and Applications Figure 13. WScpu-average response time vs. Arrival time.
Figure 14. WSdbcpu-average response time vs. arrival time.
[image:22.595.234.514.519.706.2]Ch. Ram Mohan Reddy et al.
DOI: 10.4236/jsea.2019.125008 123 Journal of Software Engineering and Applications But, the response time of WScpu observed in Figure 13 gradually reduces up to the arrival rate of 50 and then it starts fluctuating, higher than the initial re-sponse time. This is a consequence of low processing speed of the Internet. It is interesting to note that similar behaviour can be observed in WSdbcpu, which is presented in Figure 14. Figure 15 shows that the response time is constant throughout the simulation.
6. Conclusion
Developing graphical user interface as a prototype is an industry practice. Most of the performance prediction methodologies use UML models as performance models. Hence, in this paper, we have presented a mechanism to transform the user interface into UML activity models using workspaces. The approach is illu-strated with the Amazon web service prototype model. The response time of ac-tivities is estimated using the ABPP approach. Moreover, performance models are obtained by simulation using SMTQA and simulation is carried out to obtain the performance metrics, average response time, average waiting time, the probability of idle server and probability of dropping of sessions. The sensitivity analysis is carried out to identify the suitable configuration for capacity plan-ning.
Significance Statement
This paper presents a methodology to transform the user interfaces to activity models using workflows and functional elements and to improve the perfor-mance in higher utilization of the behaviour of WA/WS. This approach gives a new support who wants to assess the performance from the given User interface.
Acknowledgements
I wish to express my heartfelt and deep debt of gratitude to my dissertation ad-visor, Prof. Dr. T V Suresh Kumar and Dr. D. Evangelin Geetha, Ramaiah Insti-tute of Technology, for devoting their precious time and knowledge throughout this work. They gave me excellent professional guidance and valuable advice on the subject matter of my work. Also I would like to extend my sincere thanks to MR. R.V. Raghavendra Rao for his effort to this work.
Conflicts of Interest
The authors declare no conflicts of interest regarding the publication of this pa-per.
References
[1] Ferris, C. and Farrell, J.A. (2001) What Are Web Services? Communications of the ACM, 46, 31. https://doi.org/10.1145/777313.777335
DOI: 10.4236/jsea.2019.125008 124 Journal of Software Engineering and Applications Management, 12, 554-564. https://doi.org/10.1109/TNSM.2015.2499265
[3] Liu, X. and Fulia, I. (2015) Incorporating User, Topic, and Service Related Latent Factors into Web Service Recommendation. 2015 IEEE International Conference on Web Services, New York, 27 June-2 July 2015, 185-192.
https://doi.org/10.1109/ICWS.2015.34
[4] Badr, Y., Abraham, A., Biennier, F. and Grosan, C. (2008) Enhancing Web Service Selection by User Preferences of Non-Functional Features. 4th International Con-ference on Next Generation Web Services Practices, Seoul, 20-22 October 2008, 60-65. https://doi.org/10.1109/NWeSP.2008.39
[5] Arlow, J. and Neustadt, I. (2005) UML 2 and the Unified Process. 2nd Edition, Ad-dison-Wesley,Boston, MA.
[6] Reddy, C.R.M., Evangelin Geetha, D., Kumar, T.V.S. and Rajani Kanth, K. (2015) Activity Based Performance Prediction for Software Systems. Technical Report, Department of Computer Applications, M. S. Ramaiah Institute of Technology, Bangalore.
[7] Collins, D. (1995) Designing Object-Oriented User Interfaces. Benjamin/Cummings Publishing Company, Redwood City,CA.
[8] Farooq, M.U. and Dominick, W.D. (1998) A Survey of Formal Tools and Models for Developing User Interfaces. International Journal of Man-Machine Studies, 29, 479-496. https://doi.org/10.1016/S0020-7373(88)80007-5
[9] Guindon, R. (1990) Designing the Design Process: Exploiting Opportunistic Thoughts. Human-Computer Interaction, 5, 305-344.
https://doi.org/10.1207/s15327051hci0502&3_6
[10] Kemp, E.A. and Phillips, C.H.E. (1998) Extending Support for User Interface De-sign in Object-Oriented Software Engineering Methods. Proceedings of HCI’98, Sheffield, September 1998, 96-97.
[11] Smith, C.U. and Williams, L.G. (1993) Software Performance Engineering: A Case Study Including Performance Comparison with Design Alternatives. IEEE Transac-tions on Software Engineering, 19, 720-741.
https://doi.org/10.1109/32.238572
[12] Smith, C.U. and Williams, L.G. (2000) Building Responsive and Scalable Web Ap-plications. Research Report, Software Engineering Research and L&S Computer Technology, Inc.
[13] Catley, C., Petriu, D.C. and Frize, M. (2004) Software Performance Engineering of a Web Service-Based Clinical Decision Support Infrastructure. In: Proceedings of the
4th International Workshop on Software and Performance, ACM, New York, 130-138.
[14] Geetha, D.E., Reddy, C.R.M., Kumar, T.V.S. and Kanth, K.R. (2007) Performance Modeling and Evaluation of e-Commerce Systems Using UML 2.0. 8th ACIS Inter-national Conference on Software Engineering, Artificial Intelligence, Networking,
and Parallel/Distributed Computing, Qingdao, 30 July-1 August 2007, 1135-1140.
https://doi.org/10.1109/SNPD.2007.535
[15] Phillips, C., Kemp, E. and Kek, S.M. (2001) Extending UML Use Case Modelling to Support Graphical User Interface Design. Proceedings 2001 Australian Software EngineeringConference, Canberra, 27-28 August 2001, 48-57.
https://doi.org/10.1109/ASWEC.2001.948497
Ch. Ram Mohan Reddy et al.
DOI: 10.4236/jsea.2019.125008 125 Journal of Software Engineering and Applications
AL, 7-10 April 2003, 1-3.
[17] Lladó, C.M., Puigjaner, R. and Smith, C.U. (2005) A Performance Model Web Ser-vice.
[18] Reddy, C.R.M., Rao, R.V.R., Geetha, D.E., Kumar, T.V.S. and Kanth, K.R. (2014) Survey on UML Based Modeling for Web Services. NCSE’14 Conference Proceed-ings. International Journal of Engineering Research & Technology, 57-65.
[19] Bolloju, N. and Sun, S.X.Y. (2012) Benefits of Supplementing Use Case Narratives with Activity Diagrams—An Exploratory Study. Journal of Systems and Software, 85, 2182-2191.https://doi.org/10.1016/j.jss.2012.04.076
[20] Lai, C.-Y., Shih, D.-H., Chiang, H.-S. and Chen, C.-C. (2010) A Study of Informa-tion Systems Model for Activity Diagram Analysis. Recent Advances in Business Administration, 104-109.
[21] Han, M. and Park, P. (2009) A Study of Interface Design for Widgets in Web Ser-vices through Usability Evaluation. In: Proceedings of the 2nd International Confe-rence on Interaction Sciences: Information Technology and Human Culture, ACM Digital Library, New York, 1013-1018.https://doi.org/10.1145/1655925.1656109
[22] Petriu, D. and Woodside, M. (2002) Analysing Software Requirements Specifica-tions for Performance. In: Proceedings of the 3rd International Workshop on Soft-ware and Performance, ACM Digital Library, New York, 1-9.
https://doi.org/10.1145/584370.584371
[23] Gajos, K.Z., Everitt, K., Tan, D.S., Czerwinski, M. and Weld, D.S. (2008) Predicta-bility and Accuracy in Adaptive User Interfaces. In: Proceedings of the SIGCHI Conference on Human Factors in Computing Systems, ACM Digital Library, New York, 1271-1274. https://doi.org/10.1145/1357054.1357252
[24] Bharathi, B. and Kulanthaivel, G. (2011) Towards Developing a Performance Eva-luator for Component Based Software Architectures. Indian Journal of Computer Science and Engineering, 2, 136-142.
[25] Kovacevic, S. (1999) UML and User Interface Modeling. In: Bézivin, J. and Muller, P.A., Eds., The Unified Modeling Language. UML’98: Beyond the Notation. UML
1998. Lecture Notes in Computer Science, Springer, Berlin, Heidelberg.
https://doi.org/10.1007/978-3-540-48480-6_20
[26] Tick, J. (2005) Software User Interface Modelling with UML Support. 3rd Interna-tional Conference on ComputaInterna-tional Cybernetics, 2005. Mauritius, 13-16 April 2005, 325-328.
[27] Elberkawi, E.K. and Elammari, M.M. (2015) Producing Graphical User Interface from Activity Diagrams. International Journal of Computer and Information Engi-neering, 9, 667-672.
[28] Shatnawi, A. and Shatnawi, R. (2016) Generating a Language-Independent Graphi-cal User Interfaces from UML Models. The International Arab Journal of Informa-tion Technology, 13, 291-296.
[29] Cortellessa, V. and Mirandola, R. (2000) Deriving a Queueing Network Based Per-formance Model from UML Diagrams. In: Proceedings of the 2nd International Workshop on Software and Performance, ACM Digital Library, New York, 58-70.
https://doi.org/10.1145/350391.350406
[30] Alsaadi, A. (2004) A Performance Analysis Approach Based on the UML Class Dia-gram. In: Proceedings of the 4th International Workshop on Software and Perfor-mance, ACM Digital Library, New York, 254-260.
DOI: 10.4236/jsea.2019.125008 126 Journal of Software Engineering and Applications
[31] Youn, H., Jang, S. and Lee, E. (2007) Deriving Queuing Network Model for UML for Software Performance Prediction. 5th International Conference on Software Engineering Research, Managementand Applications, Busan, 20-22 August 2007, 125-131. https://doi.org/10.1109/SERA.2007.70
[32] Jasmine, K.S. and Vasantha, R. (2009) Derivation of UML Based Performance Mod-els for Design Assessment in a Reuse Based Software Development Approach.
Anale: SeriaInformatică, 7,163-180.
[33] Becker, S., Koziolek, H. and Reussner, R. (2009) The Palladio Component Model for Model-Driven Performance Prediction. Journal of Systems and Software, 82, 3-22.
https://doi.org/10.1016/j.jss.2008.03.066
[34] Jagannatha, S., Vijaya, S. and Reddy, P. (2012) Simulation and Analysis of Perfor-mance Prediction in Distributed Database Design Using OO Approach. 2013 3rd IEEE International Advance Computing Conference, Ghaziabad, 22-23 February 2013, 1324-1329. https://doi.org/10.1109/IAdCC.2013.6514420
[35] Reddy, C.R.M., Geetha, D.E., Srinivasa, K.G., Kumar, T.V.S. and Kanth, K.R. (2011) Prototype Based Performance Prediction of Web Services. In: Nagamalai, D., Re-nault, E. and Dhanuskodi, M., Eds., Advances in Digital Image Processing and In-formation Technology. Communications in Computer and Information Science, Springer, Berlin, Heidelberg, 346-354.
https://doi.org/10.1007/978-3-642-24055-3_35
[36] Geetha, D.E., Kumar, T.V.S., Singh, M.P. and Kanth, K.R. (2014) Simulation of Multi-Tier Queuing Applications. Technical Report. Department of Computer Ap-plications, M. S. Ramaiah Institute of Technology, Bangalore.
[37] Guruge, A. (2004) Web Services: Theory and Practice. Digital Press.
[38] Reddy, C.R.M., Geetha, D.E., Srinivasa, K.G., Kumar, T.V.S. and Kanth, K.R. (2011) Early Performance Prediction of Web Services. International Journal on Web Ser-vice Computing, 2, 31-41. https://doi.org/10.5121/ijwsc.2011.2303
[39] Unified Modeling Language (2015) http://www.uml.org/
[40] Evangelin, G.D., Kumar, T.V.S. and Kanth, K.R. (2011) Predicting the Software Performance during Feasibility Study. IETSoftware, 5, 201-215.