O R I G I N A L A R T I C L E
Long-term soil accumulation of potentially toxic elements
and selected organic pollutants through application
of recycled phosphorus fertilizers for organic farming
conditions
Lina Weissengruber .Kurt Mo¨ller .Markus Puschenreiter.Ju¨rgen K. Friedel
Received: 22 March 2017 / Accepted: 14 January 2018 / Published online: 25 January 2018 The Author(s) 2018. This article is an open access publication
Abstract The pollutant input and the risk of con-tamination by long-term application of recycled P fertilizers (RPFs) in European agricultural soils were estimated by a mass balance approach. Calculations based on literature data were carried out for the potentially toxic elements (PTEs) Cd, Cr, Cu, Ni, Pb, Zn and for the persistent organic pollutants (POPs) PCBs, PAHs and polychlorinated dibenzo-dioxins and -furans. The PTE accumulation estimation during 200 years of fertilizer application, equivalent to 11 kg P ha-1year-1, the mean P export via harvested products on European stockless organic farms,
regarded soil background concentrations and proposed threshold concentrations. For PTEs, inputs were fertilizer application, atmospheric deposition and liming, output processes were leaching and crop harvest. The effect of varying site conditions was assessed by considering two precipitation excess (F) values and two soil pH values. For POPs, fertilizer application and the half-life time were considered. The PTE accumulation risk was low for most RPFs. For the analysed POPs no accumulation was found. The highest accumulation was found for all PTEs at pH 7 and F=0.1 m year-1, the lowest at pH 5 and F =0.3 m year-1. A high P concentration in fertiliz-ers resulted in a low PTE flow per unit of P. Composts had the highest PTE accumulation risk due to lowest P contents. Struvite, meat and bone meal, digestate of catering waste, ash and biosolids would be better suited as P fertilizers. The use of fertilizers should be regulated based on their pollutant-to-nutrient ratio. Keywords Risk assessmentHeavy metals
Persistent organic pollutantsPhosphorus recycling
Pollutant-to-nutrient ratioCadmium
Introduction
Phosphorus (P) is an essential element for all living organisms and food production, but it is not treated sustainably in Europe. Through fertilization it ends up L. WeissengruberJ. K. Friedel (&)
Department of Sustainable Agricultural Systems, University of Natural Resources and Life Sciences Vienna, Gregor Mendel Straße 33, 1180 Vienna, Austria e-mail: [email protected]
K. Mo¨ller
Institute of Crop Science, Fertilization and Soil Matter Dynamics, University of Hohenheim, Fruwirthstraße 20, 70593 Stuttgart, Germany
Present Address:
K. Mo¨ller
Center for Agricultural Technology Augustenberg, Institute of Applied Crop Science, Kutschenweg 20, 76287 Rheinstet-ten-Forchheim, Germany
M. Puschenreiter
Department of Forest and Soil Sciences, University of Natural Resources and Life Sciences Vienna, Peter-Jordan-Straße 82, 1190 Vienna, Austria
in surface water bodies or it is irretrievably lost by co-incineration in municipal solid waste incinerators, power plants or cement kilns (Egle et al.2015,2016). At the current rate of extraction, phosphate rock reserves could peak in 2033 (Cordell and White2011) and will be exhausted in the next few centuries (Elser
2012; Desmidt et al.2014). This demonstrates that the reliance on non-renewable P sources for production of P fertilizers directly contradicts both the principles of sustainable development and the principle of care in organic farming (IFOAM 2017). Furthermore, phos-phate rock sources are increasingly polluted with cadmium (Cd), thallium and the radioactive elements uranium and thorium (Egle et al.2016). Therefore, we need a more efficient and sustainable P recycling within our societies.
The P status of long-term organically managed farms is currently becoming an issue of increasing concern (Nesme et al.2012; Kolbe2015). Phosphorus balances for organically managed arable cropping systems indicate that often more P is removed with the products than recycled via external inputs (Watson et al.2002; Berry et al.2003; Kolbe2015; Ohm et al.
2017), leading to decreasing soil status in plant available soil P (Løes and Ogaard 1997; Kolbe
2015) which threatens the long-term sustainability of organic farming systems. Moreover, P shortage may also limit other processes such as symbiotic N2
fixation (Ro¨mer and Lehne 2004; Oberson et al.
2013) that have a direct impact on the farm nitrogen cycle and on yields. Therefore, outbalancing P removals via exported products and appropriate P fertilization is a major challenge in the organic farming sector for preservation of the long-term soil fertility. According to the principles of organic farming, non-renewable inputs should be reduced by reuse, recycling and efficient management of materials and energy in order to maintain and improve environ-mental quality, therefore, organic farming should decrease dependency on phosphate rock.
The most important potential recycling sources of P in our societies are (Ott and Rechtberger2012; Zoboli et al.2016):
• Wastewater based residues.
• Slaughterhouse wastes (e.g. meat and bone meal).
• Urban organic waste.
These P sources, provided an efficient recycling, might replace approximately 50–70% of the current P import from phosphate rock in European societies (Klinglmair et al.2015; Zoboli et al.2016). Koppelaar and Weikard (2013) analyzed the global P flow and found a substantial scope for P use reduction by 32% of phosphate rock supply in 2009, and 28% techno-logically recyclable P from waterways and wastewa-ters, but at high costs. However, any recycling may be hazardous due to the risk of the transfer of potentially toxic elements (PTEs), pathogens and contaminants, which may harm the product quality, the long-term soil fertility and the environment. These concerns for example have led to a ban of sewage sludge based recycled P fertilizers (RPFs) in organic farming in the seventies of last century. There is a huge body of publications addressing the potential consequences of nutrient recycling on soil contamination. Most of the publications address biosolids obtained after stabi-lization and hygienization of wastewaters (Sekhar et al.2002; Herter et al.2003; Udom et al.2004; Dai et al.2006; Eljarrat et al.2008; Nogueira et al.2009; Wu et al.2012; Tavazzi et al.2012), the most relevant potential P source. The loads of PTEs and organic contaminants of composts and digestates obtained from organic household wastes were also an issue of discussion (e.g. Amlinger et al. 2004; Berset and Holzer1995; Bra¨ndli et al.2007a,b; LfU2007; Smith
2009a; Govasmark et al.2011; Mairitsch et al.2011). The two main groups of concern are PTEs and persistent organic pollutants (POPs). Potentially toxic elements may accumulate in the soil and lead to phytotoxic effects reducing the productivity of the soil, or they are taken up by the crops compromising the food quality and animal as well human health (Puschenreiter and Horak2000; Kabata-Pendias2011; de Vries et al.2013). Persistent organic pollutants are substances that persist in the environment and pose a risk of causing adverse effects to human health and the environment. This group of priority pollutants consists of pesticides, industrial chemicals (such as polychlo-rinated biphenyls, PCBs) and unintentional by-prod-ucts of industrial processes (such as dioxins and furans) (EU 2016). Polychlorinated biphenyls are a group of 209 congeners that were used in transformers, sealing compounds, isolators, coolants, flame retar-dants, plasticisers and other applications (Leschber
(PCDFs) 135 congeners, together they are addressed as polychlorinated dibenzo-dioxins and -furans (PCDD/Fs) (Leschber 2006). They are emitted from metal industry, chemical industry, waste combustion plants and illegal waste combustion, in which the purification of waste gases was a big contributor to the reduction of pollution (Herter et al. 2003; Leschber
2006). Polycyclic aromatic hydrocarbons (PAHs) include several hundred congeners and have a wide diversity of physical, chemical and toxicological characteristics. They are found as by-products of incomplete combustion (Leschber2006; Lerda2011). Currently, 80–90% of societal recoverable P sources are not permitted in organic farming due to public or private legislation standards (Løes et al.
2017). The average net P export of the organic sector accounted for approximately 6–7 kg P ha-1year-1 (Kolbe 2015; Cooper et al. 2017). The remaining 10–20% of the societal recoverable P sources, cur-rently permitted in organic farming, will not meet the P needs of the entire organic sector, even assuming that they are exclusively used on organically managed fields. This situation asks for a re-design of the P recycling and P fertilization approach within the organic community. The challenge is to increase the P recycling efficiency without compromising the long-term sustainability by accumulation of harmful sub-stances. A holistic approach should consider the options and consequences of recycling of the major potential societal P sources. Furthermore, it should compare the effects of different potential P recycling sources on long-term soil fertility and soil contami-nation. A re-consideration of the appropriate P recy-cling for organic farming should also consider the products obtained from more advanced treatment technologies of societal organic wastes. For example, in the last two decades several new approaches were developed to treat urban organic household wastes (e.g. by anaerobic digestion instead of composting) or urban wastewaters. The two current main approaches of urban wastewaters treatment are (Herzel et al.
2015b; Egle et al.2016; Kraus et al.2017):
• Chemical approaches resulting in the production of struvite (magnesium ammonium phosphate) or different forms of water- and non water-soluble calcium phosphates.
• Thermal approaches aiming to recover P as ashes (with or without PTE depollution), chars, P-rich
converter slags (CaSiPO4) or calcined phosphates
like ashes (CaNaPO4) among others.
Some methods represent a combination of thermal and chemical approaches (e.g. Leachphos, where ashes are solubilized with acids). The aim of these treat-ments is to reduce the load of contaminants, either by selective P removal (chemical P recovery approaches), or by decontamination of organic contaminants due to the incineration process itself (thermal P recovery approaches). Several methods also reduce the specific PTE loads, e.g. by selective P precipitation, or by volatilization as chlorines at higher incineration temperatures (Kraus and Seis2015).
The objective of this study was to assess the input and to estimate the long-term accumulation risk in European agricultural soils of PTEs and selected POPs related to the annual application of different societal P recycling sources and to assess how decontamination by thermal, chemical or chemico-physical approaches influences the soil accumulation risk of the addressed pollutants, in order to test following hypotheses: 1. The PTE and POP concentrations in fertilizers are
the main factor for their accumulation in soil. 2. The source material and the production process of
RPFs determine their contamination and the risk of PTE and POP accumulation in soil.
3. The regular use of recycled phosphorus fertilizers causes higher soil pollution risks (PTEs and POPs) than that of commonly used fertilizers. 4. The soil and climatic conditions have a minor
relevance on the soil accumulation risk of PTEs.
Materials and methods
Recycled P fertilizers
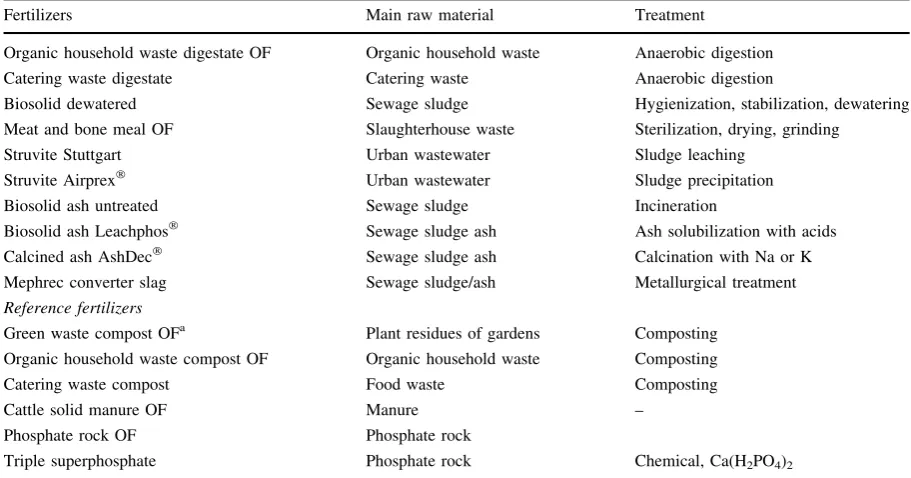
Table 1 Raw material and manufacturing process of fertilizers
Fertilizers Main raw material Treatment
Organic household waste digestate OF Organic household waste Anaerobic digestion
Catering waste digestate Catering waste Anaerobic digestion
Biosolid dewatered Sewage sludge Hygienization, stabilization, dewatering
Meat and bone meal OF Slaughterhouse waste Sterilization, drying, grinding
Struvite Stuttgart Urban wastewater Sludge leaching
Struvite Airprex Urban wastewater Sludge precipitation
Biosolid ash untreated Sewage sludge Incineration
Biosolid ash Leachphos Sewage sludge ash Ash solubilization with acids
Calcined ash AshDec Sewage sludge ash Calcination with Na or K
Mephrec converter slag Sewage sludge/ash Metallurgical treatment
Reference fertilizers
Green waste compost OFa Plant residues of gardens Composting Organic household waste compost OF Organic household waste Composting
Catering waste compost Food waste Composting
Cattle solid manure OF Manure –
Phosphate rock OF Phosphate rock
Triple superphosphate Phosphate rock Chemical, Ca(H2PO4)2
aOFallowed in organic farming according to EU regulation EC 889/2008
Table 2 Mean concentration of potentially toxic elements and phosphorus in fertilizers on a dry weight base (mg kg-1DM)
Cd Cr Ni Pb Cu Zn P References
Organic household waste digestate OF 0.4 19 13 20 49 200 6800 1
Catering waste digestate 0.3 8 9 4 40 177 22,100 1
Biosolid dewatered 1.0 37 29 37 327 937 35,700 3
Meat and bone meal OF 0.2 14 3 3 11 109 53,100 1
Struvite Stuttgart 0.4 14 5 6 19 260 169,630 1, 4, 5
Struvite Airprex 0.3 16 16 60 42 86 91,686 1, 6, 7
Biosolid ash untreated 2.8 96 37 129 875 2479 70,900 7, 5
Biosolid ash Leachphos 2.6 34 14 25 851 1390 131,000 5, 8
Calcined ash AshDec 0.3 127 56 57 441 1710 77,000 5, 8
Mephrec converter slags 0.3 89 14 13 107 69 51,976 8, 9, 10
Green waste compost OF 0.4 23 14 32 34 154 2200 1
Organic household waste compost OF 0.4 22 12 28 41 150 3100 1
Catering waste compost 0.5 28 18 45 54 213 3600 1
Cattle solid manure OF 0.8 28 19 9 32 107 6313 2
Phosphate rock OF 19 152 28 12 17 221 124,431 11
Triple superphosphate 62 229 21 15 15 354 198,653 12
[image:4.547.48.503.386.615.2]considered on a high and a low POP contamination level (Table3).
The following fertilizers are currently allowed for use in organic farming according to EU regulation EC (2008): Green waste composts, organic household waste compost, digestate, meat and bone meal, conventional animal manures and phosphate rock. These fertilizers are indicated in the following text with the additional specification ‘‘OF’’.
The calculations of pollutant inputs and accumula-tion risks were performed for a time span of 200 years of fertilizer application equivalent to 11 kg P ha-1 year-1 (25.2 kg P2O5ha-1year-1), which is an
average P export via crops on European organic arable stockless farms (Lindenthal2000; Berry et al.
2003; Mo¨ller and Stinner2010; Cooper et al.2017). Model description for the risk assessment
of potentially toxic element accumulation in soils The included PTE input routes to soil were atmo-spheric deposition, liming and fertilization. Input of PTEs and their accumulation potential were compared to the current soil pollution (soil background concen-tration) and to proposed soil threshold values.
This study included the elements regulated in the sludge directive (EU Directive 86/278/EEC 1986) except mercury, because it is volatile (Steinnes2013a) and is not covered completely by the model. The assessment of the PTE accumulation risks in European agricultural top soils was based on a mass balance approach applied by Smolders (2013), Six and Smolders (2014) and the European Scientific
Committee on Toxicology, Ecotoxicology and the Environment, CSTEE (2002) for assessing the cad-mium accumulation in European agricultural soils. The model considered the input of pollutants by fertilizer application, atmospheric deposition and liming and the output via leaching, plant uptake and crop removal.
DCsoil¼ INPUTOUTPUT ð1Þ
DCsoil was the change in PTE concentrations in the
plough layer (25 cm) in g ha-1year-1. The concen-tration of PTEs in soil at year i (Csoil iin mg kg-1) was
calculated from the annual net PTE balance (in-put-output in g PTEs ha-1) in yeari-1and soil PTE
concentration in yeari-1as:
Csoil i¼ Csoil i1þ
INPUT OUTPUT
Msoil ð2Þ
For Csoil i-1=PTE concentration in soil in the
previous year (mg kg-1), Input=the annual sum of PTEs in fertilizer, atmospheric deposition and lime (g ha-1), Output =the annual sum of PTEs in leach-ing losses and harvested crop parts (g ha-1), Msoil=
-soil mass in the plough layer (Mg ha-1), The calculation refers to the soil mass Msoilin the plough
layer with a bulk density of 1.3 kg dm3and a depth of 25 cm, which are 3250 Mg ha-1. The PTE content in harvested crop parts in year i (Crop exporti) was
[image:5.547.47.501.496.613.2]calculated as a function of PTE concentration in soil: Crop exporti¼ TF Csoil i1 crop yield ð3Þ
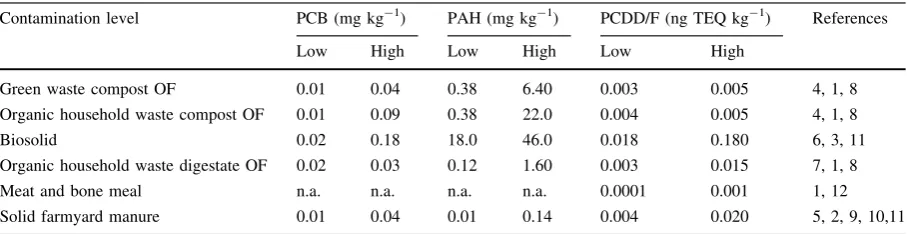
Table 3 Organic pollutant and phosphorus concentration in fertilizer dry weight for two contamination levels
Contamination level PCB (mg kg-1) PAH (mg kg-1) PCDD/F (ng TEQ kg-1) References
Low High Low High Low High
Green waste compost OF 0.01 0.04 0.38 6.40 0.003 0.005 4, 1, 8
Organic household waste compost OF 0.01 0.09 0.38 22.0 0.004 0.005 4, 1, 8
Biosolid 0.02 0.18 18.0 46.0 0.018 0.180 6, 3, 11
Organic household waste digestate OF 0.02 0.03 0.12 1.60 0.003 0.015 7, 1, 8
Meat and bone meal n.a. n.a. n.a. n.a. 0.0001 0.001 1, 12
Solid farmyard manure 0.01 0.04 0.01 0.14 0.004 0.020 5, 2, 9, 10,11
Crop exporti=annual PTE uptake into wheat grain in
year i (g ha-1), TF=transfer factor for wheat grain, Crop yield=average annual yield of wheat grain 3 Mg ha-1.
In order to assess the PTE removal via exported products, the transfer factor for wheat grain (Puschen-reiter and Horak 2000; Lavado et al. 2007) and a continuous cropping of wheat with an average annual yield of 3 Mg ha-1 was assumed. This is a low average wheat yield in organic production (Beckmann et al. 2001) taking into account that ley cropping without nutrient removal are typically part of the crop rotation on organic farms. The average annual yield of 3 Mg ha-1 equals a P export from the field of 11 kg P ha-1year-1 (Stein-Bachinger et al. 2004) and also corresponds to the above-mentioned mean P export in harvested crop parts in stockless organic farms. The transfer factor (TF) is the PTE concentra-tion of an element in the crop divided by the PTE concentration in the soil. The TF values are shown in Table4. Transfer factors for wheat grain were used because it is an important commodity and carbohy-drate source in Europe.
Leaching is the outflow of PTEs dissolved in soil pore water from the topsoil. It is a function of water percolation through the soil—expressed as precipita-tion excess F in m year-1—and the PTE concentration in pore water. To predict the PTE concentration in pore water, a distribution coefficient (KD in L kg-1) was used. KD is a measure for the relative partitioning of an element between the solid phase (Csoil) and the
solution phase (Csolution):
Leachingðg ha1year1Þ ¼Csoil i1=KD
precipitation excess F
10;000
ð4Þ
Csoil i-1=Compound concentration in soil
(mg kg-1), KD=distribution coefficient ((mg kg-1)/ (mg L-1)=L kg-1=dm3kg-1), F=precipitation excess (m year-1), Leaching (mg kg-1/(dm3kg-1) * m year-1* 10,000=mg m-2year-1* 10=g ha-1 year-1).
The KD is the PTE concentration in the solid phase divided by the PTE concentration in the solution phase (Table 4). It varies widely according to pH, clay content, organic carbon, iron content, PTE concentra-tion in soil and—if predicted and not measured—on the empirical regression model. Among these factors, the pH value had the largest effect (Young 2013; Kabata-Pendias2011). Therefore, the mean KD values from literature for pH 5 and for pH 7 were used in this calculation (EPA1999; Sauve´ et al.2000; Hassan and Garrison1996). To calculate the water percolation in the soil, a high rainfall scenario (F=0.3 m year-1) and a low rainfall scenario (F=0.1 m year-1) were calculated. The European average precipitation excess is 0.2 m year-1, in Mediterranean region it can be reduced to 0.05 m year-1and for regions with high rainfall a precipitation excess of 0.3 m year-1 is possible (Smolders2013; Six and Smolders2014).
[image:6.547.45.264.81.321.2]The calculations were based on the soil background concentrations of PTEs already present in the soil. These values for European soils were taken from an European survey (Salminen et al. 2005). The PTE threshold values were taken from a recommendation paper by the Joint Research Centre, the European Commission’’ in-house science service (Gawlik and Bidoglio2006) because no legal European thresholds exist (Table5).
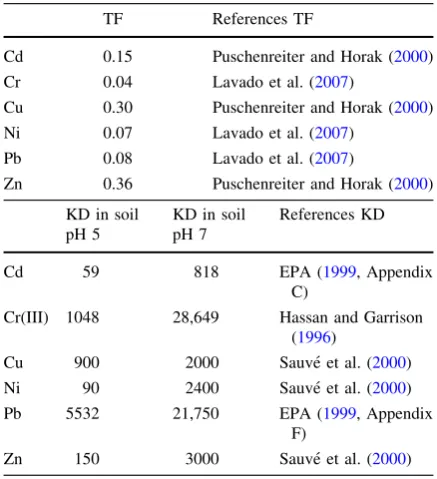
Table 4 Transfer factors (TF) of wheat grain and the parti-tioning coefficients (KD) used in the model
TF References TF
Cd 0.15 Puschenreiter and Horak (2000) Cr 0.04 Lavado et al. (2007)
Cu 0.30 Puschenreiter and Horak (2000) Ni 0.07 Lavado et al. (2007)
Pb 0.08 Lavado et al. (2007)
Zn 0.36 Puschenreiter and Horak (2000)
KD in soil pH 5
KD in soil pH 7
References KD
Cd 59 818 EPA (1999, Appendix
C)
Cr(III) 1048 28,649 Hassan and Garrison (1996)
Cu 900 2000 Sauve´ et al. (2000)
Ni 90 2400 Sauve´ et al. (2000)
Pb 5532 21,750 EPA (1999, Appendix F)
Zn 150 3000 Sauve´ et al. (2000)
Model description for accumulation of persistent organic pollutants in soil
The three groups PAH, PCB and PCDD/F were considered as an example for POPs, because they are still important pollutants in soil and the database for calculations is available. A mass balance model according to Amlinger et al. (2004) was used to assess the accumulation of persistent organic pollutants in soil. Accumulation problems of organics arise, if the persistence of compounds in soil is high (EU 2016). The accumulation was computed with the following iterative formula:
Csoilðmg kg1Þ ¼C0 Xn þððIfþIdÞ=MsoilÞ ðð1XnÞ=ð1XÞÞ
Amlinger et al:2004
ð Þ
ð5Þ
C0=Soil background concentration mg kg-1,
X=eln2=ðT1=2Þ, T=Half-life time of compound in soil in years, n=year of which accumulation is considered, If =Compound input with fertilizer (g ha-1year-1), Id=Compound input with
atmospheric deposition (g ha-1year-1), Msoil =Soil
mass plough horizon (Mg ha-1).
The most critical parameter was the assumed half-life time which is usually determined in lab experi-ments (OECD 2005), and the bibliographical refer-ences vary widely (Table 6). In the calculation, mean values of literature data were used. Also the range of PCB, PAH and PCDD/F content in fertilizers was broad, therefore scenarios with fertilizers of low and high contamination level were calculated as shown in Table 3. Soil guidance values (according to the Austrian threshold values O¨ NORM S2088-2 2004) and soil background concentrations for organic pollu-tants are shown in Table 6. Leaching and plant uptake of POPs were not considered. The assessed POPs—as apolar molecules—are highly bound to the organic matter, reducing their availability to plant roots (Smith
[image:7.547.153.496.58.351.2]2009b) and leaching into groundwater is unlikely (Leschber 2006; Gawlik and Bidoglio 2006; Clarke and Cummins2015; Tavazzi et al.2012).
Table 5 Input of potential toxic elements to soil via atmospheric deposition, lime and fertilizers (referring to
11 kg P ha-1year-1) after 200 years compared to soil background concentration and threshold values
Soil background concentrations and proposed threshold values (aqua regia basis) were converted from mg kg-1to kg ha-1assuming a soil bulk density in the plough horizon (25 cm) of 1.3 g cm-3. 1 Salminen et al. (2005); 2 Gawlik and Bidoglio (2006), 3 Smolders (2013), 4 Eriksen et al. (2009). For
abbreviations and fertilizer references see Tables1and 2
PTE input to soil (kg ha-1) Cd Cr Cu Ni Pb Zn References
Soil background concentration 0.92 106 53.3 100 78 198 1 Proposed threshold values 3.25 244 163 163 228 488 2 Input via atmospheric deposition 0.07 1.85 6.77 1.99 2.38 45.2 3, 4
Input via lime 0.03 0.18 0.27 0.15 0.19 0.40 2
Input via fertilizers
Organic household waste digestate OF 0.13 6.08 15.8 4.06 6.47 64.4 Catering waste digestate 0.03 0.75 3.96 0.94 0.38 17.5 Biosolid dewatered 0.06 2.25 20.1 1.80 2.25 57.5 Meat and bone meal OF 0.01 0.56 0.47 0.14 0.12 4.49 Struvite Stuttgart 0.01 0.18 0.25 0.06 0.08 3.36
Struvite Airprex 0.01 0.39 1.01 0.38 1.44 2.05
Biosolid ash untreated 0.09 2.95 27.0 1.16 3.98 76.5 Biosolid ash Leachphos 0.04 0.57 14.2 0.23 0.42 23.2 Calcined ash AshDec 0.01 3.61 12.5 1.60 1.61 48.6 Mephrec converter slag 0.01 3.75 4.50 0.57 0.53 2.91 Green waste compost OF 0.40 22.7 34.2 13.7 32.2 153 Organic household compost OF 0.25 15.2 28.6 8.61 19.7 106 Catering waste compost 0.28 17.1 33.0 10.6 27.2 130 Cattle solid manure OF 0.28 9.57 11.1 6.65 3.15 37.1
Phosphate rock OF 0.34 2.68 0.30 0.50 0.21 3.89
Table 6 Persistent organic pollutant input to soil in 200 years via fertilizers (referring to 11 kg P ha-1year-1) and atmospheric deposition, compared to half-life time, soil background concentration and guidance values
Unit References
PCB
Digestate kg ha-1 0.003 For fertilizer references see Table3
Sewage sludge kg ha-1 0.011
Farmyard manure kg ha-1 0.015
Green waste compost kg ha-1 0.043 Organic waste compost kg ha-1 0.054
Atmospheric deposition kg ha-1 0.070 Suominen et al. (2014), Amlinger et al. (2004), Bra¨ndli et al. (2007b) and Arellano et al.2015
Half-life time in soil years (mean) 14 Leschber (2006), Amlinger et al. (2004), Creaser et al.2007and Bruckmann et al. (2013)
years (max.) 31 years (min.) 1 Initial soil background
concentration
kg ha-1 0.045 Amlinger et al. (2004) and Creaser et al. (2007)
Soil guidance value kg ha-1 0.975 O¨ NORM S 2088-2 (2004) Digestate kg ha-1 0.16 For fertilizer references see Table3
Sewage sludge kg ha-1 2.83
Farmyard manure kg ha-1 0.05
Green waste compost kg ha-1 6.40 Organic waste compost kg ha-1 13.4
Atmospheric deposition kg ha-1 0.53 Amlinger et al. (2004), Suominen et al. (2014) and Bra¨ndli et al. (2007b) Half-life time in soil years (mean) 12 Leschber (2006), Amlinger et al. (2004), Creaser et al. (2007) and
Bruckmann et al. (2013) years (max.) 32
years (min.) 5 Initial soil background
concentration
kg ha-1 1.38 Amlinger et al. (2004) and Bra¨ndli et al. (2007b)
Soil guidance value kg ha-1 3.25 O¨ NORM S 2088-2 (2004)
PCDD/F
Digestate mg TEQ ha-1 1.49 For fertilizer references see Table3 Sewage sludge mg TEQ ha-1 11.1
Farmyard manure mg TEQ ha-1 6.97 Meat and bone meal mg TEQ ha-1 0.02 Green waste compost mg TEQ ha-1 5.20 Organic waste compost mg TEQ ha-1 3.30
Atmospheric deposition mg TEQ ha-1 0.38 Amlinger et al. (2004), Suominen et al. (2014) and Bra¨ndli et al. (2007b) Half-life time in soil years (mean) 30 Leschber (2006), Amlinger et al. (2004), Umlauf et al. (2010) and
Bruckmann et al. (2013) years (max.) 100
years (min.) 5 Initial soil background
concentration
mg TEQ ha-1 18.6 Amlinger et al. (2004) and Bra¨ndli et al. (2007b)
Soil guidance value mg TEQ ha-1 32,500 O¨ NORM S 2088-2 (2004)
System boundaries
Volatilization of PTEs was not considered by the model as well as other interactions which could influence the mobility of PTEs and the degradation of POPs, like fixation of PTEs through P added by fertilizers or site-specific differences. Also other risks like metal accumulation into soil organisms, leaching to groundwater, transport with surface water or wind, direct uptake of soil by humans and animals have not been considered here.
Results
Input routes of pollutants to soil
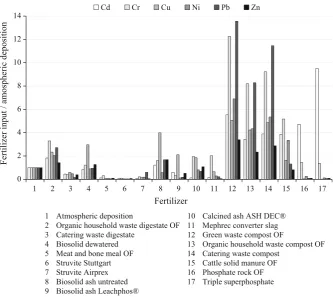
The assessment of the 200-years PTE inputs by fertilizers, liming and atmospheric deposition indi-cated that these inputs are expected to be small compared to the already existing PTE background concentrations in soil (Table5). Between 28% (Cd) and 61% (Ni) of the proposed thresholds were already filled with the existing soil background concentration. Also the assessed sum of all inputs over 200 years was little compared to soil background concentration and would not reach the proposed threshold values. Liming contributed less to the pollution then most fertilizers. The expected atmospheric deposition of pollutants was considerable, however, most fertilizers would have a higher input at least for some elements. With input rates below the atmospheric deposition, meat and bone meal, struvite, digestate of catering waste and treated ashes turned out to be the cleanest fertilizers in relation to their P content. The variability among the fertilizers can be compared on the basis of the ratio of PTE input by fertilizers and atmospheric input (Fig.1). PTEs in composts and cattle manure, and some elements in phosphate rock, triple super-phosphate and untreated biosolid ash exceeded the atmospheric input by far. Fertilizers with a high PTE-to-phosphorus ratio, like composts, showed the high-est PTE input to soil.
POPs entered the agricultural soil via fertilization and atmospheric deposition more or less to the same extent. The fertilizer input and atmospheric deposition of POPs in 200 years was compared to the initial soil background concentration, guidance values and the half-life time (Table6). Soil background
concentration was low compared to the guidance values, it reached 5% for PCB, 43% for PAH and 0.06% for PDCC/F. For PCB, atmospheric deposition was the main route compared to fertilizer input. Main PHA input was caused by organic waste compost, green waste compost and sewage sludge, digestate and farmyard manure were below the atmospheric depo-sition. For PCDD/F the soil guidance value was far higher than any input. Expected PCDD/F input via atmospheric deposition was considerably lower than via fertilizers, except for meat and bone meal. PCDD/ F contamination level by fertilizer application declined as following in descending order: sewage sludge, farmyard manure, green waste compost, organic waste compost and digestate (Table 6).
The PTE and POP inputs provided information about the pollution loads in fertilizers and input routes. Additional information was gained from calculating the soil accumulation risk with the mass balance models which included the PTE output by leaching and harvested crop parts and the POP decomposition in soil.
Accumulation risk of pollutants in soil estimated by the mass balance models
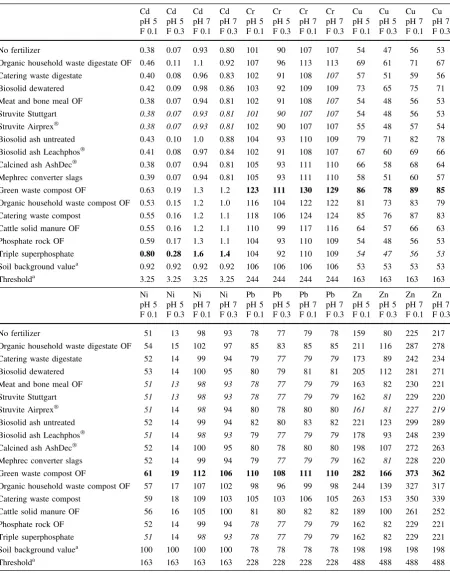
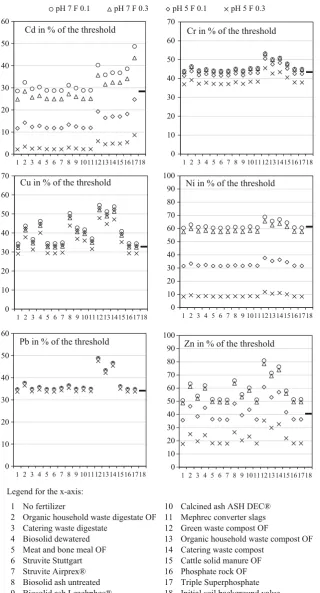
The model estimates for PTE accumulation risks after 200 years of fertilizer application (equivalent to 11 kg P ha-1) indicated that with none of the assessed fertilizers the proposed soil threshold values would be reached (Fig.2). However, the results revealed strong differences in the accumulation risk for the individual PTEs. An overall low Cd accumulation risk in soil, in relation to the threshold values, was predicted for all RPFs except for triple superphosphate, a moderate accumulation risk for Cu, Cr and Pb, and the highest accumulation risk for Ni and Zn (Fig.2; Table8). Soil pH and precipitation excess, affecting the element output from the soil via leaching and harvested crop parts, is expected to have a stronger effect on Cd, Ni and Zn accumulation than the type of fertilizer. For Cr, Cu and Pb, it was the opposite: the PTE amount in fertilizers had a stronger effect on their accumulation than the output losses, varying with soil pH and precipitation excess (Fig. 2).
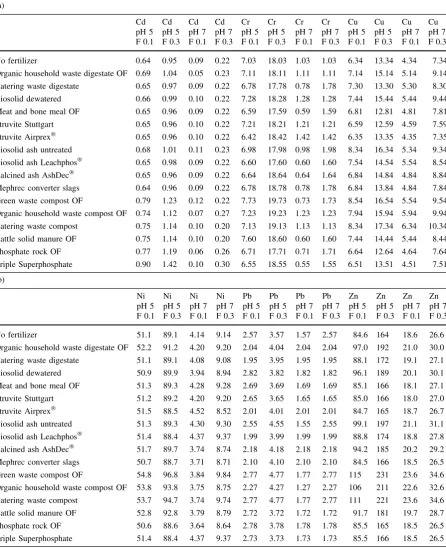
Table 7 Total output (kg ha-1) of PTEs after 200 years of fertilization (equivalent to 11 kg P ha-1) by leaching and in harvested crop parts
(a)
Cd Cd Cd Cd Cr Cr Cr Cr Cu Cu Cu Cu
pH 5 pH 5 pH 7 pH 7 pH 5 pH 5 pH 7 pH 7 pH 5 pH 5 pH 7 pH 7 F 0.1 F 0.3 F 0.1 F 0.3 F 0.1 F 0.3 F 0.1 F 0.3 F 0.1 F 0.3 F 0.1 F 0.3
No fertilizer 0.64 0.95 0.09 0.22 7.03 18.03 1.03 1.03 6.34 13.34 4.34 7.34
Organic household waste digestate OF 0.69 1.04 0.05 0.23 7.11 18.11 1.11 1.11 7.14 15.14 5.14 9.14 Catering waste digestate 0.65 0.97 0.09 0.22 6.78 17.78 0.78 1.78 7.30 13.30 5.30 8.30 Biosolid dewatered 0.66 0.99 0.10 0.22 7.28 18.28 1.28 1.28 7.44 15.44 5.44 9.44 Meat and bone meal OF 0.65 0.96 0.09 0.22 6.59 17.59 0.59 1.59 6.81 12.81 4.81 7.81 Struvite Stuttgart 0.65 0.96 0.10 0.22 7.21 18.21 1.21 1.21 6.59 12.59 4.59 7.59 Struvite Airprex 0.65 0.96 0.10 0.22 6.42 18.42 1.42 1.42 6.35 13.35 4.35 7.35 Biosolid ash untreated 0.68 1.01 0.11 0.23 6.98 17.98 0.98 1.98 8.34 16.34 5.34 9.34 Biosolid ash Leachphos 0.65 0.98 0.09 0.22 6.60 17.60 0.60 1.60 7.54 14.54 5.54 8.54 Calcined ash AshDec 0.65 0.96 0.09 0.22 6.64 18.64 0.64 1.64 6.84 14.84 4.84 8.84 Mephrec converter slags 0.64 0.96 0.09 0.22 6.78 18.78 0.78 1.78 6.84 13.84 4.84 7.84 Green waste compost OF 0.79 1.23 0.12 0.22 7.73 19.73 0.73 1.73 8.54 16.54 5.54 9.54 Organic household waste compost OF 0.74 1.12 0.07 0.27 7.23 19.23 1.23 1.23 7.94 15.94 5.94 9.94 Catering waste compost 0.75 1.14 0.10 0.20 7.13 19.13 1.13 1.13 8.34 17.34 6.34 10.34 Cattle solid manure OF 0.75 1.14 0.10 0.20 7.60 18.60 0.60 1.60 7.44 14.44 5.44 8.44 Phosphate rock OF 0.77 1.19 0.06 0.26 6.71 17.71 0.71 1.71 6.64 12.64 4.64 7.64 Triple Superphosphate 0.90 1.42 0.10 0.30 6.55 18.55 0.55 1.55 6.51 13.51 4.51 7.51
(b)
Ni Ni Ni Ni Pb Pb Pb Pb Zn Zn Zn Zn
pH 5 pH 5 pH 7 pH 7 pH 5 pH 5 pH 7 pH 7 pH 5 pH 5 pH 7 pH 7 F 0.1 F 0.3 F 0.1 F 0.3 F 0.1 F 0.3 F 0.1 F 0.3 F 0.1 F 0.3 F 0.1 F 0.3
No fertilizer 51.1 89.1 4.14 9.14 2.57 3.57 1.57 2.57 84.6 164 18.6 26.6
Table 8 Modelled soil accumulation of potentially toxic elements (kg ha-1) after 200 years of fertilizer application equivalent to 11 kg phosphorus per ha and year at four levels of pH and precipitation excess F values
Cd Cd Cd Cd Cr Cr Cr Cr Cu Cu Cu Cu
pH 5 F 0.1
pH 5 F 0.3
pH 7 F 0.1
pH 7 F 0.3
pH 5 F 0.1
pH 5 F 0.3
pH 7 F 0.1
pH 7 F 0.3
pH 5 F 0.1
pH 5 F 0.3
pH 7 F 0.1
pH 7 F 0.3
No fertilizer 0.38 0.07 0.93 0.80 101 90 107 107 54 47 56 53
Organic household waste digestate OF 0.46 0.11 1.1 0.92 107 96 113 113 69 61 71 67
Catering waste digestate 0.40 0.08 0.96 0.83 102 91 108 107 57 51 59 56
Biosolid dewatered 0.42 0.09 0.98 0.86 103 92 109 109 73 65 75 71
Meat and bone meal OF 0.38 0.07 0.94 0.81 102 91 108 107 54 48 56 53
Struvite Stuttgart 0.38 0.07 0.93 0.81 101 90 107 107 54 48 56 53
Struvite Airprex 0.38 0.07 0.93 0.81 102 90 107 107 55 48 57 54
Biosolid ash untreated 0.43 0.10 1.0 0.88 104 93 110 109 79 71 82 78
Biosolid ash Leachphos 0.41 0.08 0.97 0.84 102 91 108 107 67 60 69 66
Calcined ash AshDec 0.38 0.07 0.94 0.81 105 93 111 110 66 58 68 64
Mephrec converter slags 0.39 0.07 0.94 0.81 105 93 111 110 58 51 60 57
Green waste compost OF 0.63 0.19 1.3 1.2 123 111 130 129 86 78 89 85
Organic household waste compost OF 0.53 0.15 1.2 1.0 116 104 122 122 81 73 83 79
Catering waste compost 0.55 0.16 1.2 1.1 118 106 124 124 85 76 87 83
Cattle solid manure OF 0.55 0.16 1.2 1.1 110 99 117 116 64 57 66 63
Phosphate rock OF 0.59 0.17 1.3 1.1 104 93 110 109 54 48 56 53
Triple superphosphate 0.80 0.28 1.6 1.4 104 92 110 109 54 47 56 53
Soil background valuea 0.92 0.92 0.92 0.92 106 106 106 106 53 53 53 53
Thresholda 3.25 3.25 3.25 3.25 244 244 244 244 163 163 163 163
Ni Ni Ni Ni Pb Pb Pb Pb Zn Zn Zn Zn
pH 5 F 0.1
pH 5 F 0.3
pH 7 F 0.1
pH 7 F 0.3
pH 5 F 0.1
pH 5 F 0.3
pH 7 F 0.1
pH 7 F 0.3
pH 5 F 0.1
pH 5 F 0.3
pH 7 F 0.1
pH 7 F 0.3
No fertilizer 51 13 98 93 78 77 79 78 159 80 225 217
Organic household waste digestate OF 54 15 102 97 85 83 85 85 211 116 287 278
Catering waste digestate 52 14 99 94 79 77 79 79 173 89 242 234
Biosolid dewatered 53 14 100 95 80 79 81 81 205 112 281 271
Meat and bone meal OF 51 13 98 93 78 77 79 79 163 82 230 221
Struvite Stuttgart 51 13 98 93 78 77 79 79 162 81 229 220
Struvite Airprex 51 14 98 94 80 78 80 80 161 81 227 219
Biosolid ash untreated 52 14 99 94 82 80 83 82 221 123 299 289
Biosolid ash Leachphos 51 14 98 93 79 77 79 79 178 93 248 239
Calcined ash AshDec 52 14 100 95 80 78 80 80 198 107 272 263
Mephrec converter slags 52 14 99 94 79 77 79 79 162 81 228 220
Green waste compost OF 61 19 112 106 110 108 111 110 282 166 373 362
Organic household waste compost OF 57 17 107 102 98 96 99 98 244 139 327 317
Catering waste compost 59 18 109 103 105 103 106 105 263 153 350 339
Cattle solid manure OF 56 16 105 100 81 80 82 82 189 100 261 252
Phosphate rock OF 52 14 99 94 78 77 79 79 162 82 229 221
Triple superphosphate 51 14 98 93 78 77 79 79 162 82 229 221
Soil background valuea 100 100 100 100 78 78 78 78 198 198 198 198
Thresholda 163 163 163 163 228 228 228 228 488 488 488 488
model for PCB, PAH and PCDD/F showed no accumulation potentials for these substances. A decrease of the POP amounts in soil was calculated during the assessed period, as indicated by lower values after 200 years than the initial soil background concentration, which means that imported and already accumulated POPs could degrade. For PCB, the amount of fertilizer input was very similar to the atmospheric deposition (Fig.3). The contamination level (high or low) of PCB in fertilizers did not make any difference in accumulation.
For PAH, the contamination level mattered to some extent and resulted in higher PAH accumulation for composts compared to other fertilizers and atmo-spheric deposition. PCDD/F accumulation was negli-gible compared to the guidance value and the initial soil background concentration (Fig.3).
Relevance of soil pH and precipitation excess for soil pollution
The partitioning coefficient KD varied strongly with pH value for all regarded PTEs. Among the PTEs, the
ratio of KD at pH 7 and pH 5 was narrowest for Cu, indicating the least pH dependence (Table4).
Over all elements, the greatest accumulation was predicted in the scenario with pH 7 and precipitation excess F=0.1 m year-1, the lowest in the scenario with pH 5 and precipitation excess F =0.3 m year-1. The model calculation indicated a major influence of pH value and the precipitation excess F on soil PTE accumulation risk, mainly on Cd, Ni and Zn accumu-lation, whereas Cr, Cu and Pb were less influenced (Fig.2). This differentiation among the PTEs could not be clearly inferred from their KD values at varying pH value (Table 4). Comparing the scenarios, a high accumulation of PTEs was related to a low output by leaching and in harvested crop parts, and vice versa (Fig.2; Table 7). However, for Cr, Cu, Ni, Pb and Zn the influence of precipitation excess on the lation risk was negligible at pH 7. The PTE accumu-lation was clearly higher than the output for Cr, Cu, Pb and Zn at both pH 5 and pH 7. For Cd and Ni this was the case only at pH 7, while in soil with pH 5 the reverse was observed (Tables 7,8).
1 Atmospheric deposition 10 Calcined ash ASH DEC® 2 Organic household waste digestate OF 11 Mephrec converter slag 3 Catering waste digestate 12 Green waste compost OF
4 Biosolid dewatered 13 Organic household waste compost OF 5 Meat and bone meal OF 14 Catering waste compost
6 Struvite Stuttgart 15 Cattle solid manure OF 7 Struvite Airprex 16 Phosphate rock OF 8 Biosolid ash untreated 17 Triple superphosphate 9 Biosolid ash Leachphos®
0 2 4 6 8 10 12 14
1 2 3 4 5 6 7 8 9 10 11 12 13 14 15 16 17
Fertilizer
input / am
ospheric deposition
Fertilizer
Cd Cr Cu Ni Pb Zn
Fig. 1 Ratio between fertilizer input and atmospheric deposition of potentially toxic elements for the fertilizer application rate equivalent to
[image:12.547.167.501.56.353.2]0 10 20 30 40 50 60
1 2 3 4 5 6 7 8 9 101112131415161718
Cd in % of the threshold
0 10 20 30 40 50 60 70
1 2 3 4 5 6 7 8 9 101112131415161718
Cu in % of the threshold
0 10 20 30 40 50 60 70
1 2 3 4 5 6 7 8 9 101112131415161718
Cr in % of the threshold pH 7 F 0.1 pH 7 F 0.3 pH 5 F 0.1 pH 5 F 0.3
0 10 20 30 40 50 60 70 80 90 100
1 2 3 4 5 6 7 8 9 101112131415161718
Zn in % of the threshold 0
10 20 30 40 50 60 70 80 90 100
1 2 3 4 5 6 7 8 9 101112131415161718
Ni in % of the threshold
0 10 20 30 40 50 60
1 2 3 4 5 6 7 8 9 101112131415161718
Pb in % of the threshold
Legend for the x-axis:
1 No fertilizer 10 Calcined ash ASH DEC®
2 Organic household waste digestate OF 11 Mephrec converter slags 3 Catering waste digestate 12 Green waste compost OF
4 Biosolid dewatered 13 Organic household waste compost OF
5 Meat and bone meal OF 14 Catering waste compost
6 Struvite Stuttgart 15 Cattle solid manure OF
7 Struvite Airprex® 16 Phosphate rock OF
8 Biosolid ash untreated 17 Triple Superphosphate 9 Biosolid ash Leachphos® 18 Initial soil background value Fig. 2 Modelled soil
accumulation of potentially toxic elements (y-axis) in % of proposed threshold values after 200 years of fertilizer application equivalent to 11 kg P ha-1year-1at four levels of pH and
[image:13.547.186.507.55.649.2]Relevance of PTE load of fertilizers for soil pollution
The soil accumulation risk of PTEs also varied depending on the PTE load applied with the fertilizers. More total PTE input led to a higher accumulation in soil but as well to a higher output via leaching and crop uptake. The estimated overall output of PTEs over 200 years was very similar among the fertilizers, but strong related to soil reaction and precipitation (Table7). For all fertilizers, a soil pH of 7 in combination with a low precipitation excess (F 1.0 m year-1) led to the highest accumulation poten-tial, and this resulted in the lowest PTE output (Fig. 2; Table7).
Triple superphosphate, green waste compost and phosphate rock had the highest Cd accumulation risk and the highest Cd output (Tables7,8). Lowest Cd accumulation and output risk can be expected from the use of struvites, meat and bone meal and calcined ash (AshDec). For Cr, the highest accumulation and
output risk was predicted by the model with composts, and the least accumulation and output risk with struvites, meat and bone meal, catering waste digestate and biosolid ash Leachphos. The elements Cu, Ni, Pb and Zn likewise showed the highest accumulation risk with composts. The maximum accumulation can be expected for the use of green waste composts. Calculations showed that the lowest potential Cu accumulation and lowest output is achieved with the use of triple superphosphate, struvites and phosphate rock. Lowest Zn accumulation and output was found for struvites meat and bone meal, Mephrec converter slags phosphate rock and triple superphosphate (Fig.2; Table7). Lowest Pb and Ni accumulation and output was achieved with the fertilization of struvites, meat and bone meal, catering waste digestate and triple superphosphate.
Fertilizers with a high PTE-to-phosphorus ratio, like composts, showed the highest potential for PTE accumulation in soil. Except for Cd, the use of mined P sources (phosphate rock, triple superphosphate) was
0 5 10
1 2 3 4 5 6 7 8
PCB low PCB high
0 5 10 15 20 25 30 35 40 45 50
1 2 3 4 5 6 7 8
PAH low PAH high
0 5 10 15 20 25 30 35 40 45 50 55 60
1 2 3 4 5 6 7 8
PCDD/F low PCDD/F high
1 No fertilizer ( ) 2 Compost green waste 3 Compost biowaste 4 Farmyard manure 5 Sewage sludge 6 Digestate
7 Meat and bone meal
8 Initial soil background value ( ) n.a. Not available
n.a. n.a.
[image:14.547.152.500.58.388.2]related to very low PTE inputs and a negligible soil accumulation risk (Fig.2; Table7).
Discussion
Pollutant input into soil
Comparing the inputs of PTEs and POPs over 200 years gave a good overview over the routes to soil and over conventional and recycled phosphorus fertilizers (RPFs). The inputs for PTEs (Table5) point out that the current concentration of pollutants in soil has the largest share of all PTE sources in the 200-years simulation and that atmospheric deposition in this period was partly higher than inputs via fertilizers. Also for POPs atmospheric deposition was an important route to soil, comparable to fertilizer input (Table6). The calculated total PTE inputs over 200 years were below the proposed thresholds in all cases (Table 5). From the variation in KD values with soil pH (Table 4), a lower pH effect on Cu leaching can be assumed compared to the other PTEs. The total inputs of the POPs PCB and PCDD/F also were lower than the guidance values. Fertilization with organic waste compost, however, resulted in a PAH input surpassing the guidance values (Table6). The long-term accumulation risk of PTEs and POPs in European agricultural soils cannot be estimated by looking at their inputs only; also their output and decomposi-tion have to be considered.
Implications of pollutant concentrations in P fertilizers
The estimates of the mass balance model showed that with none of the RPFs and POPs included in the model calculations the soil threshold values would be reached, even in a 200-years perspective. Therefore, PTEs are no longer excluding nutrient recycling for the assessed sources. Furthermore, the PTE inputs with fertilizers applied at a constant P fertilisation level were not correlated with the PTE concentrations in the fertilizers (Tables 2,5). The fertilizer applica-tion rate is governed by the P concentraapplica-tion in the fertilizer. Therefore, materials with low P concentra-tions, such as composts, can result in a higher PTE and POP inputs to soil than fertilizers with higher pollutant and high P concentrations. Consequently, the
pollutant-to-nutrient ratio is the main driving factor for pollutant flows applied to the soil. This implies that hypothesis (i), stating that PTE and POP concentra-tions in fertilizers are the main factor for their accumulation in soil, can be rejected. Therefore, any regulation aiming at a quality control of fertilizers should not be defined according to pollutant concen-trations on a dry matter base but should consider the relation between contaminants and nutrients and their input per area and time.
The results also indicate that RPFs like sewage sludge and products obtained from sewage like struvite or from thermal approaches like the produc-tion of calcined phosphates via AshDec, Mephrec converter slags or Leachphos can reduce the PTE accumulation risk. The advantage of thermal approaches is the decomposition of organic pollutants, but carbon and nitrogen are lost as well.
Accumulation and safety risks related to specific fertilizer sources
Urban organic waste, substrates of waste water treatment and by-products of meat production are the source materials for phosphorus recycling. The quality of the resulting fertilizers varies to a large extent.
Urban organic waste
Substrate of urban wastewater treatment
The model predicted an unexpected low PTE and POP accumulation risk for biosolids, lower than that of composts. In agreement, some more recent studies on PTEs (Herter et al. 2003; Dittrich and Klose 2008; Eriksen et al. 2009; Magid 2013) found that soil contamination via biosolid application was within the legal framework. Accordingly, also the risk to human health via dietary intake of POPs from crops grown on biosolid treated soils was found to be minimal (Eriksen et al. 2009; Haynes et al. 2009; Smith
2009b). If the pollutant-to-nutrient ratio allows the use of sewage sludge as fertilizer, it is also economically very efficient.
RPFs based on biosolid ash, like untreated ash, Leachphos and Mephrec converter slag have the advantage that organic contaminants are destroyed during the incineration procedure. Products made of biosolid ash are still in a pilot-scale, so uncertainties in data quality are presumed. Still, the rate of P recovery from the raw sludge was high, ranging from 70 to 98% for Biosolid ash Leachphos, Mephrec calcined slags and Mg-treated ash via AshDec(Herzel et al.2015b). Cleaned ashes had a low PTE and no POP accumu-lation risk. The AshDec depollution process for production of Mg-ash can reduce Cd, Cu, Hg, Pb, Mo, Sn and Zn, but not Cr and Ni (Herzel et al.2015a). The PTE removal is selective and depends on the process, it might differ in future full-scale plants (Kraus and Seis2015).
Magnesium–ammonium–phosphate (struvite) showed the lowest soil PTE accumulation risk among the inorganic fertilizers in this ranking due to a very high P content. Data on POPs were not available. Crystallisation of (struvite) takes place in sewage sludge before dewatering (Stuttgart process) or in processed water after primary clarification (Airprex process) and is a stoichiometric process in which a very little amount of pollutants is co-precipitated in the final product. This low PTE amount in struvite was also found by Kraus and Seis (2015). Struvite production has a P recovery rate of 7% (Airprex) to 45% (Stuttgart Sludge Leaching), also depending on wastewater P content (Herzel et al. 2015b). Struvite would be very suitable for organic farming because of the favourable P-to-contaminant ratio combined with low water solubility and a high P fertilizer effective-ness (Mo¨ller et al.2017).
Slaughterhouse waste
Meat and bone meal, which is allowed in organic farming, is the fertilizer source with the lowest soil PTE accumulation risk in this estimation because of very low contamination (food grade raw material) and a high P content. In terms of pathogens, meat and bone meal can be considered as much safer than animal manure and several other organic fertilizers (Mo¨ller
2015).
Inorganic reference fertilizers
Triple superphosphate had a higher accumulation estimate for Cd than green waste compost OF, for phosphate rock it was a little lower than for green waste compost, all other PTEs were on a very low level. Nziguheba and Smolders (2008) found a significant correlation between Cd, Ni and P content in phosphorus ore leading to elevated Cd and Ni concentration in P fertilizers. Mineral P fertilizers are a major source of PTEs in the food chain (Kratz and Schnug2005).
Source material and production process of RPFs determined their pollutant and P concentration, and thereby the pollutant-to-P ratio of the fertilizers. In this way, source material and production process of RPFs, but not their pollutant concentration on a dry matter base, affect the input and soil accumulation risk of PTE and POP.
Hypothesis (ii), stating that the source material and the production process of RPFs determine their contamination and the risk of PTE and POP accumu-lation in soil, was therefore largely confirmed. Comparison of recycled phosphorus fertilizers to commonly used fertilizers
rock were replaced by RPFs, except composts. Cd poses a health risk at concentrations below those causing phytotoxicity (McLaughlin et al. 1999). Therefore, Cd belongs to the most important elements to consider in terms of food-chain contamination (McLaughlin et al.1999).
The model estimates contradict several older stud-ies that have shown accumulation of PTEs in soils after long-term application of high amounts of biosolids (McGrath1984; McGrath et al.1995; Sekhar et al.2002; Udom et al.2004; Dai et al.2006). In the last three decades there has been a significant reduc-tion of PTEs and POPs in organic residues and the sewage systems due to implementation of environ-mental regulations in Europe. These include the source separated collection of organic household waste compared to mechanically sorted feedstock (Epstein et al.1992; Sharma et al.1997; Amlinger et al.2004), as well as separation of wastewaters from industry and households and changing waste management tech-nologies (Herter et al. 2003; Amlinger et al. 2004; Magid et al.2006; Schroder et al.2008; Eriksen et al.
2009). The quality of recycled P fertilizers has improved, in the case of biosolids with a 3–5-fold decline in the content of PTEs (Cd, Hg, Pb, Zn) since the late seventies (Herter et al.2003; Amlinger et al.
2004; Kupper2008; Eriksen et al.2009; Milieu Ltd et al.2010). The implementation of source segregated collection of urban organic household wastes has reduced the PTE concentration in compost typically by a factor of 2–10 compared to mechanically separated material (Amlinger et al.2004). The release of POPs into the environment was reduced by the implementation of the Aarhus Protocol and the Stockholm Convention on Persistent Organic Pollu-tants and by technical improvements in industry like filters and high temperature combustion (Leschber
2006). These achievements should be considered. Many fertilizers are not allowed in organic farming, like digestates containing non-certified row material (e.g. catering waste digestate), sewage sludge based fertilizers (struvite, ashes, sewage sludge), or not used because of private association rules, like meat and bone meal (Løes et al.2017). The present calculation for PTE and POP accumulation in soil showed that the regular use of the P fertilizer mentioned above, implies a lower risk of contaminant input and accumulation than using composts, farmyard manure and phosphate rock, which are mostly used in organic farming. The
RPFs struvite, meat and bone meal, catering waste digestate, the ash products Mephrec, AshDec and Leachphos had a very low input and accumulation risk of contaminants compared to commonly used fertilizers. Consequently, hypothesis (iii), stating that the regular use of recycled phosphorus fertilizers causes higher soil pollution than established fertiliz-ers, was disproved with respect to the PTE and POP accumulation risk.
The relevance of soil and climatic conditions The balance model estimated a strong influence of soil reaction (pH value) and precipitation excess on Cd, Ni and Zn mobility in soil and a lesser effect on Cr, Cu and Pb. This diverging effect on pH and precipitation excess among the PTEs was not clearly related to the pH effect on their KD values (Table4). Cu tends to bind to organic ligands and Pb is strongly absorbed by humic matter at pH 4 and above (Oorts2013; Steinnes
four scenarios. These scenarios gave estimates of PTE behaviour in European agricultural soils and PTE distribution among the environmental compartments soil, water and crop. In fact, soil is more complex and beside the considered determining factors, the soil type, soil organic matter, redox potential, temperature, Fe/Mn oxides, Ca content, erosion and other variables play a role in PTE behaviour and distribution in soil (Young 2013). Therefore, specific sites can deviate from the simulations. Any comprehensive, site-speci-fic assessment of the accumulation risk of contami-nants needs to take the local atmospheric deposition and soil conditions into consideration. In addition, a regular monitoring of the total and soluble contents of potentially harmful substances should complement an improved P recycling approach.
The mass balance calculations were based on an average P withdrawal of 11 kg P ha-1year-1 on European stockless organic farms. The average P fertilizer consumption of arable land in Europe calculated by Smolders (2013) was 9.6 kg P ha-1 year-1. So the estimates of this study can be extended beyond organic farming to the average European situation on arable land. For more intense systems, high fertilisation scenarios should be calculated.
Most POPs are apolar organic compounds adsorbed to the organic matter in the soil and therefore not directly affected by pH and precipitation excess and little prone to leaching (Jones and De Voogt 1999). Although precipitation excess can affect runoff gen-erated erosion and POP transfer into surface waters, already by regarding their half-life time in relation to their input by fertilizer application, their estimated accumulation risk in soil was low to very low. Without the model it would have been impossible, e.g. to realistically estimate PAH accumulation and to predict if it would reach the guidance values in 200 years, because fertilization with organic waste compost would result in PAH input five times above the guidance limit.
Environmental cycling of pollutants
There is evidence that PTEs are no longer a major constraint limiting the use of RPFs in agriculture. The systematic use of recycled P fertilizers in Switzerland before the ban of biosolids, for example, contributed to about 17% of the PTEs and 20% of the POPs in the food chain while atmospheric deposition, manure,
mineral fertilizer and pesticides were other important input sources (Herter et al. 2003). For several POPs (e.g. PCBs), environmental cycling, mainly atmo-spheric deposition, is the main source to biosolids and other waste streams (Smith 2009b; Kupper 2008). Human daily exposure to chemicals (emerging pollu-tants) contained e.g. in packaging materials (Phthalate, Bisphenol A), cosmetics (UV-filter, fragrances), preservatives, flame retardants or drugs are a much higher risk than a potential contamination through the detour recycled fertilizer (Herter et al. 2003). Only reducing the chemical release into the environment, e.g. by excluding potential point sources from the sewage or other treatment systems, will tackle this problem at its source (Herter et al. 2003; Kupper
2008).
Conclusions
The calculated PTE inputs by P fertilizers for substi-tuting phosphorus withdrawal via cash crops on organic farms, by liming and by atmospheric deposi-tion over a 200-years period were small compared to the already existing PTE background concentrations in soil. Fertilizers with a high PTE-to-phosphorus ratio, like composts, showed the highest PTE input to soil. The lowest PTE input was found for meat and bone meal, struvite, digestate of catering waste and treated ashes.
The Cd, Cr, Cu, Ni, Pb, and Zn accumulation in soil estimated by the mass balance model did not exceed proposed soil threshold values. Present results there-fore indicate that the PTE content in most of the currently available recycled P sources does not exclude them from being used as P fertilizers. The PTE loads of recycled P fertilizers are no longer a major factor limiting the recycling of nutrients like P from our urban areas back to agriculture. Neverthe-less, sustainable RPF application requires a regular PTE monitoring, as a high contamination risk for single batches still persists.
pollutant-to-nutrient ratio is better suited to determine the quality of recycled P fertilizers than the actual standards to measure and assess pollutants on a dry matter base.
The estimated accumulation risk of the addressed persistent organic pollutants was also minor. How-ever, there is a need to continue examining the impact of new contaminants entering the food chain.
To reduce the contamination of waste streams it is necessary to reduce and replace harmful substances at their source.
Acknowledgements Open access funding provided by University of Natural Resources and Life Sciences Vienna (BOKU). The authors are grateful to Astrid Oberson and Jakob Magid for valuable advice during the assessments. This work was carried out within the EU-project IMPROVE-P. The authors gratefully acknowledge the financial support for this project provided by the CORE Organic II Funding Bodies, being partners of the FP7 ERA-Net project, CORE Organic II (www. coreorganic2.org).
Open Access This article is distributed under the terms of the Creative Commons Attribution 4.0 International License (http:// creativecommons.org/licenses/by/4.0/), which permits unrest-ricted use, distribution, and reproduction in any medium, pro-vided you give appropriate credit to the original author(s) and the source, provide a link to the Creative Commons license, and indicate if changes were made.
References
Amlinger F, Pollak M, Favoino E (2004) Heavy metals and organic compounds from wastes used as organic fertilisers. Study on behalf of the European Commission, Directorate-General Environment, ENV. A, 2
Arellano L, Ferna´ndez P, Fonts R, Rose NL, Nickus U, Thies H, Stuchlik E, Camarero L, Catalan J, Grimalt JO (2015) Increasing and decreasing trends of the atmospheric deposition of organochlorine compounds in European remote areas during the last decade. Atmos Chem Phys Discuss 15:3415–3453. https://doi.org/10.5194/acpd-15-3415-2015
AROMIS (2016) Heavy metals and nutrients in European cattle solid manure. Database AROMIS, assessment and reduc-tion of heavy metal input into agro-ecosystems. http:// daten.ktbl.de/aromis/heavyMetal.do. Accessed 26 Feb 2017
Beckmann U, Gru¨nbeck A, Ha¨nsel M, Karalus W, Kolbe H, Schuster M, Arp B, Beese G, Krelling B, Po¨litz B, Auer-bach D (2001) Getreide im O¨ kologischen Landbau Infor-mationen fu¨r Praxis und Beratung. Sa¨chsische Landesanstalt fu¨r Landwirtschaft
Benı´sˇek M, Kukucˇka P, Mariani G, Suurkuusk G, Gawlik BM, Locoro G, Giesy JP, Bla´ha L (2015) Dioxins and
dioxin-like compounds in composts and digestates from European countries as determined by the in vitro bioassay and chemical analysis. Chemosphere 122:168–175.https://doi. org/10.1016/j.chemosphere.2014.11.039
Berry PM, Stockdale EA, Sylvester-Bradley R, Philipps L, Smith KA, Lord EI, Watson CA, Fortune S (2003) N, P and K budgets for crop rotations on nine organic farms in the UK. Soil Use Manag 19:112–118.https://doi.org/10.1111/ j.1475-2743.2003.tb00289.x
Berset JD, Holzer R (1995) Organic micropollutants in swiss agriculture: distribution of polynuclear aromatic hydro-carbons (PAH) and polychlorinated biphenyls (PCB) in soil, liquid manure, sewage sludge and compost samples; a comparative study. Intern J Environ Anal Chem 59:145–165
Bra¨ndli RC, Bucheli TD, Kupper T, Furrer R, Stahel WA, Stadelmann FX, Tarradellas J (2007a) Organic pollutants in compost and digestate. Part 1. Polychlorinated biphe-nyls, polycyclic aromatic hydrocarbons and molecular markers. J Environ Monit 9:456–464.https://doi.org/10. 1039/B617101J
Bra¨ndli RC, Kupper T, Bucheli TD, Zennegg M, Huber S, Ortelli D, Mu¨ller J, Schaffner C, Iozza S, Schmid P, Berger U, Edder P, Oheme M, Stadelmann FX, Tarradellas J (2007b) Organic pollutants in compost and digestate. Part 2. Polychlorinated dibenzo-p-dioxins, and -furans, dioxin-like polychlorinated biphenyls, brominated flame retar-dants, perfluorinated alkyl substances, pesticides, and other compounds. J Environ Monit 9:465–472.https://doi.org/ 10.1039/B617103F
Bruckmann P, Hiester E, Klees M, Zetzsch C (2013) Trends of PCDD/F and PCB concentrations and depositions in ambient air in Northwestern Germany. Chemosphere 93:1471–1478. https://doi.org/10.1016/j.chemosphere. 2013.07.029
Clarke RM, Cummins E (2015) Evaluation of ‘‘classic’’ and emerging contaminants resulting from the application of biosolids to agricultural lands: a review. Hum Ecol Risk Assess Int J 21:492–513. https://doi.org/10.1080/ 10807039.2014.930295
Cooper J, Reed EY, Ho¨rtenhuber S, Lindenthal T, Løes A-K, Ma¨der P, Magid J, Oberson A, Kolbe H, Mo¨ller K (2017) Phosphorus availability on organically managed farms in Europe. Nutr Cycl Agroecosyst. https://doi.org/10.1007/ s10705-017-9894-2
Cordell D, White S (2011) Peak phosphorus: clarifying the key issues of a vigorous debate about long-term phosphorus security, review. Sustainability 3:2027–2049. https://doi. org/10.3390/su3102027
Creaser CS, Wood MD, Alcock RE, Copplestone D (2007) UK Soils and Herbage Survey. Report 8: Environmental con-centrations of polychlorinated biphenyls (PCBs) in UK soil and herbage. Environment Agency, Bristol. ISBN: 978-1-84432-773-7
CSTEE (2002) Opinion on Member State assessments of the risk to health and the environment from cadmium in fertilizers. http://ec.europa.eu/health/ph_risk/committees/sct/ documents/out162_en.pdf. Accessed 17 July 2017 Dai JY, Chen L, Zhao JF, Ma N (2006) Characteristics of
with amendment of sewage sludge. J Environ Sci 18:1094–1100
De Vries W, Groenenberg JE, Lofts S, Tipping E, Posch M (2013) Critical loads of heavy metals for soils. In: Alloway BJ (ed) Heavy metals in soils, 3rd edn. Springer, Amster-dam, pp 211–237
Desmidt E, Ghyselbrecht K, Zhang Y, Pinoy L, Van der Brug-gen B, Verstraete W, Rabaey K, Meesschaert B (2014) Global phosphorus scarcity and full-scale p-recovery techniques: a review. Crit Rev Environ Sci Technol 45(4):336–384
Dittrich B, Klose R (2008) Schwermetalle in Du¨ngemitteln— Bestimmung und Bewertung von Schwermetallen in Du¨ngemitteln, Bodenhilfsstoffen und Kultursubstraten. Schriftenreihe der Sa¨chsischen Landesanstalt fu¨r Land-wirtschaft. Heft 3/2008.https://publikationen.sachsen.de/ bdb/artikel/14898/documents/17816. Accessed 20 March 2017
EC (2008) Commission Regulation No 889/2008 laying down detailed rules for the implementation of Council Regula-tion (EC) No 834/2007 on organic producRegula-tion and labelling of organic products with regard to organic production, labelling and control
Egle L, Rechberger H, Zessner M (2015) Overview and description of technologies for recovering phosphorus from municipal wastewater. Resour Conserv Recycl 105:325–346.https://doi.org/10.1016/j.resconrec.2015.09. 016
Egle L, Amann A, Rechberger H, Zessner M (2016) Phosphor: Eine kritische und zugleich unzureichend genutzte Res-source der Abwasser- und Abfallwirtschaft—Stand des Wissens und Ausblick fu¨r O¨ sterreich und Europa. Oesterr Wasser Abfallwirtsch 68:118–133. https://doi.org/10. 1007/s00506-016-0295-6
Eljarrat E, Marsh G, Labandeira A, Barcelo D (2008) Effect of sewage sludges contaminated with polybrominated diphenylethers on agricultural soils. Chemosphere 71:1079–1086
Elser JJ (2012) Phosphorus: a limiting nutrient for humanity? Curr Opin Biotechnol 23(6):833–838
EPA (1999) Understanding variation in partitioning coefficient, Kd, values, Volume II. https://www.epa.gov/sites/ production/files/2015-05/documents/402-r-99-004b.pdf. Accessed 20 March 2017
Epstein E, Chaney RL, Henry C, Logan TJ (1992) Trace ele-ments in municipal solid waste compost. Biomass Bioen-ergy 1992:227–238
Eriksen GS, Amundsen CE, Bernhof A, Eggen T, Grave K, Halling- Sørensen B, Ka¨llquist T, Sogn T, Sverdrup L (2009) Risk assessment of contaminants in sewage sludge applied on norwegian soils. Norwegian Scientific Com-mittee for Food Safety, Oslo
EU (2016) Persistant organic pollutants—environment—Euro-pean Commission. http://ec.europa.eu/environment/ chemicals/international_conventions/index_en.htm. Accessed 20 Nov 2016
EU Directive 86/278/EEC (1986) Council Directive 86/278/ EEC of 12 June 1986 on the protection of the environment, and in particular of the soil, when sewage sludge is used in agriculture
EU Regulation (EC) No 1069/2009 of the European parliament and of the council of 21 October 2009 laying down health rules as regards animal by-products and derived products not intended for human consumption and repealing Regu-lation (EC) No 1774/2002 (Animal by-products Regulation)
FAO (2004) Position paper on dioxins and dioxin-like PCBs. Joint FAO/WHO Food Standards Programme. Codex Committee on Food Additives and Contaminants.ftp://ftp. fao.org/codex/Meetings/CCFAC/ccfac36/fa36_32e.pdf. Accessed 20 March 2017
Gawlik BM, Bidoglio G (2006) Background values in European soils and sewage sludges, part 3. Conclusions, comment and recommendations. In: Gawlik BM, Bidoglio G (eds) Results of a JRC-coordinated study on background values, European Commission. Joint Research Centre. http:// admin.isprambiente.it/it/progetti/suolo-e-territorio-1/uso- dei-fanghi-di-depurazione-in-agricoltura-attivita-di-controllo-e-vigilanza-del-territorio/files/FANGHI_JRC_3. pdf. Accessed 20 March 2017
Govasmark E, Sta¨b J, Holen B, Hoornstra D, Nesbakk T, Salkinoja-Salonen M (2011) Chemical and microbiologi-cal hazards associated with recycling of anaerobic digested residue intended for agricultural use. Waste Manag 31:2577–2583
Hassan SM, Garrison A (1996) Distribution of chromium spe-cies between soil and porewater. Chem Speciat Bioavailab 8(3–4):85–103
Haynes RJ, Murtaza G, Naidu R (2009) Inorganic and organic constituents and contaminants of biosolids: implications for land application. Adv Agron 104:165–267
Herter U, Kupper T, Ku¨lling D, Kaufmann U, Vonmoos A (2003) Risikoabscha¨tzung zur landwirtschaftlichen Abfalldu¨ngerverwertung. FAL, Zu¨rich
Herzel H, Adam C, Eicher N, Hermann L, Mallon J, Schaaf M, Stemann J (2015a) Sustainable sewage sludge management fostering phosphorus recovery and energy efficiency (P-REX)—comparative review of ash processes.http://p-rex. eu/uploads/media/P-REX_D4_1_Comparative_review_ of_ash_processes.pdf. Accessed 22 Feb 2017
Herzel H, Stemann J, Na¨ttorp A, Adam C (2015b) P-recovery technologies and products; P-REX. http://p-rex.eu/ uploads/media/2_P-REX_Recovery_Technolgies_ Amsterdam_Herzel.pdf. Accessed 22 Feb 2017
Hough RL, Booth P, Avery LM, Rhind S, Crews C, Bacon J, Campbell CD, Tomkins D (2012) Risk assessment of the use of PAS100 green composts in sheep and cattle pro-duction in Scotland. Waste Manag 32:117–130.https://doi. org/10.1016/j.wasman.2011.08.008
IFOAM (2017) Principles of organic agriculture.http://www. ifoam.bio/en/organic-landmarks/principles-organic-agriculture. Accessed 2 Jan 2017
Jones KC, de Voogt P (1999) Persistent organic pollutants (POPs): state of the science. Environ Pollut 100(1–3):209–221
Kabata-Pendias A (2011) Trace elements in soils and plants, 4th edn. CRC Press, Boca Raton