Confocal surface plasmon microscopy with pupil
function engineering
Bei Zhang, Suejit Pechprasarn, Jing Zhang, and Michael G. Somekh*
IBIOS, Faculty of Engineering, University of Nottingham, NG7 2RD, UK
Abstract: Surface Plasmon microscopy can measure local changes of refractive index on the micron scale. Interferometric plasmon imaging delivers quantitative high spatial resolution sensitive to refractive index. In addition the so called V(z) method allows image contrast to be controlled by varying the sample defocus without substantially degrading spatial resolution. Here, we show how a confocal system provides a simpler and more stable alternative. This system, however, places greater demands on the dynamic range of the system. We therefore use a spatial light modulator to engineer the microscope pupil function to suppress light that does not contribute to the signal.
©2012 Optical Society of America
OCIS codes: (180.0180) Microscopy; (110.0110) Imaging systems; (060.4080) Modulation; (120.0120) Instrumentation, measurement, and metrology.
References and links
1. M. G. Somekh, S. G. Liu, T. S. Velinov, and C. W. See, “Optical V(z) for high-resolution 2pi surface plasmon microscopy,” Opt. Lett. 25(11), 823–825 (2000).
2. M. G. Somekh, S. G. Liu, T. S. Velinov, and C. W. See, “High-resolution scanning surface-plasmon microscopy,” Appl. Opt. 39(34), 6279–6287 (2000).
3. L. Berguiga, S. J. Zhang, F. Argoul, and J. Elezgaray, “High-resolution surface-plasmon imaging in air and in water: V(z) curve and operating conditions,” Opt. Lett. 32(5), 509–511 (2007).
4. L. Berguiga, T. Roland, K. Monier, J. Elezgaray, and F. Argoul, “Amplitude and phase images of cellular structures with a scanning surface plasmon microscope,” Opt. Express 19(7), 6571–6586 (2011). 5. M. G. Somekh, G. Stabler, S. Liu, J. Zhang, and C. W. See, “Wide-field high-resolution surface-plasmon
interference microscopy,” Opt. Lett. 34(20), 3110–3112 (2009).
6. P. Torok, P. D. Higdon, and T. Wilson, “On the general properties of polarised light conventional and confocal microscopes,” Opt. Commun. 148(4-6), 300–315 (1998).
7. Q. Gong and S. S. Hsu, “Aberration Measurement using Axial Intensity,” Opt. Eng. 33(4), 1176–1186 (1994). 8. G. V. Beketov, Y. M. Shirshov, O. V. Shynkarenko, and V. I. Chegel, “Surface plasmon resonance spectroscopy:
prospects of superstrate refractive index variation for separate extraction of molecular layer parameters,” Sensor Actuat 48, 432–438 (1998).
9. Y.-J. Bao, R.-W. Peng, D.-J. Shu, M. Wang, X. Lu, J. Shao, W. Lu, and N.-B. Ming, “Role of interference between localized and propagating surface waves on the extraordinary optical transmission through a subwavelength-aperture array,” Phys. Rev. Lett. 101(8), 087401 (2008).
1. Introduction
It has been shown previously that a scanning heterodyne interferometric microscope with an oil immersion objective can be used for high resolution surface plasmon (SP) imaging [1–4]. The essential idea is that when the sample is moved above the focal plane of the objective there are two major contributions to the output signal one arising from the SP and the other arising from light directly reflected from the sample. As the sample is defocused the relative phase between these contributions changes leading to an oscillating signal whose period depends on the angle of incidence at which SPs are excited. More recently this idea has been extended to a wide-field configuration [5].
The problem associated with the interferometric configuration is that it places severe demands on system stability and in the case of the heterodyne system acousto-optic modulators and associated electronics are required. In a scanning interferometer the interference signal is recovered from the product of the returning field in the back focal plane
#162169 - $15.00 USD Received 26 Jan 2012; revised 9 Mar 2012; accepted 9 Mar 2012; published 15 Mar 2012
(BFP) and the reference beam so that this signal is proportional to the integral of the reflected field (assuming a uniform reference beam). An ideal confocal system is also dependent on the integral of the field returning from the sample. This can be easily understood by realizing that that the lens A of Fig. 1(a) performs a Fourier transform between the BFP and the pinhole plane. The signal on the axis of the pinhole plane is therefore proportional to the DC or average value of the field in the BFP which is, in turn, is proportional to the integral of the field in the BFP. Since the detected field is proportional to intensity, the output depends on the square of the integral of the field which gives reduced contrast as discussed in sections 3 and 4. This paper will discuss the design and implementation of a confocal configuration for SP microscopy.
2. Experiment setup
2.1 General setup
The scanning heterodyne interferometer [1–3] involves a separate reference and sample arm which places severe demands on system stability. The confocal SP system offers a more compact and stable alternative which is compatible with commercial instruments. Figure 1(a) shows the concept behind the confocal system; the sample is illuminated over a wide range of angles (controlled by the SLM of Fig. 1(b)), however, when it is defocused the major contributions to the signal arise from the paths P1 and P2. Path P1 involves light incident and reflected close to normal incidence and path P2 comprises light incident at the angle for excitation of SPs, this generates SPs at position ‘a’; this couples back to light at all positions, however, in the confocal system only the light appearing to come from the focus (reradiating at ‘b’) passes through the pinhole. Of course, SPs excited at ‘b’ and reradiate at ‘a’ make a similar contribution. Figure 1(b) shows a simplified schematic of the optical system. A 632.8nm He-Ne laser (10mW) was used as the illumination source. Beam expanders were used to increase the beam diameter of the beam incident onto the spatial light modulator (SLM) which was conjugate with the BFP of the immersion objective. The SLM was used to control the effective illumination pattern in the BFP. A pellicle beam splitter was used to separate illumination and imaging paths. The microscope objective used in this study was a 1.25 NA oil immersion objective, which had sufficient aperture to excite SPs in air. The light distribution reflected from the sample was imaged onto the CCD camera which served as a variable pinhole. The light from the sample was magnified by approximately 1000 times from the sample to the CCD plane so that a point spread function occupied >100 pixels, this allowed the pinhole radius to be readily controlled by selecting different regions of camera, moreover, spreading the returning beam reduced the problem of saturating individual pixels.
#162169 - $15.00 USD Received 26 Jan 2012; revised 9 Mar 2012; accepted 9 Mar 2012; published 15 Mar 2012
Fig. 1. (a) Conceptual diagram of SP confocal microscope; (b) simplified schematic diagram of the experiment setup
Samples were mounted in the 3-dimensional (3D) scanning system, which consisted of a 3axis mechanical stage drive, piezoelectric actuators (P621.1CD, Physik Instrumente) stage and (P-541.2CD, Physik Instrumente) giving 1 and 2 axes of movement respectively. The SLM, PZT stages and camera were controlled by software based on LABVIEW and all data were processed with MATLAB. Samples were prepared by coating gold with or without BSA on cover glasses; 2nm chromium was coated between gold and cover glasses to improve the adhesion.
2.2 Pupil function modulation procedure
The pattern from the SLM (Forth DD, SXGA-R5) was imaged onto the BFP of the objective to modulate the pupil function of the scanning system. SXGA-R5 is a fast switching, all digital, high resolution, and 24-bit native color depth reflective micro display. It is designed to control the reflected intensity distribution by varying the illumination time of the reflected light; this approach works well when viewing an intensity image. For this application, however, we need to interfere different portions of the light reflected from the sample so that all parts of the beam need to be on for the same time. We therefore use binary patterns on the SLM so that each region is either ‘off’ or ‘on’ and we effected the gray scale modulation of the pupil function by changing the density of ‘on’ pixels. For instance, for a region where a specific intensity is required we select pixels with a random number generator with a probability proportional to the weighting required for the pupil function in the desired region. In effect, we have used the fact that there are large numbers of pixels in the SLM (1280 by 1024) to replace temporal modulation with spatial modulation. Measurements can be repeated
with different pupil functions to average out the randomness in the pupil functions, in practice, however, this was not found to be necessary.
3. Theory of V(z) and its simulation
3.1 Theory
The output signal from a confocal microscope with a small pinhole can be written, with a simple modification of the formulation given for the heterodyne interferometer [2] as:
( ) ( )
( ) ( )
max 2
2 2
0 0
( ) ( ) ( ) ( ) exp 2 cos
s
co in out p s
I z V z P s P s r s r s jnkz dsd
π
α φ β φ θ φ
= =
∫ ∫
+ (1)#162169 - $15.00 USD Received 26 Jan 2012; revised 9 Mar 2012; accepted 9 Mar 2012; published 15 Mar 2012
Where Ico(z) is the output signal as a function of defocus, z. V(z) is the field as measured in an
interferometer. Pin and Pout are the input and output pupil functions as a function of s, the sine
of the incident angle, θ. rp(s) and rs(s) are the complex amplitude reflection coefficients for
p-and s- polarizations respectively. α(φ) and β(φ) represent the variation of the proportion of
p-and s- polarized light respectively as a function of azimuthal angle, φ; for linear input polarization (and copolar detection) α(φ) = cos2(φ) and β(φ) = sin2(φ), for radial α(φ) = 1 and β(φ) = 0. n is the refractive index of the immersion oil, and k is 2p/λ, where λ is the free space wavelength of the light. The true confocal response can be regarded as a coherent response since it is formed as the integral of a field; however, for finite size pinholes the response becomes partially coherent and cannot be written as a single field or intensity integral. Apart from the squaring effect there is one other difference between the interferometric and confocal response. The reference beam in an interferometer acts as a polarizer so only copolar components are detected, if there is no polarizer before the pinhole in the confocal system then cross polar components can also be detected. The total intensity detected is therefore the sum of copolar and cross polar, Icr(z) contributions
( )
( )
( )
tot co cr
I z =I z +I z (2)
Where the Icr(z) is given by Eq. (1) with α φ
( )
=β φ( )
=12sin 2φ. For a point pinhole thecrosspolar terms disappear [6], and increase as the pinhole is opened.
3.2 Simulation results
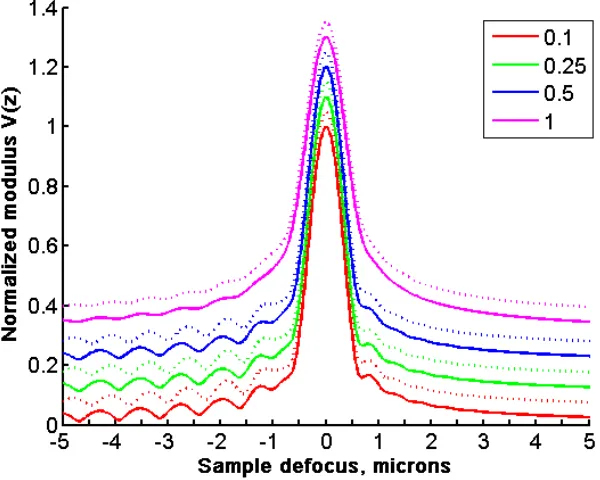
Figure 2 shows simulation results obtained for the confocal system as a function of defocus for different diameters of pinhole. From the curve we note the periodic ripple for negative defocus characteristic of the interference between two optical paths (P1 and P2) of Fig. 1(a). We can see that path P2 shows light exciting SPs at position ‘a’ and reemitting at ‘b’, now clearly the SPs will reradiate continuously along the sample, however, the presence of the pinhole means that only those that appear to come from the focus pass through the pinhole. This leads to a characteristic periodicity of the ripple, ∆z, given by Eq. (3):
(
)
2 1 cos p
z n λ θ ∆ = − (3)
Where θp is the angle for optimum excitation of SPs. Eq. can be obtained by considering the
phase difference between plane waves incident at normal incidence and one propagating at θp
or an identical expression can be obtained by tracing the ray paths of P1 and P2 noting that when the light is converted to an SP the appropriate propagation vector needs to be incorporated.
The confocal arrangement thus serves to define the path of the SPs. As the pinhole becomes wider SPs emitted from different positions are detected and we would expect the ripples become less well defined as can be seen from the simulation results in Fig. 2. It can be seen that for a pinhole radius less than 0.25 of the radius of the main lobe of an Airy disc the response is almost the same as the ideal confocal case with a point pinhole. For values of 0.5 the ripples become less distinct almost disappearing when the pinhole is equal to the radius of the Airy disc. The plots of Fig. 2 include both copolar and cross polar components as described by Fig. 2, however, the effect of the cross polar term for pinhole diameters less than 0.5 was considerably less than 1% of the total signal.
The dashed curves of Fig. 2 show the same situation with a 10nm coating of index 1.5, we can see that the period of the ripples changes allowing the local refractive index of the layers to be determined. It should be noted in order to see the lower levels in Fig. 2 clearly, the plots of Fig. 2 show V z
( )
or I z( )
which is, of course, what is measured in an interferometer but in the confocal arrangement we detect the square of this quantity which means that the range#162169 - $15.00 USD Received 26 Jan 2012; revised 9 Mar 2012; accepted 9 Mar 2012; published 15 Mar 2012
of signals between the peak value and the ripples will be much greater, in section 4 we will discuss the use of different pupil functions that reduce the range of signals and enhance the ripples relative to the peak signal. Throughout this paper we plot the magnitude of the field rather than the measured intensity for clarity.
Fig. 2. Simulated V(z) curves for different pinhole diameter. Solid curve 50nm bare gold, dashed curves gold with 10nm overlayer with refractive index 1.5. Each pinhole diameter is displaced by 0.1 on the y-axis and curves corresponding to the overlayers are displaced by a further 0.05 on the y-axis. Pinhole radii are defined in terms of radius of Airy disc radius (0.61λ/NA) are shown in the legend.
4. Experimental results
4.1 Effect of V(z) with different pinhole radii
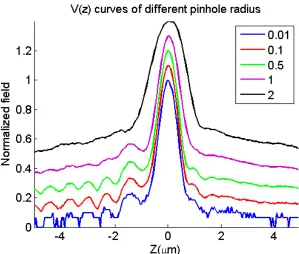
Figure 3 shows experimental V(z) curves obtained from a coverslip that was coated with 50nm gold and 2nm chromium. For the large pinhole diameters the system has the same transfer function as a wide-field imaging system and the ripples are not observed; as can be seen in the simulations of Fig. 2. For very small pinhole diameters the SNR is poor since little light is detected, so a suitable compromise between satisfactory confocal response and good SNR is, for pinhole size between 0.1 and 0.5 of the Airy disc; similar to the values used in most conventional confocal imaging experiments.
#162169 - $15.00 USD Received 26 Jan 2012; revised 9 Mar 2012; accepted 9 Mar 2012; published 15 Mar 2012
[image:5.612.149.449.138.378.2]Fig. 3. Experimental V(z) curves on 50nm gold sample for different pinhole radii
Figure 3 demonstrates that V(z) effect is periodic with a period of 741nm close to the expected value of 752nm, however errors in film thickness and properties and also changes in the pupil function [3] account for this difference. This effect is discussed further in section 4. A systematic error in absolute period does not prevent the measurement of very small changes, which is the primary purpose of most SP sensors. Figure 3 also shows that the contrast is low and to this end we discuss the effect of pupil function engineering to mitigate this problem.
4.2 Modulation of pupil function
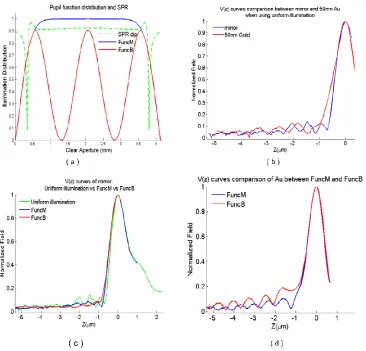
For a confocal system, it is expected that even if the sample is just a pure mirror, V(z) curve still presents some oscillatory behavior which arises from the edges of the pupil function [7]. The experimental results (Fig. 4(b)) show that the period is approximately 559nm, and the strength of the signal is also about 15%, which means that when using uniform illumination, it is difficult to obtain a good quantification.
#162169 - $15.00 USD Received 26 Jan 2012; revised 9 Mar 2012; accepted 9 Mar 2012; published 15 Mar 2012
Fig. 4. Effects of different pupil functions on recovered V(z) for mirror and gold samples. (a) Pupil function distributions. Green dashed curve shows the p-polarization reflection coefficient with respect to the aperture of the microscope object. This shows the SP dip relative to the objective aperture. The blue (FuncM) and red (FuncB) curves show the modified pupils to optimize contrast and reduce oscillations due to hard cut off in the lens aperture. (b) V(z) comparison between mirror and 50nm Au when using uniform illumination. (c) V(z) curves from a mirror using uniform, FuncM, and FuncB pupils. (d) V(z) curves of 50nm gold by FuncM and FuncB pupil functions.
Both the theory and simulation results show that the oscillatory behavior arises from the sharp edge of the pupil function. Clearly, the effect of this edge obscures the ripples due to SPs, however, it also affects the period of the ripple as determined by Eq. (3). This expression is obtained by calculating the phase difference between paths P1 and P2 in Fig. 1(a), the oscillatory behavior obtained with a plane mirror means that additional ray paths effectively lead to a phase variation that does not simple change with defocus as 2kz. A reference beam whose phase does not vary in a perfectly linear fashion will also lead to variations in the measured period when SPs are present; it will not affect, however, the detection of SPs just the absolute quantification. In order to overcome this problem and also to increase the relative size of the SP contribution, pupil function modulation by a SLM was used and two functions to smooth the patterns on the BFP are discussed, we name these FuncM and FuncB (Fig. 4(a)). The experimental results show that the two functions work well in the system and can be used to reduce the ripples due to the pupil function, see Fig. 4(c). We can also see that reducing the background signal in the angular range between normal incidence and the region
#162169 - $15.00 USD Received 26 Jan 2012; revised 9 Mar 2012; accepted 9 Mar 2012; published 15 Mar 2012
where SPs are excited greatly improves the SP contrast; this can be clearly seen from the comparison between FuncM and FuncB in Fig. 4(d).
4.3 Grating image
In order to demonstrate that the technique can be used for spatially resolved measurements, a protein, bovine serum albumin (BSA) grating (Fig. 5) was imaged. BSA is a typical biological protein with effective refractive index of BSA on gold surface is about 1.4 [8]. In this experiment, the BSA was fabricated on coverslips (refractive index 1.52) coated with 50nm gold and the period was 25 µm, where the BSA occupying 10 µm. The AFM measurement results show that the thickness of the grating was approximately 30nm.
coverslip
Gold
BSA
10
15
[image:8.612.213.401.189.278.2]Air
Fig. 5 BSA grating structure.
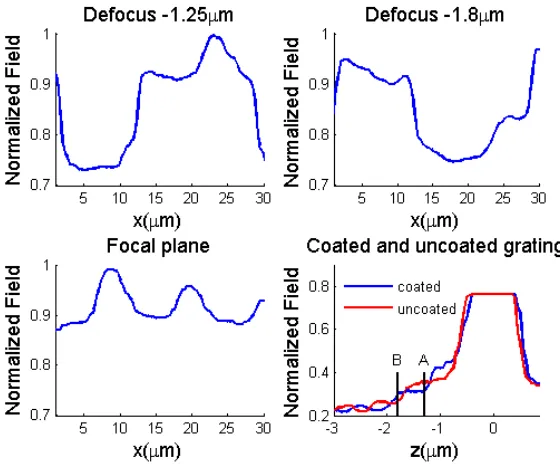
Figure 6 shows the 1D line traces of the BSA grating when the defocus distances are −1.25 µm (top left), −1.8 µm (top right) and at the focal plane (bottom left) respectively. It can be seen that the images at defocus −1.25 µm and at −1.8 µm are inverted, which can be easily explained by the bottom right figure, with different defocus (say position A and B), V(z) values of coated and uncoated grating are inverted.
At the focal plane the grating
contrast is extremely poor. It should be mentioned that at the focal plane, the
intensity is much larger than the values when the sample is defocused. In
order to get better contrast for the defocused values the light level was
increased which saturated the signal at focus, which accounts for the
saturation seen in
Fig. 6(d), of course,
Fig. 6(c)was taken at the lower power
level where the focal distribution was unsaturated.
#162169 - $15.00 USD Received 26 Jan 2012; revised 9 Mar 2012; accepted 9 Mar 2012; published 15 Mar 2012
Fig. 6. 1D grating images with different defocuses. Bottom right shows V(z) curves on coated and uncoated regions explaining contrast reversal.
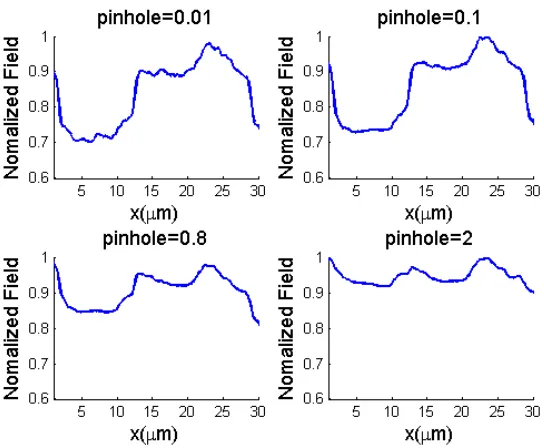
Figure 7 shows the 1D images of the BSA grating using different pinhole radii. It can be seen that contrast varies with the pinhole radius. When the normalized pinhole radius is 2, that is essentially, the conventional scanning microscope, the shape of the grating almost vanishes. With smaller pinhole radius, like 0.8, the grating shape can be recognized but with lower contrast; while the radius shrinks to 0.1 or 0.01, the image can be obtained with better contrast. For the very small pinhole radius of 0.01 the SNR is poorer than 0.1 as expected although the values are still acceptable. We can see than confocal imaging gives greatly improved contrast and quantification. The polarization direction of the illumination was along the grating fringes.
#162169 - $15.00 USD Received 26 Jan 2012; revised 9 Mar 2012; accepted 9 Mar 2012; published 15 Mar 2012
Fig. 7. One dimensional grating images at −1.25µm defocus using different pinhole radii.
5. Conclusion
This paper has demonstrated the feasibility of using a confocal arrangement to perform localized measurement of SP propagation. We have examined the effect of pinhole diameter and also shown the effects of different illumination pupil functions. The method offers an alternative to interferometric SP imaging which is simpler and more stable, and perhaps the most significant advantage is that is can be incorporated into a conventional confocal microscope with minimal adaptation. The use of alternative input polarization states will provide a useful extension of the technique. It will be interesting to apply the technique proposed here on structured plasmonic surfaces [9] which are expected to give improvements in sensitivity to local variations in refractive index.
Acknowledgments
The authors gratefully acknowledge the financial support of the Engineering and Physical Sciences Research Council (EPSRC) for a platform grant, ‘Strategies for Biological Imaging’, and also the UK and China Scholarship Council (CSC) for Bei Zhang’s Scholarship. We thank Dr. Han-min Tan for sample fabrication and BZ thanks Dr. Mark Pitter for guidance in optical imaging techniques.
#162169 - $15.00 USD Received 26 Jan 2012; revised 9 Mar 2012; accepted 9 Mar 2012; published 15 Mar 2012