Sperm whale echolocation behaviour reveals a directed, prior-based
search strategy informed by prey distribution
Fais A.1*, Aguilar Soto N.1, Johnson M.2, Pérez-González C.3, Miller P. J. O.2 and Madsen P.T.4,5 1) BIOECOMAC. Dept. Animal Biology. La Laguna University. Canary Islands, Spain 2) Scottish Ocean Institute. University of St. Andrews. Scotland
3) Dept. of Statistics, Op. Res. and Computation. La Laguna University. Canary Islands, Spain
4) Zoophysiology, Department of Bioscience. Aarhus University. Denmark
5) MUCRU, Centre for Fish, Fisheries and Aquatic Ecosystems Research, School of Veterinary and Life Sciences, Murdoch University,
Running title: sperm whale echolocation
*Email of corresponding author: [email protected]
1
2
3
4
5
6
7
8
9
10
11
12
13
14
15
16
17
18
19
20
21
22
23
Abstract
Predators make foraging decisions based upon prior and sensory information about
resource availability, but little is known about how large, air-breathing predators collect
and use such information to maximize energy returns when foraging in the deep sea.
Here we used archival tags to study how echolocating sperm whales (Physeter macrocephalus) use their long-range sensory capabilities to guide foraging in a deep-water habitat consisting of multiple, depth-segregated prey layers. Sperm whales
employ a directed search behaviour by modulating their overall sonar sampling with the
intention to exploit a particular prey layer. They forage opportunistically during some
descents while actively adjusting their acoustic gaze to sequentially track different prey
layers. While foraging within patches, sperm whales adjust their clicking rate both to
search new water volumes as they turn and to match the prey distribution. This strategy
increases information flow and suggests that sperm whales can perform auditory stream
segregation of multiple targets when echolocating. Such flexibility in sampling tactics in
concert with long range sensing capabilities apparently allow sperm whales to
efficiently locate and access prey resources in vast, heterogeneous, deep water habitats.
Keywords: sperm whales; echolocation behaviour; directed search behaviour; prior
information; multi-target acoustic scene 25
26
27
28
29
30
31
32
33
34
35
36
37
38
39
40
41
42
43
44
Introduction
When searching for resources such as food, the optimal strategy is determined both by
resource distribution and by the sensory and movement capabilities of the searching
animal (Bell 1991). Time-efficient prey search and selection strategies are particularly
beneficial for predators with short, but intense foraging periods as is the case for
air-breathing marine predators that must access two vital, but spatially separated resources:
air at the surface and food at depth (Kramer 1988). Several air-breathing marine animals
show anticipatory diving strategies, using environmental information as priors to
strategically accommodate foraging behaviour. For example, Adélie (Pygoscelis adeliae) and Macaroni (Eudyptes chrysolophus) penguins adjust the time devoted to transit between the surface and the foraging depth according to the foraging success of
the previous dive (Ropert-Coudert et al. 2001; Sato et al. 2004). A steep descend enables
a direct transport to the prey patch depth, whereas descending at shallow angles allows
extending the search for resources to a broader swath of the water column (Sato et al.
2004). Moreover, Magellanic penguins (Spheniscus magellanicus) adapt pre-surfacing periods and vertical speeds to foraging depth, showing prey predictability (Wilson
2003). Gallon and colleagues (2007) demonstrated that grey seals (Halichoerus grypus) anticipate dive performance by adjusting swim speed to resource accessibility in order
to spend more time within the prey patch.
The spatial extent of the environment from which an animal can extract information
is defined by the animal’s sensory volume (Lima and Zollner 1996), which in turn
influences the search effort required to locate resources (Zollner and Lima 1999). Most
animals use passive sensing (Nelson and MacIver 2006) to assess environmental
parameters via intrinsic visual, chemical, or auditory cues. In contrast, animals using
active sensing, such as electrolocation or echolocation, emit energy to probe their 46
47
48
49
50
51
52
53
54
55
56
57
58
59
60
61
62
63
64
65
66
67
68
69
environment (Nelson and MacIver 2006). As such, echolocators gather sequential, but
high resolution information about prey distribution via echoes returning from
backscattering targets ensonified with echolocation pulses (Madsen and Surlykke 2013).
Studied species of echolocating bats and toothed whales adjust their clicking rates,
and thus their active acoustic gaze (Wisniewska et al. 2012), to match the characteristics
of the environment (Moss and Surlykke 2001; Schnitzler et al. 2003), the range to
targets of interest (Au and Benoit-Bird 2003; Moss and Surlykke 2010), the density of
prey (Madsen et al. 2005) and the rate at which new sensory volumes are encountered
(Madsen et al. 2013). Echolocation clicks are typically produced at intervals that are
longer than, but often related to, the two-way travel time (TWT) of the sound to the
target of interest and back (Au 1993). This makes the inter-click interval (ICI) a useful
indicator of the upper bound of the sensing range of an echolocator, i.e. ICI is a proxy
for the range over which the animal is focusing its attention (Wisniewska et al. 2012).
The range over which echolocators can detect prey depends upon the source
parameters of their biosonar pulses, the reflectivity of prey and the clutter and noise
conditions in the habitat. An extreme example is the sperm whale (Physeter macrocephalus) whose hypertrophied nasal complex can generate source levels in excess of 230 dB re 1µPa (peak-peak) (Madsen et al. 2002b; Møhl et al. 2003), enabling
search ranges for prey aggregations that may exceed water depth in their deep habitat
(Madsen et al. 2007). This implies that, in typical ambient noise conditions, sperm
whales may be able to search a large proportion of the water column for prey patches at
the start of each foraging dive and so minimize time and energy spent searching for
prey, perhaps accounting for their success as a cosmopolitan, mesopelagic predator
(Madsen et al. 2002a; Watwood et al. 2006). Male sperm whales off northern Norway
exhibit a varied diving behaviour, switching between different prey resources over a 71
72
73
74
75
76
77
78
79
80
81
82
83
84
85
86
87
88
89
90
91
92
93
94
wide range of water depths (Teloni et al. 2008). This provides a unique opportunity to
uncover whether sperm whales perform random or directed prey search, and how they
modify their echolocation sampling both to locate and access spatially separated food
resources in the water column and to efficiently locate individual prey once within a
patch.
Here we use sound and movement recordings tags (DTags) to study the echolocation
behaviour and search tactics of such male sperm whales, showing that, despite the long
sensing range of their biosonar, sperm whales use prior information to guide their
foraging within a dive. This directed prey search strategy may explain the high foraging
returns (Santos et al. 1999) achieved by this large air-breathing predator inhabiting the
deep waters of all oceans.
Methods
Data collection
Field work was performed in the general area of Andøya underwater canyon off
Andenes, Norway. Sperm whales were tagged with high-resolution digital archival tags
(DTag2), which include a hydrophone, a depth sensor, and 3-axis accelerometers and
magnetometers (Johnson and Tyack 2003). Sounds were recorded with 16–bit resolution
at a sampling rate of 96 kHz. Orientation and depth sensors were sampled at 50 Hz and
decimated to 5 Hz for analysis. In three research cruises performed in the summers of
2005, 2009 and 2010, surfacing whales were approached in an inflatable boat for
tagging. Tags with four suction cups were deployed using a cantilevered pole or a
handheld pole onto the dorsal surface of the whales. The tags released after a
programmed interval and floated to the surface where they were located by VHF radio
tracking. Four sperm whales were tagged in July 2005, one animal in June 2009 and 96
97
98
99
100
101
102
103
104
105
106
107
108
109
110
111
112
113
114
115
116
117
118
three in May 2010. All tag-data analyses were performed with custom scripts in Matlab
7.5 (Mathworks).
Orientation and depth
Pitch and heading angles were derived from the accelerometers and magnetometers of
the tag following Johnson and Tyack (2003). These angles were used to estimate the
orientation of the whales with respect to the navigation frame (Miller et al. 2004b), and
to determine their turning rate sensu Madsen et al. (2013). To separate surface intervals and shallow silent dives from foraging behaviour, we defined foraging dives as those
deeper than 25 m (i.e. about 1.5 body lengths Teloni et al. (2008)) and containing
echolocation clicks. Within each dive, the descent, bottom and ascent phases were
defined by changes in the sign of the pitch angle of the whale (sensu Miller et al. 2004a) lasting at least five seconds.
Clicks, clicking and buzzing
Sounds produced by tagged whales and nearby animals were identified in tag recordings
using spectrograms (512 point FFT, Hann window, 50% overlap). Individual clicks were
detected using a supervised click detector (Møhl et al. 2003, Madsen et al. 2002a).
Clicks from tagged whales were recorded with a consistently high received level (RL)
and thus were easily distinguished from the lower and variable RL clicks from
conspecifics (Zimmer et al. 2005). For each dive, the beginning and end of the clicking
phase (termed start of clicking, SOC, and end of clicking, EOC, respectively) were 120
121
122
123
124
125
126
127
128
129
130
131
132
133
134
135
136
137
138
139
140
141
142
located demarcating the interval when whales are searching for prey with echolocation
(Zimmer et al. 2005). Following Teloni et al. (2008), a buzz was defined as a series of
clicks with inter-click intervals (ICIs) < 0.1 s, bracketed by ICIs above 0.22 s. As the
ICI generally changes rapidly at the start and end of buzzes, the precise value of this
threshold had little impact on the timing of buzz starts and ends. To avoid including
slow clicks (an infrequent click type with a presumed communication function (Oliveira
et al. 2013)) in the analyses, only ICIs < 2.5 s were considered. The time-delay between
consecutive buzzes within a dive (the inter-buzz interval, IBI) was defined as the time
between the last click of a buzz and the first click of the following buzz.
Altitude
The altitude of the whale above the sea-floor was obtained from bottom echoes
generated by the clicks of the whales and recorded by the tags (Thode et al. 2002,
Zimmer et al. 2003). Bottom echoes were located using echograms (Figure 1; see
Arranz et al. 2011) constructed from 3.5 s sound segments synchronized to each
out-going click. These enabled detection of sea-floor echoes at ranges up to 2580 m from
the whale assuming an average sound speed of 1475 m/s in this roughly iso-velocity
region (Teloni et al. 2008). Echoes from the sea-floor appeared within the echograms as
sequences of reverberant echoes with slowly varying two-way travel time (TWT). The
TWT/2 was multiplied by 1475 m/s to estimate the altitude of the whale above the
sea-floor, which was then added to the whale depth to estimate the sea-floor depth. To
estimate altitude over short intervals in which no echoes were detected, the sea-floor
depths for a whole dive were interpolated using a Kalman filter and Rauch smoother
(Bar-Shalom et al. 2004) with water depth and depth-rate as states.
Statistics 144
145
146
147
148
149
150
151
152
153
154
155
156
157
158
159
160
161
162
163
164
165
166
Log transformations were donefor non-linear relations between continuous variables.
Post hoc analysis in R (R Development Core Team 2012) was used to examine the influence of individuals on the relationships between response and regressor variables.
Individual was included both as a dummy independent variable and as an interaction
term with the primary independent variable. The regression model was bootstrapped by
treating the regressors as random and selecting bootstrap samples directly from the
observations, taking for each individual the same size of samples as in the original data
set. The regression coefficients were calculated using a robust estimator (Tukey´s
biweight) in each bootstrap. To test if the regression coefficient of the interaction term
varied across individuals, their bootstrap confidence intervals were calculated using a
bias-corrected method (Fox 2002).
To compare means of variables across dive depths, the software PRIMER was used
together with distance-based permutational ANOVAs (PERMANOVA). Post hoc pair tests were performed for detected significant differences across grouping factors.
Distance-based multiple regression was performed with the DISTLM routine included
in PRIMER to assess the relationship between initial clicking after buzzing, IBI and
turning rate. In all these analyses, permutation F-tests were applied, which enable us to
obtain the corresponding p-values avoiding assumptions about the data distribution
(Anderson and Braak 2003).
Results
A total of 144 hours of combined acoustic and movement data were collected from eight
physically mature (>12 m) male sperm whales, providing a dataset of 175 complete
foraging dives (Table 1). Foraging dives were performed to depths from 48 to 1862 m,
alternating, in some cases, between shallow and deep dives within a few hours (Figure
2A). During shallow dives the whales targeted predominantly epipelagic prey and 168
169
170
171
172
173
174
175
176
177
178
179
180
181
182
183
184
185
186
187
188
189
190
191
during deep dives the whales mostly foraged benthopelagically (Figure 2). Judging by
the depth at which buzzes occurred, the tagged whales encountered prey in three broad
depth layers. The slope changes of a survivor plot of buzz depth defined these layers as:
(1) shallow prey, i.e. <220 m; (2) medium, between 220 and 700 m; and (3) deep prey
>700m (Figure 2B). Regardless of which prey layer the whales exploited, foraging
dives were typically U-shaped, consisting of steep descent and ascents bracketing a
relatively horizontal bottom phase (Figure 2A).
Using prior information: expectations of vertical prey distribution
The choice of prey layer(s) within which to invest time during each dive may depend
upon both (1) prior information obtained during preceding dives, and (2) sensory
feedback during the descent phase of the current dive. The usual clicks from the tagged
whales were consistently clipped in the recordings, therefore the analyses focused on
signal timing, rather than level. The depth at which whales begin searching for prey
(echolocating) in a dive, together with the initial ICI, are strong indicators of the depth
range within which they expect to find prey before getting updated information via
echolocation (Thode et al. 2002; Zimmer et al. 2003). If sperm whales rely primarily on
sensory information gained during the descent to decide on where to forage, they should
sample the entire water column, or at least the depth range over which prey can be
detected, beginning early in the dive. Alternatively, if choices are based on prior
experience, whales do not need to begin sampling until they have descended closer to
their previously chosen target layer. Following the same reasoning, a short initial ICI is
expected when whales target a nearby food resource.
The depth at which sperm whales started searching for prey, i.e., the SOC depth, was
compared with: (1) the median buzz depth of the dive, and (2) the mean ICI of the first
ten clicks in that dive. The median buzz depth was a robust indicator of the main depth 193
194
195
196
197
198
199
200
201
202
203
204
205
206
207
208
209
210
211
212
213
214
215
216
layer eventually targeted during a dive, while the mean ICI of the first ten clicks was a
proxy for the initial maximum inspection range. The depth of SOC varied widely, from
3 to 215 m. Pooling the data from all whales (n=175 dives), there was a significant
linear relationship between the median buzz depth and the SOC depth (Spearman’s ρ:
0.89, p<<0.001, n=161 dives with buzzes, 8 whales) (Figure 3A), revealing that sperm
whales started clicking later when foraging on deep prey (Figure 3B). The initial ICI
(inspection range) and the SOC depth were also significantly positively correlated
(Spearman’s ρ: 0.81, p<<0.001, n=175 dives, 8 whales) (Figure 3C), with whales
clicking faster at the start of shallower dives (Figure 3D).
Sampling strategies during descents
Once whales have started clicking and thus may have gained new information about
prey distribution during their current dive, it is expected that they will adapt their
acoustic sampling to track either the current location of prey or the furthest limit of
inspection, i.e., the sea-floor for a steeply descending whale. We assume that the ICIs of
the tagged sperm whales exceed the TWT to the target of interest, as observed in small
toothed whales studied in the wild (Madsen et al. 2013) and in captivity (Wisniewska et
al. 2012). If a whale is sampling the full water column, the ICI should exceed the TWT
from the whale to the sea-floor to avoid range ambiguity from this strong reflector, and
should reduce accordingly as the whale descends so as to track the sea-floor (Thode et
al. 2002). Alternatively, if attention is focused on a closer prey layer, a shorter ICI that
decreases as the whale approaches the layer is expected (Zimmer et al. 2003). To test
these hypotheses, the ICI during the descent phase was compared with: (1) the TWT to
the sea-floor and (2) the TWT to the closest indication of where prey were expected or
actually encountered, i.e., the depth at the end of the descent phase or the depth of the
first buzz, whichever occurred earlier. 218
219
220
221
222
223
224
225
226
227
228
229
230
231
232
233
234
235
236
237
238
239
240
241
Sea-floor echoes were found in 170 dives. Visual inspection of the data showed two
distinct ICI patterns (Figure 4). Dives to depths < 1200 m (n=158, 8 individuals) had
widely varying ICIs throughout the descent (mean ICI: 0.84 s; std 0.22) that did not
appear to consistently track either targeted prey layers (Spearman’s ρ=0.13) or the
sea-floor (Spearman’s ρ=0.02) (Figure 4A-D). There were few buzzes (median of 1) during
the descent phase in these dives, only occurring in 40 of 158 dives near the end of the
descent.
In contrast, in all dives exceeding 1200 m (n=17, 3 individuals), whales produced
distinctive sawtooth-patterned ICIs during descents, comprising intervals with
consistently decreasing ICIs bracketed by occasional step increases (Figure 4E and F).
This pattern indicated that the ICI was tracking different depth layers between 500 and
1300 m sequentially throughout the descent, evidenced by the depth of the acoustic gaze
during the descents as exemplified in Figure 4E. On average one quarter of the buzzes
in these deep dives were produced during the descent phase, with the depth of buzzes
consistently coinciding with the layer previously tracked by echolocation (Figure 4E).
In all 17 deep dives, the final tracked depth layer coincided with the sea-floor. During
much of the bottom phase of these dives the three whales foraged within the benthic
boundary layer (nominally 0-200 m above the sea-floor, (Angel and Boxhall 1990): 119
of 274 buzzes with bottom echoes 60 s before or after each buzz (sensu Arranz et al. 2011) occurred less than 200 m from the sea-floor. All of these deep dives were
performed by whales 199a-c which were tagged on the same day and in the same area,
confounding evaluation of whether the ICI tracking is specific to deep dives or pertains
to a particular prey type or location. Lack of ICI tracking during descents of shallower
dives performed by the same whales (n=39) suggests the behaviour is only beneficial
during deep dives which may pass several depth layers of prey. 243
244
245
246
247
248
249
250
251
252
253
254
255
256
257
258
259
260
261
262
263
264
265
266
Search within the prey layer
Assuming that a new prey is targeted during each buzz (Wisniewska et al. 2012a;
Madsen et al. 2013), the time lapse between consecutive buzzes (i.e., the inter-buzz
interval, IBI) gives an indication of how frequently prey are encountered. The median
IBI was 171 s (IQR 95-354 s) for shallow dives (< 220 m dive depth), 17 s (8-54 s) for
medium (220-700 m) dives, and 36 s (21-59 s) for deep (> 700 m) dives. Although
significant differences across individuals were found (PERMANOVA, p<0.01, n=615),
IBIs were longer during shallow dives than in medium and deep dives (PERMANOVA,
p<0.05, n=615).
After finishing a buzz, sperm whales reopened their sensory volume by increasing
the ICI of subsequent regular clicks. To test whether this ICI was adapted to their
perception of how closely prey were spaced (Madsen and Surlykke 2013), the mean ICI
of the ten first clicks after each buzz was used as a proxy for the maximum inspection
range used by the whale when attempting to locate the next prey, and was compared
with: (1) the time to the next buzz (IBI), and (2) the mean turning rate over the first five
seconds after each buzz. The IBI is a proxy for prey density within the prey layer, while
the turning rate is an indicator of patchiness: for the whale to remain within a small
patch, it must turn at a high rate following each buzz (Madsen et al. 2013). The
relationship between initial clicking rate and IBI was significant (Spearman’s ρ: 0.58,
p<<0.001, n=615, 8 whales), but given the r2 value of 0.34 (Figure 3E) other factors also contributed to the ICI variation. Turning rate similarly explained some 30% of the ICI
variation, showing a significant negative correlation that was followed by all whales,
although with different slopes (Spearman’s ρ: -0.5, p<<0.001, n=615, 8 whales; Figure
3F). No strong correlation between turning rate and IBI was found (r2=0.1, Spearman’s ρ:-0.3, p<<0.001, n=615, 8 whales), thus, a multiple linear regression analysis was 268
269
270
271
272
273
274
275
276
277
278
279
280
281
282
283
284
285
286
287
288
289
290
291
performed to determine the variation in ICI explained by both predictor variables. The
overall model fit was r2=0.45.
Echolocation during ascents
In most dives (165 of 175 foraging dives), sperm whales did not stop clicking until near
the end of the ascent phase, regardless of the prey depth-layer targeted during the dive.
Whales switched to shallower dives after approximately 30% and 57% of medium
(n=21) and deep (n=12) dives, respectively (Figure 2). In dives <1200 m (n=158)
sperm whales performed buzzes during the ascent phase of 26 dives, with a median of 1
buzz. In contrast, in dives >1200 m (n=17) whales produced around 17% of the total
buzzes while ascending. As a result, prey capture attempts occurred over a wide depth
range in the deepest dives (Figure 2).
Discussion
For animals exploiting patchy resources, prior experience may be an important source
of information to guide search behaviour (Dall et al. 2005). Nevertheless, it seems
reasonable that expectations should be less important for predators such as sperm
whales that are uniquely able to gather real-time information about the distribution of
resources over long distances. This study investigated how such an animal with
long-range sensory capabilities combines both current information and priors to exploit
spatially segregated prey resources. We show that sperm whales rely upon information
obtained during previous dives to decide where to invest searching and foraging effort
in the next dive. In the following we discuss how these top predators modulate their 293
294
295
296
297
298
299
300
301
302
303
304
305
306
307
308
309
310
311
312
313
314
sensor sampling rate to the variable distribution of their prey in a directed search
enabling them to collect sufficient prey within a limited dive time.
Dimensionality reduction
Resources in the open ocean are not uniformly distributed across depth, but tend to
concentrate within several broad depth layers (Steele 1989). Male sperm whales in high
latitude waters feed over a wide depth range, and may switch between prey layers
several times per day (Figure 2A). Although the whales occasionally switched between
shallow and medium prey within a dive (Figure 2A), the 10% of U-shaped shallow and
medium dives, without prey capture attempts, suggest that it may be more economical
to continue foraging within a poor layer than to begin searching for a new layer
mid-dive. If so, it is critical for whales to choose a productive foraging layer at the beginning
of each dive before incurring the transport costs of a deep dive (Thompson and Fedak
2001). In a habitat with vertical resource stratification, U-shaped dive profiles
effectively reduce the 3-dimensional search problem into successive 1-dimensional (i.e.,
depth) and 2-dimensional (i.e., within a horizontal depth layer) searches during dives.
This may explain why U-shaped dives are performed by many marine mammal species
(Watwood et al. 2006; Arranz et al. 2011; Kuhn et al. 2009). However, the ability to
study dive depth choices in air-breathing marine predators is greatly restricted by the
limited knowledge on the available sensory inputs for even well-studied species, such as
several pinnipeds (Dehnhardt et al. 2001; Vacquié-Garcia et al. 2012). Male sperm
whales off northern Norway present a unique combination of data that include the range
over which they are sensing while performing variable depth dives. This allows us to
test if foraging decisions in a long-range sensing species rely on expectations from
priors or within dive sensory information flow. 316
317
318
319
320
321
322
323
324
325
326
327
328
329
330
331
332
333
334
335
336
337
338
Using priors: expectations of vertical prey distribution
Echolocating predators exert control over the timing of their pulse emission, thus
determining both when they search and the sensory range. Sperm whales in this study
adjusted their initial search range (as indicated by the ICIs) to the distance to the
targeted depth-layer before gaining information via echolocation of the actual resource
distribution in the water column (Figure 3C and D). Further, when performing deep
dives sperm whales did not begin echolocating until they had passed the depth of
shallow prey (Figure 3A and B). Sperm whales are potentially able to profile the vertical
distribution of prey resources out to a range in excess of 1000 m (Møhl et al. 2003;
Madsen et al. 2007) at low energetic costs (Nelson and MacIver 2006), enabling them to
plan dives from close to the surface based on current sensory information. However, in
this study the whales employed a directed search behaviour focusing their search on a
subset of the water column from the beginning of the dive. Such directed search
behaviour may be more efficient for these animals, making a conscious decision on
where to forage before committing effort. Other air-breathing marine predators also
direct their search for prey by swimming through shallower layers of potential prey
when foraging near the sea-floor (Costa and Gales 2003). However their passive sensing
system provides limited cues from which to infer search tactics and use of priors.
Conversely, echolocation provides robust cues to when and where predators are
searching for prey, in this case, revealing an adaptation in the start depth and subsequent
sampling rates of the biosonar to the location of preferred prey.
Most deep foraging marine mammals show the ability to adapt their foraging
behaviour to exploit different depths (Kuhn et al. 2009; Arranz et al. 2011) and different
prey types (Naito et al. 2013; Aguilar Soto et al. 2008). These modifications of foraging
patterns are often related to circadian variations in vertical distribution of resources, 340
341
342
343
344
345
346
347
348
349
350
351
352
353
354
355
356
357
358
359
360
361
362
363
constituting a predictable aspect of the marine environment (McNamara et al. 2006). In
contrast, male sperm whales off northern Norway need to respond to short-term
environmental changes, given the lack of temporal structure in high latitude waters
(Blachowiak-Samolyk et al. 2006). When foraging in a dynamic prey landscape, the
most reliable source of information to plan a dive a priori is information collected during previous dives. Madsen et al. (2002b) hypothesised that sperm whales could use
eavesdropping to locate suitable prey patches, and the occasional click trains from
non-tagged conspecifics in the recordings analysed here suggest acoustic contact between
the whales. However, the use of eavesdropping information to directly assess foraging
patches on a dive-to-dive basis seems unlikely given that male sperm whales are
apparently non-social animals and that they generally forage several km apart (Letteval
et al. 2002), suggesting that male sperm whales mainly usetheir own information to
make foraging decisions. In contrast to passive sensing, echolocation provides larger
sensory volumes, resulting in more extensive information gathering in light-limited
environments than is possible with vision or tactile senses (Costa and Gales 2003).
Given their long-range sensory capabilities, sperm whales may glean information about
prey while sampling within but also before arriving at a prey patch (Louâpre et al.
2011). In half of the switches from deep and medium to shallow dives sperm whales
echolocated during the ascent phase until close to the surface. Hence, decisions about
where to forage in subsequent dives may be based not only on foraging success but also
on echo information gathered during ascents, providing a timely update on the location
and quality of prey in the water column.
Sampling strategies during descents
Sperm whales produce clicks in a very narrow sound beam, with a half-power width of
around 4 degrees (Møhl et al. 2003). This beamforming increases the range at which 365
366
367
368
369
370
371
372
373
374
375
376
377
378
379
380
381
382
383
384
385
386
387
388
prey can be detected but at the expense of a broad acoustic field of view for closer prey.
Thus, the whales face a trade-off between (1) failing to sample water volumes as they
manoeuvre if they click slowly to accommodate targets at long ranges, and (2) range
ambiguity and spatial aliasing from distant targets when clicking at a high repetition rate
to get frequent updates on closer water volumes (Madsen et al. 2013). Hence,
echolocation clicking rates provide inherent information about the exploratory tactics of
echolocating predators. Sperm whales off northern Norway seem to prey on fast moving
fish during shallow dives, but target slow moving squid at greater depths (Martin and
Clarke 1986). The current study found a bimodal sampling behaviour during descents:
in dives to <1200 m depth sperm whales sampled with a varying ICI, not tracking either
the sea-floor nor the prey layer (Figure 4A-D), while whales performing dives to >1200
m tracked sequentially discrete layers, making repetitive downward ICI adjustments
(Figure 4E and F), potentially suffering from pulse-echo overlap. These different
echolocation tactics suggests that these long-range sensing predators adjust their sensory
input stream to accommodate variations in prey distribution while descending towards a
preferred depth.
In shallow dives (<220 m) sperm whales fed within an epipelagic layer (Figure 2)
with widely spaced prey, as indicated by the long IBIs. In these dives, whales started
clicking immediately upon leaving the surface (Figure 3A and B) and dove at a
relatively shallow angle (as evidenced by the low vertical rate in shallow descents,
Figure 4A), thus ensonifying a broad swath of the epipelagic prey layer throughout the
descent. This strategy facilitates detection of echoes from multiple targets at different
ranges immediately upon start of clicking. Sperm whales clicked rapidly during the
initial descent of these dives, but opened their depth of gaze by slowing down their
sampling rate while descending within the foraging layer (Figure 4A and B). Long ICIs 390
391
392
393
394
395
396
397
398
399
400
401
402
403
404
405
406
407
408
409
410
411
412
413
allow long-range target detection, appropriate for detecting the sparsely distributed prey
encountered in these shallow dives.
During the deepest dives (>1200m depth) sperm whales foraged opportunistically
during descents (Figure 2), actively changing their acoustic gaze by modulating ICIs to
sequentially track discrete prey layers (Figure 4E and F). When swimming vertically
towards a prey layer, whales receive echoes from a discrete delay window
corresponding to the depth range of the layer. As exemplified in Figure 4E the depth of
the acoustic gaze decreased sequentially as the whale descended with prey capture
attempts coinciding with the shortest inspection ranges. This suggests that the clicking
rate during the descent phase of the deepest dives is adjusted to maximize the sampling
rate on nearby prey to increase interception probability. Previous studies (Thode et al.
2002; Zimmer et al. 2003) have reported stereotyped monotonically decreasing ICI
patterns during descents of sperm whales in tropical waters, but this study shows that,
when multiple prey layers are available, sperm whales adjust their acoustic gaze to
sequentially track these layers. This gives rise to a sawtooth pattern in the ICI with step
changes in the ICI signalling a switch in acoustic gaze to a further prey layer.
The echolocation behaviour in the descents of medium depth dives (up to 1200 m;
Figure 4C and D) is more difficult to explain. Sperm whales appeared to forage over a
broad depth range in these dives (Figure 2) on prey that were aggregated in patches, as
indicated by the short IBIs. The slow sampling rate and the lack of ICI tracking of a
prey layer during these descents may help maintain a broad auditory scene to
accommodate targets spread over a wide depth range and so facilitate prey patch
selection. Although the buzz depths in medium dives (mostly in four dives with depth
>700 m) overlapped with the depth of some buzzes during the descents of deep dives
(Figure 2B), there may be a difference in intention underlying the different biosonar 415
416
417
418
419
420
421
422
423
424
425
426
427
428
429
430
431
432
433
434
435
436
437
438
sampling behaviour. If whales intend to dive deep, there may be no need to compare
prey patches within the same auditory scene while descending, rather it may be more
useful to maximise the update rate of prey locations for opportunistic capture.
Conversely, whales performing medium dives tended to commit to a narrow range of
foraging depths and so should compare prey availability in different vertical layers
carefully during descents.
A powerful biosonar enables the location of prey at long ranges, but each click also
ensonifies a large volume of water as well as sea-floor and sea-surface interfaces
leading to a potentially complex and slowly decaying auditory scene for the animal to
decode. It is conventionally assumed that echolocators faced with rich auditory scenes
attempt to avoid range ambiguity of strong echoes by clicking slowly enough to
encompass the strong reflectors in the ensonified scene (Wisniewska et al. 2012). This
clicking behaviour, however, would not provide rapid updates on the immediate
surroundings. Echoes from the sea-floor were recorded by the tags as soon as whales
started echolocating, indicating that when whales are pointing downwards, they
inevitably ensonify the sea-floor with their long-range sonar. The sperm whales studied
here focused their attention on nearby layers of prey while descending, despite
ambiguous echoes from the sea-floor ensonified by preceding clicks (Figure 4E). This
implies that sperm whales employ auditory stream segregation to organize ambiguous
echoes when encountering pulse-echo overlap, a capacity that may be crucial for
predators with long-range biosonar to focus their attention on nearby targets while
operating in a complex reverberant auditory scene. As the whales approached within
about 1000 m of the sea-floor, they adjusted their ICI to track the range to the sea-floor
(Figure 4E and F). This suggests that sea-floor echoes may be so strong that whales are
no longer able to decode prey echoes among the reverberation (Moss and Surlykke 440
441
442
443
444
445
446
447
448
449
450
451
452
453
454
455
456
457
458
459
460
461
462
463
2010; Moss and Surlykke 2010). Further, attention to sea-floor echoes may be important
in near-bottom deep dives, given that relatively weak prey echoes must be distinguished
from the closely following bottom echoes, and a collision with the sea-floor while
manoeuvring must be avoided.
Search within the prey layer
Once arrived at the selected prey layer, sperm whales navigated within it to locate
individual prey (Figure 2A). Optimal foraging theory predicts that predators put a
premium on maximizing net energy gain during foraging to increase fitness (McArthur
and Pianka 1966). Hence, the echolocation sampling behaviour throughout the
2-dimensional search within a layer should maximize biosonar information flow to
minimize search time. It has been hypothesised that sperm whales benefit from visual
cues, such as bioluminescence to find prey at depth (Fristrup and Harbinson 2002).
Although this hypothesis cannot be rejected from the data at hand, the small, laterally
placed eyes of sperm whales and consistent use of usual clicking throughout the dives is
a strong indicator that the whales are gathering information about prey distribution via
echolocation to inform search behaviour. We found that the depth of the search volume,
as given by the ICI, immediately after a prey capture attempt was related both to the
time between consecutive buzzes (IBI) and the rate at which whales turned after a buzz
(Figure 3E and F). This suggests that the tagged whales adjusted their echolocation
sampling rate to their perception of prey distribution either directly based on echoes
acquired before the last buzz, or indirectly by meeting the sampling requirements set by
their own movements as they manoeuvre to stay within a patch. Fast turns imply the
encounter of larger water volumes compared to straight-line swimming, and whales
need to sample fast enough to have a complete coverage of their surroundings (Madsen
et al. 2013). Hence, sperm whales seem to simultaneously track several targets for 465
466
467
468
469
470
471
472
473
474
475
476
477
478
479
480
481
482
483
484
485
486
487
488
sequential capture, and perceptually organize a multi-target auditory scene formed by
echo-information. Studies on smaller toothed whales show that they can also handle
multi-target acoustic scenes Porpoises can accurately adjust their sampling rates to new
target locations when switching between targets (Wisniewska et al. 2012), and beaked
whales sample faster when executing large scale motor patterns adjusted to several prey
items in a patch (Madsen et al. 2013).
Conclusion
Analysis of acoustic and movement data of sperm whales tagged off northern Norway
provide a unique insight into the sampling tactics employed by deep sea, endothermic
predators with long-range sensing capabilities when searching for and selecting between
foraging options with varying exploitation costs. Here we showed that sperm whales
employ directed search behaviour, using priors to guide foraging decisions. They
actively modulated their echolocation behaviour to the prey distribution and
environmental constraints which change in time and space. The long-range sonar
capabilities of sperm whales potentially inform them about multiple prey items in a
sensory volume far ahead of them, but such capabilities come at the cost of very low
biosonar sampling rates if echoes from distant surfaces such as the sea-floor are to
arrive before the next ensonification. To solve that trade-off between high rate tracking
of nearby prey and avoiding range ambiguity, sperm whales seem to have developed
active auditory stream segregation to deal with ambiguous echoes, allowing them to
track nearby and fast-moving prey using short ICIs in challenging reverberant
conditions. Further, they appear to adjust their sampling rates to both the spatial
relationships with individual prey and prey patches, and also to the rate with which they 490
491
492
493
494
495
496
497
498
499
500
501
502
503
504
505
506
507
508
509
510
511
512
encounter new and unsampled water volumes as they manoeuvre. In combination, these
capabilities enable sperm whales to perform directed searches of prey, improving their
efficiency and probably contributing to the foraging success of this widely distributed
large marine predator.
Acknowledgments
We thank all captains and crew during the research cruises for their dedicated
assis-tance. The fieldwork was funded by a grant from the Carlsberg Foundation to B. Møhl
and ONR, SERDP, and FNU grants to MJ, PJOM, and PTM. PJOM was supported by a
Royal Society Fellowship, MJ by the Marine Alliance for Science and Technology for
Scotland and AF by project CETOBAPH (grant number CGL2009-1311218).
Ethical standards
The study complied with the laws of Norway. The whales were tagged under permits
no. 2005/7720-1 to PTM and no. S-2007/61201 to P. Kvadsheim from the Norwegian
Animal Research Authority. 514
515
516
517
518
519
520
521
522
523
524
525
526
527
528
References
Aguilar Soto N., Johnson M. P., Madsen P. T., Díaz F., Domínguez I., Brito A., Tyack P.
(2008) Cheetahs of the deep sea: deep foraging sprints in short-finned pilot whales
off Tenerife (Canary Islands). J Anim Ecol 77: 936-947
Anderson M. J., Braak C. J. F. (2003) Permutation test for multi-factorial analysis of
variance. J Stat Comput Sim 73: 85-113
Angel M., Boxshall G. (1990) Life in the Benthic Boundary Layer: Connections to the
Mid-Water and Sea Floor [and Discussion]. Philos T Roy Soc A331: 15-28
Arranz P., Aguilar Soto N., Madsen P. T., Brito A., Bordes F., Johnson M. P. (2011)
Following a Foraging Fish-Finder: Diel Habitat Use of Blainville’s Beaked Whales
Revealed by Echolocation. Plos One 6:e28353
Au W. W. L. (1993) The Sonar of Dolphins. Springer, New York
Au W. W. L., Benoit-Bird K. J. (2003) Automatic gain control in the echolocation
sys-tem of dolphins. Nature 423: 861-863
Bar-Shalom Y., Li X. R., Kirubarajan T. (2004) Estimation with applications to tracking
and navigation: theory algorithms and software. John Wiley & Sons
Bell W. J. (1991) Searching Behaviour - The behavioural ecology of finding resources.
Chapman and Hall, London, New York, Tokyo, Melbourne, Madras
Blachowiak-Samolyk K., Kwasniewski S., Richardson K., Dmoch K., Hansen E., Hop
H., Falk-Petersen S., Mouritsen L. T. (2006) Arctic zooplankton do not perform diel
vertical migration (DVM) during periods of midnight sun. Ma Ecol- Prog Ser 308:
101-116
Costa D. P., Gales N. J. (2003) Energetics of a benthic diver: seasonal foraging ecology
of the Australian sea lion, Neophoca cinerea. Ecol Monogr 73: 27-43 530
531
532
533
534
535
536
537
538
539
540
541
542
543
544
545
546
547
548
549
550
551
552
553
Dall S. R. X., Giraldeau L., Olsson O., McNamara J. M., Stephens D. W. (2005)
Information and its use by animals in evolutionary ecology. TREE20: 187-193
Dehnhardt G., Mauck B., Hanke, W., Bleckmann, H. (2001) Hydrodynamic
trail-following in harbor seals (Phoca vitulina). Science 293: 102-104
Fox J. (2002) Robust regression. An R and S-Plus companion to applied regression.
Fristrup KM, Harbison GR (2002) How do sperm whales catch squids? Mar Mam Sci
18:42-54
Gallon SL, Sparling CE, Georges J-Y, Fedak MA, Biuw M, Thompson D (2007) How
fast does a seal swim? Variations in swimming behaviour under differing foraging
conditions. J Exp Biol 210:3285-3294
Johnson M. P., Tyack, P. L. (2003) A Digital Acoustic Recording Tag for Measuring the
Response of Wild Marine Mammals to Sound. IEEE J Ocean Eng 28: 3-12
Kramer D. L. (1988) The behavioral ecology of air breathing by aquatic animals. Can J
Zoo 66: 89-94
Kuhn C. E., Crocker D. E., Tremblay Y., Costa D. P. (2009) Time to eat: measurements
of feeding behaviour in a large marine predator, the northern elephant seal
Mirounga angustirostris. J Anim Ecol 78: 513-523
Lettevall E, Richter C, Jaquet N, Slooten E, Dawson S, Whitehead H, Christal J,
Howard PM (2002) Social structure and residency in aggregations of male sperm
whales. Can. J. Zool 80:1189-1196
Lima S. L., Zollner P. A. (1996) Towards a behavioural ecology of ecological
landscape. TREE 11: 131-135
Louâpre P., Baaren J., Pierre J. S., Alphen J. J. M. (2011) Information gleaned and
former patch quality determine foraging behavior of parasitic wasps. Behav Ecol
22: 1064-1069 555
556
557
558
559
560
561
562
563
564
565
566
567
568
569
570
571
572
573
574
575
576
577
578
Madsen P.T., Payne R., Kristiansen N.U., Wahlberg M., Kerr I., Møhl, B. (2002a)
Sperm whale sound production studied with ultrasound time/depth-recording tags. J
Exp Biol 205: 1899-1906
Madsen P., Wahlberg M., Møhl B. (2002b) Male sperm whale (Physeter macrocephalus)
acoustics in a high-latitude habitat: implications for echolocation and
communication. Behav Ecol Sociobiol 53: 31-41
Madsen P. T., Johnson M., Aguilar Soto N., Zimmer W. M. X., Tyack P. (2005) Biosonar
performance of foraging beaked whales (Mesoplodon densirostris). J Exp Biol 208:
181-194
Madsen P. T., Wilson M., Johnson M. P., Hanlon R. T., Bocconcelli A., Aguilar Soto N,
Tyack, P. L. (2007) Clicking for calamari: toothed whales can echolocate squid
Loligo pealeii. Aquat Biol 1: 141-150
Madsen P., Aguilar Soto N., Arranz P., Johnson M. (2013) Echolocation in Blainville’s
beaked whales (Mesoplodon densirostris). J Comp Physiol A: 1-19
Madsen P., Surlykke A. (2013) Functional Convergence in Bat and Toothed Whale.
Physiology 28: 276-283
Martin A. R, Clarke M. R. (1986) The diet of sperm whales (Physeter macrocephalus) captured between Iceland and Greeenland. J Mar Biol Assoc 66: 779-790
McArthur R. H., Pianka E. R. (1966) On the optimal use of a patchy environment. Am
Naturalist 100: 603-610
McNamara J. M., Green R. F., Olsson O. (2006) Bayes' theorem and its applications in
animal behaviour. Oikos 112: 243-251
Miller P. J. O., Johnson M., Tyack P. L., Terray, E. A. (2004a) Swimming gaits, passive
drag and bouyancy of diving sperm whales Physeter macrocephalus. J Exp Biol 207: 1953-1967
580
581
582
583
584
585
586
587
588
589
590
591
592
593
594
595
596
597
598
599
600
601
602
603
Miller PJO, Johnson MP, Tyack PL (2004b) Sperm whale behaviour indicates the use of
echolocation click buzzes ‘creaks’ in prey capture. Proc. R. Soc. Lond., B Biol. Sci.
271: 2239-2247
Møhl B., Wahlberg M., Madsen P. T., Heerfordt A., Lucas A. (2003) The monopulsed
nature of sperm whale clicks. J Acoust Soc Am 114: 1143-1154
Moss C. F., Surlykke A. (2001) Auditory scene analysis by echolocation in bats. J
Acoust Soc Am 110: 2207-2226
Moss C. F., Surlykke A. (2010) Probing the natural scene by echolocating bats. Front
Behav Neurosci 4: 1-16
Naito Y., Costa D. P., Adachi T., Robinson P. W., Fowler M., Takahashi A. (2013)
Unravelling the mysteries of a mesopelagic diet: a large apex predator specializes
on small prey. Funct Ecol 27: 710-717
Nelson M. E., MacIver, M. A. (2006) Sensory acquisition in active sensing systems. J
Comp Physiol A 192: 573-586
Oliveira Cu, Wahlberg M, Johnson M, Miller PJ, Madsen PT (2013) The function of
male sperm whale slow clicks in a high latitude habitat: Communication,
echolocation, or prey debilitation? J Acoust Soc Am 133: 3135-3144
Ropert-Coudert Y, Kato A, Baudat J, Bost C, Le Maho Y, Naito Y (2001) Time/depth
usage of Adélie penguins: an approach based on dive angles. Polar Biol 24:467-470
Santos M., Pierce G., Boyle P., Reid R., Ross H., Patterson I., Kinze C., Tougaard S.,
Lick R., Piatkowski U. (1999) Stomach contents of sperm whales Physeter
macrocephalus stranded in the North Sea 1990-1996. Mar Ecol-Prog Ser183:
281-294 605
606
607
608
609
610
611
612
613
614
615
616
617
618
619
620
621
622
623
624
625
626
Sato K, Charrassin J, Bost C, Naito Y (2004) Why do macaroni penguins choose
shallow body angles that result in longer descent and ascent durations? J Exp Biol
207:4057-4065
Schnitzler H.-U., Moss C. F., Denzinger A. (2003) From spatial orientation to food
acquisition in echolocating bats. TREE 18: 386-394
Steele J. H. (1989) The ocean ‘landscape’. Landscape ecol 3: 185-192
Teloni V., Johnson M., Miller P. J. O., Tyack P. L. (2008) Shallow food for deep divers:
Dynamic foraging behavior of male sperm whales in a high latitude habitat. J Exp
Mar Biol Ecol 354: 119-131
Thode A., Melling D. K., Stienessen S., Martinez A., Mullin, K. (2002).
Depth-dependent acoustic features of diving sperm whales (Physeter macrocephalus) in
the Gulf of Mexico. J Acoust Soc Am 112: 308-321
Thompson D., Fedak M. (2001) How long should a dive last? A simple model of
foraging decisions by breath-hold divers in a patchy environment. Anim Behav 61:
287-296
Vacquié-Garcia J., Royer F., Dragon A. C., Viviant M., Bailleul F., Guinet C. (2012)
Foraging in the darkness of the southern ocean: Influence of bioluminescence on a
deep diving predator. Plos One 7: e43565
Watwood S. L., Miller P. J. O., Johnson M., Madsen P. T., Tyack P. L. (2006)
Deep-diving foraging behaviour of sperm whales (Physeter macrocephalus). J Anim Ecol 75: 814-825
Wilson RP (2003) Penguins predict their performance. Mar Ecol Prog Ser 249:305-310 628
629
630
631
632
633
634
635
636
637
638
639
640
641
642
643
644
645
646
647
648
649
Wisniewska D. M., Johnson M., Beedholm K., Wahlberg M., Madsen, P. T. (2012)
Acoustic gaze adjustments during active target selection in echolocating porpoises.
J Exp Biol 215: 4358-4373
Zimmer W. M. X., Johnson M. P., D’Amico A., Tyack P. L. (2003) Combining Data
From a Multisensor Tag and Passive Sonar to Determine the Diving Behavior of a
Sperm Whale (Physeter macrocephalus). IEEE J Ocean Eng28: 13-28
Zimmer WMX, Madsen PT, Teloni V, Johnson M, Tyack PL (2005) Off-axis effects on
the multipulse structure of sperm whale usual clicks with implications for sound
production. J Acoust Soc Am 118: 3337-3345
Zollner P. A., Lima S. L. (1999) Search strategies for Landscape-level interpatch
movements. Ecol Soc Am 80: 1019-1030
Legends
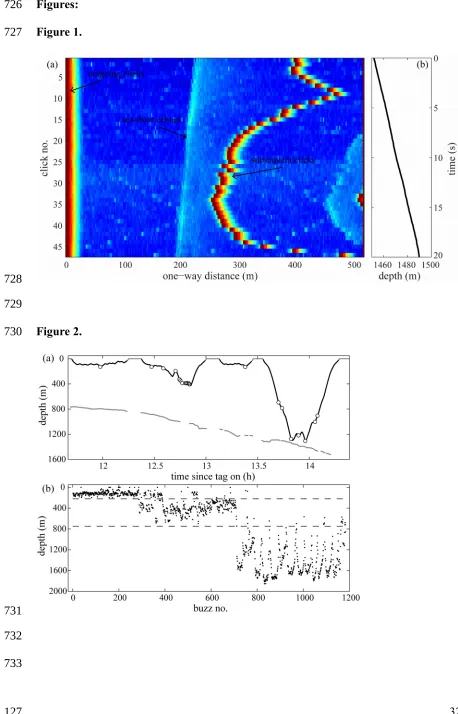
Figure 1: A) Echogram based on recordings made with DTag on a free ranging sperm
whales foraging off northern Norway. The echogram was constructed by stacking the
envelopes of 0.7 s long sound segments, expressed as range using sound speed of 1475
m/s, synchronized to out-going clicks (red line at distance 0). Subsequent clicks appear
as red shaded areas around 250-500 m, corresponding to an inter-click interval around
0.3-0.7 s. Sea-surface and sea-floor are shown as sequences of reverberant echoes with
slowly varying two-way travel time, allowing the calculation of the distances from the
whale to each surface. B) Change in depth of the whale during the time elapsed between
the emission of the first and last usual clicks used in the stackplot.
Figure 2: A) Section of a dive profile recorded from a male sperm whale off northern
Norway showing how whales switched between different prey layers in the water 651
652
653
654
655
656
657
658
659
660
661
662
663
664
665
666
667
668
669
670
671
672
673
674 675
column in successive foraging dives. The thick black line marks the echolocating period
of the dives and each white dot marks a prey capture attempt (buzz). The thick grey line
shows the estimated location of the sea-floor. B) Depth of buzzes of all tags, arranged
according to dive type (i.e. shallow, medium and deep) and plotted one by one ordered
according to their occurrence within the dives. Grey dashed lines represent the threshold
depths used to differentiate among shallow and medium dives at 220m, and among
medium and deep dives at 700m.
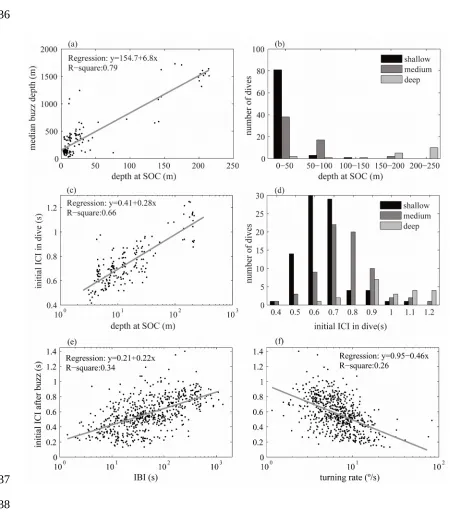
Figure 3: A) Relation between median buzz depth and depth of SOC for each dive
(n=161), B) histogram of SOC in 50 m depth bins, colour coded according to the
targeted prey depth-layer. C) Relation between mean ICI of the ten first clicks of a dive
and depth at SOC (n=175). D) Histogram of initial ICI in a dive colour coded according
to the targeted prey depth-layer. E) Relation between mean ICI of the 10 first clicks
after a buzz, during the bottom phase of dives, and time between consecutive buzzes
(IBI) (n=615). F) Relation between initial ICI after each buzz of the bottom phase and
mean turning rate over the first 5 seconds after each buzz (n=615).
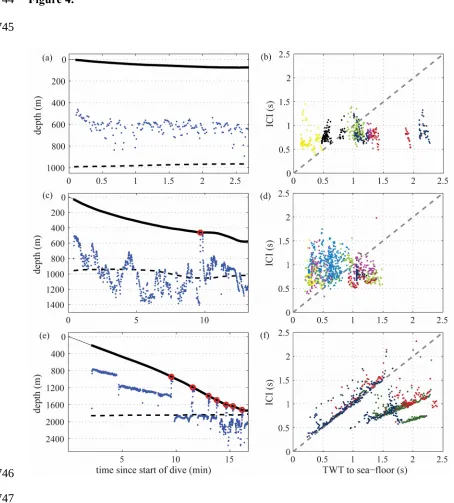
Figure 4: ICI as indicator of inspection range in a shallow dive (<220 m) (A), in a
medium dive (up to 1200 m) (C) and in a deep dive (>1200 m) (E). The inspection
range is given by ½ ICI added to the whale depth (blue dots) during the steep descent of
the dives. The dive profile is shown as a thin grey line with the time that the whales
spent clicking as a black thick line and the location of the buzzes as red circles. The
depth of the seafloor (deeper dashed black line) was estimated from the TWT of
sea-floor echoes. Relation between ICI and the TWT to the sea-sea-floor for the descent phase
of shallow dives (< 200 m, 17 dives randomly selected from a total of 84 dives 677
678
679
680
681
682
683
684
685
686
687
688
689
690
691
692
693
694
695
696
697
698
699
700
performed by 8 animals) (B), medium dives (up to 1200 m, 17 dives randomly selected
from a total of 74 dives performed by 8 animals) (D) and the deepest dives (>1200 m
depth, 17 dives performed by 3 animals) (F), with colour indicating whale ID. The
dashed grey line marks the relation ICI = TWT to the sea-floor. 702
703
704
705
706
707
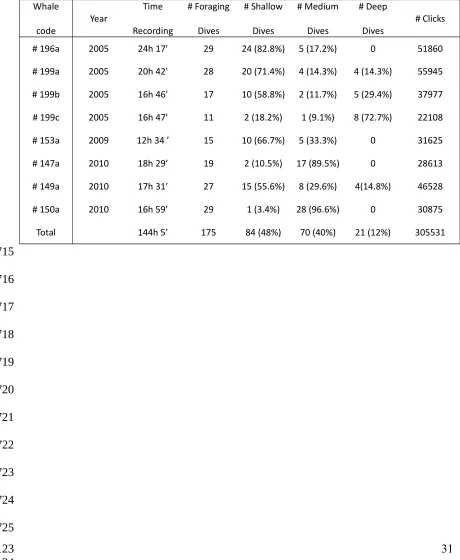
Table 1
Information on tag placements. Whale codes were formed by the Julian day and
the deployment order of the tag in that day. Foraging dives were defined as
echolocation dives with a maximum depth greater than 25m. Based on the
distribution of buzz depth dives were divided according to their maximum depth
in shallow (<220 m), medium (<700m) and deep (>700m).
Whale
code Year
Time
Recording
# Foraging
Dives
# Shallow
Dives
# Medium
Dives
# Deep
Dives # Clicks
# 196a 2005 24h 17' 29 24 (82.8%) 5 (17.2%) 0 51860
# 199a 2005 20h 42' 28 20 (71.4%) 4 (14.3%) 4 (14.3%) 55945
# 199b 2005 16h 46' 17 10 (58.8%) 2 (11.7%) 5 (29.4%) 37977
# 199c 2005 16h 47' 11 2 (18.2%) 1 (9.1%) 8 (72.7%) 22108
# 153a 2009 12h 34 ’ 15 10 (66.7%) 5 (33.3%) 0 31625
# 147a 2010 18h 29’ 19 2 (10.5%) 17 (89.5%) 0 28613
# 149a 2010 17h 31’ 27 15 (55.6%) 8 (29.6%) 4(14.8%) 46528
# 150a 2010 16h 59’ 29 1 (3.4%) 28 (96.6%) 0 30875
Total 144h 5’ 175 84 (48%) 70 (40%) 21 (12%) 305531
709
710
711
712
713
714
715
716
717
718
719
720
721
722
723
724
Figures:
Figure 1.
Figure 2.
726
727
728
729
730
731
732
Figure 3.
734
735
736
737
738
739
740
741
742
Figure 4.
744
745
746
747
748
749
750
751
752
[image:34.595.57.511.79.582.2]