Electronic copy available at: http://ssrn.com/abstract=1448509
research paper series
China and the World Economy
Research Paper 2009/05
The More the Better? Foreign Ownership and Corporate Performance in China
by
David Greenaway, Alessandra Guariglia, and Zhihong Yu
The Centre acknowledges financial support from The Leverhulme Trust
Electronic copy available at: http://ssrn.com/abstract=1448509
of Economics; Alessandra Guariglia is Associate Professor and Reader in Financial
Economics at the School of Economics of the University of Nottingham and an
Internal Research Fellow in GEP; Zhihong Yu is a RCUK Internal Research Fellow in
GEP, University of Nottingham.
Acknowledgements
Performance in China
by
David Greenaway, Alessandra Guariglia, and Zhihong Yu
Abstract
We examine the relationship between the degree of foreign ownership and performance of recipient firms, using of panel of 21,582 Chinese firms over the period 2000-2005. We find that joint-ventures perform better than wholly foreign owned and purely domestic firms. Although productivity and profitability initially rise with foreign ownership, they start declining once foreign ownership reaches beyond 64%. This suggests that some domestic ownership is necessary to ensure optimal performance. We rationalize these findings with a model of a joint-venture, where strategic interactions between a foreign and a domestic owner’s inputs may lead to an inverse U-shaped ownership-performance relationship.
JEL Classification: F2, G32, L25, O5
Keywords: Foreign ownership, corporate performance, China
Outline
1. Introduction
2. Data and summary statistics
3. Baseline specification and estimation methodology
4. Evaluation of the results
5. Theoretical model
A vast literature has investigated whether foreign firms perform better than their domestic counterparts. Most studies in this literature have partitioned firms into domestic and foreign owned and compared the two groups, without assessing whether firms with different degrees of foreign ownership perform differently. Our paper fills this gap, by using a panel of 21,582 unlisted Chinese firms over the period 2000-2005 to analyze the exact nature of the relationship between the degree of foreign ownership characterizing these firms and their performance.
Focusing on the return on assets, the return on sales, labor productivity, and total factor productivity, we find that joint-ventures generally perform better than wholly foreign owned and purely domestic firms. This finding is robust to defining joint-ventures on the basis of the capital paid in by foreign agents, and on the basis of registration information. It can be explained considering that both the domestic and the foreign parties of a joint-venture bring in attributes essential to achieving high performance. Specifically, the former contribute knowledge of the Chinese market and legal environment, as well as important political connections with local governments; and the latter, modern technologies, capital, better corporate governance through monitoring and market discipline, and managerial and international networking skills.
We then investigate the exact nature of the relationship between foreign ownership and corporate performance of our Chinese firms, and find that the two variables are linked by an inverted U-shaped relationship. Specifically, corporate performance increases as foreign participation rises up to the range 47% to 64%, depending on the measure of performance used, and declines thereafter. This suggests a certain degree of domestic ownership is necessary to ensure optimal performance. Furthermore, we show that it is those firms owned by investors other than those originating from Hong Kong, Macao, and Taiwan that benefit most from their foreign ownership.
Finally, we rationalize these findings with a simple theoretical model of a joint-venture, where, under plausible conditions, strategic interactions between the non-contractible inputs contributed by a foreign and a domestic owner may lead to a non-monotonic relationship between a firm’s degree of foreign ownership and its performance similar to that found in our Chinese data.
economic growth reaching a consensus that, especially in developing countries, FDI is
an engine of growth (see De Mello, 1997, for a survey). Yet, there is still uncertainty
about the exact ways in which FDI may foster growth. Factors such as knowledge
spillovers from foreign owned to domestic enterprises or technological upgrading
could represent possible channels. A wave of papers has tried to measure these
spillovers by estimating regressions of the productivity of domestic firms on
alternative indicators of the importance of foreign firms in a given sector. Much of
this work, however, fails to find evidence of positive spillovers, with some studies
reporting negative effects (see Blomström and Kokko, 1998; and Görg and
Greenaway, 2004, for surveys).
One condition for spillovers to take place is that foreign owned firms are more
productive than their domestic counterparts. A number of papers within the
international economics literature, have tested whether or not this is the case,
obtaining once again, mixed results1. The issue has also been tackled within the
privatization literature, which has analyzed the effects of ownership on corporate
performance in transition economies, including China (see Megginson and Netter,
2001; and Estrin et al., 2008, for surveys). Although their main focus is generally on
the effects of state ownership or private ownership, most studies in this literature
control for foreign ownership, and find that foreign owned firms tend to perform
better than their domestic counterparts.
A shortcoming of many of these studies, especially those in the international
economics literature, is that they simply divide firms into foreign owned and purely
domestic using some a priori criterion, and compare various measures of firm
performance across the two groups2, ignoring the considerable heterogeneity that
typically characterizes foreign owned firms. These include wholly foreign owned
firms, as well as joint-ventures between a domestic and a foreign partner, with
different degrees of foreign ownership. Joint-ventures represent a popular form of
1 Papers that find little or no evidence of superior performance of foreign owned firms compared to
their domestic counterparts are Globerman et al. (1994), Griffith (1999a, 1999b), and Benfratello and Sembenelli (2006). Papers that find positive evidence are Doms and Jensen (1998), Girma et al. (2001), Harris (2002), Harris and Robinson (2003), and Temouri et al. (2008).
2 For instance, focusing on UK data, Girma et al. (2001) define a firm as foreign owned if the country
FDI: they account for more than 40% of the foreign affiliates of almost a quarter of
the respondents to a global survey recently conducted by UNCTAD (UNCTAD,
2006). Furthermore, based on survey evidence for 1995, Javorcik and Saggi (2004)
document that in Eastern European countries, which are large FDI recipients,
joint-ventures outnumber direct entries and account for 59% of all projects. Finally, our
Chinese data show that in 2005, just under half of the foreign owned firms covered
were joint-ventures.
Aitken and Harrison (1999), Blomström and Sjöholm (1999), Chhibber and
Majumdar (1999), Dimelis and Louri (2002), and Takii (2004) are among the few
who have considered the possibility that firms characterized by different degrees of
foreign ownership may perform differently. The last four differentiate foreign owned
firms into a few sub-groups such as minority foreign owned, majority foreign owned,
and wholly foreign owned. Blomström and Sjöholm (1999) make use of Indonesian
establishments and show that although foreign ownership is always associated with
higher labor productivity of recipient firms, whether firms are majority or minority
owned by foreigners does not matter. In contrast, focusing on cross-sectional data for
Greece, Dimelis and Louri (2002) find that foreign ownership is associated with a
productivity advantage, which stems from the fully and majority foreign owned firms.
Chhibber and Majumdar reach a similar conclusion for Indian firms. Finally, Takii
(2004) shows that wholly foreign owned Indonesian firms tend to be the most
productive. Aitken and Harrison (1999) go one step further and analyze the extent to
which the actual degree of foreign equity participation affects performance of
Venezuelan manufacturing plants. To this end, they estimate a production function
augmented with a linear term measuring the share of foreign equity participation at
the plant level, and find a positive coefficient on the latter variable only for small
plants. Although they do consider that firms with different degrees of foreign
ownership may perform differently, none of these studies provides a full investigation
of the exact nature and possible non-monotonicity of the relationship between the
degree of foreign ownership and corporate performance of recipient firms3.
3 Contrary to the international economics literature, many studies in the privatization literature control
Our aim is to provide, for the first time, an in-depth analysis of this
relationship. For this purpose, we use a panel of 21,582 Chinese unlisted firms
operating in the entire economy, over the period 2000-20054. The Chinese case
represents an ideal laboratory for two reasons. First, China is among the top FDI
recipients in the world. Over the past decade, it has accounted for about one-third of
gross FDI flows to all emerging markets and about 60% of these flows to Asian
emerging markets (Prasad and Wei, 2005). Together with a considerable decline in
the number of state-owned and collective firms, and a rise of privately owned
enterprises, the increasing number of foreign firms in China has contributed
dramatically to its changing corporate landscape5. Second, joint-ventures and wholly
foreign owned firms coexist, which makes a study of the degree of foreign ownership
on corporate performance particularly relevant6.
We measure the degree of foreign ownership as the share of a firm’s equity
owned by foreign investors. We make use of several measures of corporate
performance and find that joint-ventures generally perform better than wholly foreign
owned and purely domestic firms. This finding, which is robust to defining the degree
of foreign ownership on the basis of registration information, can be explained
considering that both the domestic and the foreign parties of a joint-venture bring in
attributes essential to achieving high performance. Specifically, the former contribute
knowledge of the Chinese market and legal environment, as well as important
political connections with local governments; and the latter, modern technologies,
capital, better corporate governance through monitoring and market discipline, and
managerial and international networking skills. We then investigate the exact nature
performance. Moreover, he himself admits that his results might not be representative given the small number of foreign owned firms in his sample.
4 Also see Abraham et al. (2007) and Liu (2008) who investigate whether domestic Chinese firms
benefit from horizontal spillovers from foreign firms, controlling respectively for whether or not firms are joint-ventures, and for the percentage of the firms’ equity owned by foreign investors. Neither of these studies allows for a non-monotonic relationship between the degree of foreign ownership and the performance of recipient firms. Another related paper is Du and Girma (2008), who use data for Chinese firms to investigate the effects of foreign acquisitions on export markets dynamics.
5 Specifically, while until 1993, state-owned enterprises still dominated the scenario, in 2005, they
represented less than 5% of the total number of firms operating in China, while private firms represented 73.53%; collective firms, 6.33%; and foreign firms, 15.38% (Guariglia et al., 2008).
6 In the early days of China’s opening up, foreign agents invested mainly into large and well
of the relationship between foreign ownership and corporate performance of our
Chinese firms, and find that the two variables are linked by an inverted U-shaped
relationship: corporate performance initially rises with foreign ownership, but
declines once foreign ownership reaches beyond 64%. This suggests a certain degree
of domestic ownership is necessary to ensure optimal performance. Furthermore, we
show that it is those firms owned by investors other than those originating from Hong
Kong, Macao, and Taiwan that benefit most from their foreign ownership.
To underpin these empirical findings, we construct a simple theoretical model
of a joint-venture, where a domestic and a foreign owner contribute non-contractible
inputs to boost the company’s productivity. The choice of the level of such inputs by
each owner depends on his/her share in the firm’s ownership and profits, as well as on
the inputs contributed by the other owner. Under plausible conditions, the model
yields predictions of a non-monotonic relationship between the firm’s degree of
foreign ownership and its performance similar to that found in our Chinese data.
Our findings contribute to understanding the link between FDI and economic
growth: in countries where FDI inflows are large and mainly take the form of
joint-ventures between domestic and foreign firms, the effect of FDI penetration on the
performance of recipient firms could be an important channel through which FDI
affects economic growth. Attracting more FDI in the form of joint-ventures could
hence be beneficial to long-run growth.
The remainder of the paper is organized as follows. In section 2, we describe our
data and present some descriptive statistics. Section 3 illustrates our baseline
specification and our estimation methodology. Section 4 describes and evaluates our
regression results. Section 5 presents our theoretical model, and section 6 concludes.
2. Data and summary statistics
2.1 Data: Our data set is drawn from the annual accounting reports taken from the
ORIANA database, published by Bureau Van Dijk Electronic Publishing (BvDEP).
The database includes balance sheet and profit and loss information for over 23,000
Chinese companies, over the period 2000-2005. We dropped observations with
negative sales; as well as observations with negative total assets minus total fixed
assets and total assets minus liquid assets. Firms that did not have complete records
potential influence of outliers, we excluded observations in the one percent tails for
each of our regression variables. Our final dataset covers 21,582 unlisted firms, which
operate in the entire economy, and corresponds to 91,576 firm-year observations7.
Our panel is unbalanced, with number of observations ranging from a minimum of
11,813 in 2000 to a maximum of 17,665 in 20048.
As ORIANA does not include complete time-varying ownership information,
we have augmented it with data on the ownership of industrial firms obtained from
the National Bureau of Statistics (NBS) of China. Specifically, ownership is defined
on the basis of the fraction of paid-in-capital contributed each year by six different
types of investors: the state; foreign investors (excluding those from Hong Kong,
Macao, and Taiwan); investors from Hong Kong, Macao, and Taiwan; legal entities;
individuals; and collective investors. Our foreign ownership variable is given by the
share of the firm’s capital paid in by all foreign investors, including those from Hong
Kong, Macao, and Taiwan. We will also provide specifications showing whether the
effects of ownership by the two groups of foreign investors are different. We will
verify the robustness of our results to the use of registration-based ownership
measures. However, defining ownership categories on the basis of the fraction of
capital paid in by various groups is preferable to using registration codes. The latter
are in fact updated only with considerable delay (Dollar and Wei, 2007). Moreover,
firms might have an incentive to falsely register as foreign simply to take advantage
of the tax benefits accorded to the latter.
2.2 Summary statistics: We divide our observations into four categories on the
basis of the share of capital paid in by foreign investors9. Our first category
encompasses those firm-years with no foreign participation, which make up 60.95%
of our sample. Our second category contains those observations with a share of
foreign capital, which is positive but lower than 50% (10.47% of our sample); our
7 We have excluded listed firms from our analysis as information on their ownership was not available.
Most of the studies that tried to assess the effects of foreign ownership on firm performance focused on the manufacturing sector. In the Chinese context, it is important to consider other sectors as well, as non-manufacturing sectors also attract significant levels of foreign investment (see Table A2 in Appendix 1C for details). All our results were robust to considering only firms operating in the manufacturing sector.
8
See Appendixes 1A and 1B for details about the structure of our panel, and complete definitions of all variables used.
9 Our observations refer to firm-years. We therefore allow our firms to switch across ownership
third category includes observations with a share higher than or equal to 50% but
lower than 100%, (8.61% of our sample); our final category contains firms that are
100% foreign owned, (19.07% of our sample).
Our empirical analysis focuses on four measures of corporate performance: the
Return on Assets (ROA, the ratio of the firm’s net income to total assets); the return
on sales (ROS, the ratio of the firm’s net income to its total sales); labor productivity
(PROD, the ratio of the firm’s net income to number of employees); and Total Factor
Productivity (TFP, measured using the Levinsohn and Petrin, 2003, method)10. All
four have been frequently used in the literature assessing the effects of government
ownership on corporate performance (Tian and Estrin, 2008; Jiang et al., 2008)11.
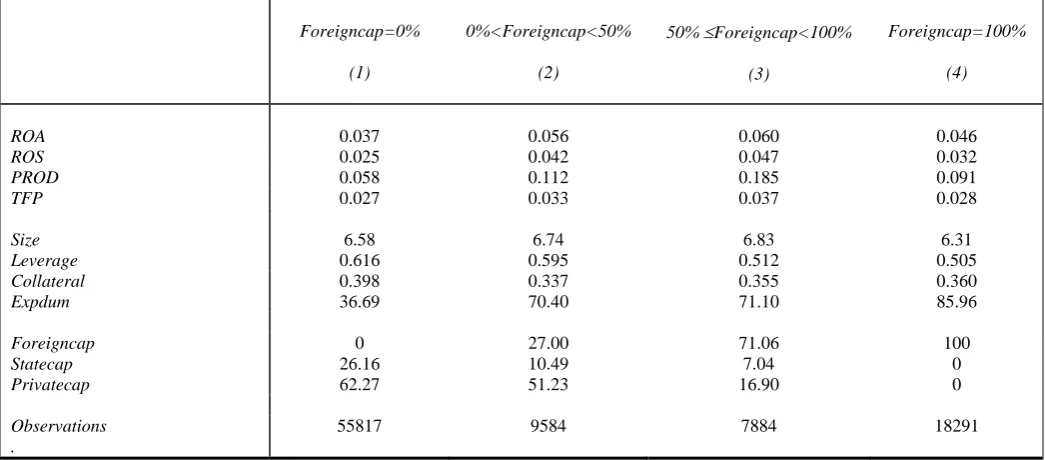
Table 1 presents summary statistics about the behavior of our performance
variables and other relevant variables for our four categories of ownership12. We can
see that ROA, ROS, PROD, and TFP, all increase with the degree of foreign
ownership, but decline for those observations that are 100% foreign owned. This
suggests that joint-ventures perform better than foreign owned and purely domestic
firms, and may reflect the fact that both the domestic and the foreign parties of a
joint-venture bring in attributes essential to achieving high performance. Specifically,
domestic investors have a widespread knowledge of the Chinese markets, and legal
and political environment, while foreign investors bring in capital, modern
technologies, better corporate governance through monitoring and market discipline,
as well as managerial and international networking skills, which together are likely to
lead to high performance. Foreign ownership is hence beneficial to corporate
performance only up to a certain threshold beyond which it becomes detrimental.
Although they exhibit better performance than the purely domestic firms, firms that
are fully (or almost fully) owned by foreign investors are unlikely to perform as well
as joint-ventures, due to a limited knowledge of the Chinese market, legal, regulatory,
10 A key issue in the estimation of production functions is the correlation between unobservable
productivity shocks and input levels. Profit-maximizing firms respond to positive productivity shocks by expanding output, which requires additional inputs; and to negative shocks, by decreasing output and input usage. Olley and Pakes’ (1996) estimator uses investment as a proxy for these unobservable shocks. This could cause problems as any observation with zero investment would have to be dropped from the data. Levinsohn and Petrin (2003), by contrast, introduce an estimator which uses intermediate inputs as proxies, arguing that these (which are generally non-zero) are likely to respond more smoothly to productivity shocks.
11
Jiang et al. (2008) note that in the Chinese context, extraordinary income and income from non-core operations may be subject to manipulations: they therefore suggest an alternative measure of corporate performance, which excludes them, namely the ratio of operating profits to total assets. All our results were robust to using this alternative measure of firm performance.
and bureaucratic environment, and workers’ attitudes towards incentives, as well as to
a lack of political connections with local governments (Guanxi), which are often
considered as a key factor in determining firm performance in China (Hsieh and
Klenow, 2007). The best performers in the Chinese economy are therefore
joint-ventures with a sufficiently large share of domestic ownership. A minority of these
joint-ventures are between foreign and state firms. Specifically, those firm-years with
a positive but lower than 100% share of capital paid in by foreign investors exhibit an
average share of private capital of 35.74%, and an average share of state capital of
8.93%.
Focusing on the other variables reported in Table 1, we see that firm size,
measured by the logarithm of its total assets, also increases with the degree of foreign
ownership, and declines for 100% foreign owned firms. Leverage, defined as the ratio
of the firm’s total liabilities to total assets declines monotonically as the share of
foreign ownership increases; and collateral, defined as the firm’s ratio of tangible
fixed assets to total assets, remains approximately constant across the four categories.
Finally, only 36.7% of the purely domestic firm-years export, while the corresponding
percentages for joint-ventures and fully foreign owned firm years are, respectively,
70.7% and 86.0%.
In the sections that follows, we first formally analyze the extent to which,
controlling for other relevant variables, the performance of minority foreign-owned,
majority foreign owned, and fully foreign owned firms differs from that of their
purely domestic counterparts. We then investigate the exact nature of the relationship
between foreign ownership and corporate performance.
3. Baseline specification and estimation methodology
3.1 Baseline specifications: We initially estimate the following equation:
(1) PERFit = a0 + a1PERFi(t-1) + a2 Minority foreignit + a3Majority foreignit +
+ a4 All foreignit + a5 Sizeit + a6 Leverageit + a7 Collateralit + a8 Expdumit +
+ vi + vt + vjt + eit
where the subscript i indicates firms, and t, time. PERFit indicates in turn our four
variables Minority foreignit, Majority foreignit, and All Foreignit. Minority foreignitis
equal to 1 if the share of foreign ownership is positive but lower than 50%, and 0
otherwise; Majority foreignitis equal to 1 if the share is greater than or equal to 50%
but lower than 100%, and 0 otherwise; and All Foreignit is equal to 1 if the firm is
100% foreign owned, and 0 otherwise. The omitted category is a dummy equal to 1
for purely domestic firms, and 0 otherwise. This exercise is aimed at determining the
extent to which the performance of fully foreign owned firms and joint-ventures
characterized by different degrees of foreign participation differs from that of purely
domestic firms13.
The other regressors in equation (1) are motivated by the finance literature
(e.g. McConnel and Servaes, 1990). Size is included to control for the fact, that as
suggested by Chhibber and Majumdar (1999), larger firms may benefit from
economies of scale and better access to external finance, which might enhance their
profitability. Collateralit is expected to affect profitability negatively, as firms with
more intangible assets are expected to have more investment opportunities and grow
faster (Tian and Estrin, 2008). Finally, Leverageit is also expected to have a negative
impact on firm performance, due to the debt overhang problem (Jensen and Meckling,
1976; Myers, 1977)14. Because more than 50% of Chinese firms in our sample export,
we also include a dummy Expdumit, which is equal to 1 if the firm exports, and 0
otherwise15.
The error term in equation (1) comprises three components: vi, which is a
firm-specific component; vt, a time-specific component accounting for possible
business cycle effects; vjt, a time-specific component which varies across industries,
accounting for industry-specific shifts in company performance; and eit, an
idiosyncratic component. We control for vi by estimating our equation in
first-differences; for vt, by including time dummies in all our specifications; and for vjt, by
including time dummies interacted with industry dummies.
13 It has been argued that comparing foreign firms with all domestic firms may lead to a selection
problem as domestic firms may include domestic multinationals, which are likely to be as productive as foreign multinationals (Criscuolo and Martin, 2005). This is not an issue in the Chinese case considering the small size of China’s outward FDI (Morck et al., 2008).
14
In the presence of a high debt to assets ratio, debt holders will share future investment returns, which might lead the firm to forego some profitable investment opportunities.
15
To better understand the nature of the relationship between foreign ownership
and firm performance, we next estimate the following variant of equation (1), which
includes the actual percentage of the firm’s capital paid in by foreign investors,
Foreigncapit:
(2) PERFit = a0 + a1PERFi(t-1) + a2 Foreigncapit + a3Foreigncap2it + a4 Sizeit +
+a5 Leverageit + a6 Collateralit + a7Expdumit + a8 Statecapit+
+ a9 Privatecapit +vi + vt + vjt + eit
Equation (2) includes both Foreigncapit and Foreigncap2it to account for the possible
non-linearity of the relationship between Foreigncapit and PERFit. Considering the
large literature on the effects of privatization on corporate performance (Estrin et al.,
2008), the percentage of the firm’s total capital paid in by the state (Statecapit) and by
private investors (Privatecapit) are also included16.
3.2 Estimation methodology: All equations are estimated in first-differences, to
control for firm-specific, time-invariant effects. Given possible endogeneity of the
regressors, we use a first-difference Generalized Method of Moments (GMM)
approach17. Two or more lags of each of the regressors are used as instruments.
To check whether the first-difference GMM estimator is likely to suffer from
finite sample bias, we compared the GMM and the Within Groups estimates of the
coefficient on the lagged dependent variable in equation (1). Because the Within
Groups estimate is typically downward biased in short panels (Nickell, 1981), one
would expect a consistent estimate of the coefficient on the lagged dependent variable
to lie above this. As our GMM coefficient was larger than its Within Groups
counterpart, we concluded that the first-difference GMM estimates are unlikely to be
subject to serious finite sample bias18.
16 The squares of these additional variables never had precisely determined coefficients. For this
reason, we decided to omit them. We also attempted to include cubic terms of all our ownership variables, which always had poorly determined coefficients.
17 See Arellano and Bond (1991) on the application of the GMM approach to panel data. Most of our
results were robust to using Ordinary Least Squares, which, however, does not take into account unobserved firm heterogeneity and the possible endogeneity of the regressors.
18
To evaluate whether our instruments are legitimate and our model is correctly
specified, we use the test for second-order serial correlation of the residuals in the
differenced equation (m2). The m2 test is asymptotically distributed as a standard
normal under the null of no second-order serial correlation of the differenced
residuals, and provides a check on the specification of the model and legitimacy of
variables dated t-2 as instruments in the differenced equation19.
4. Evaluation of the results
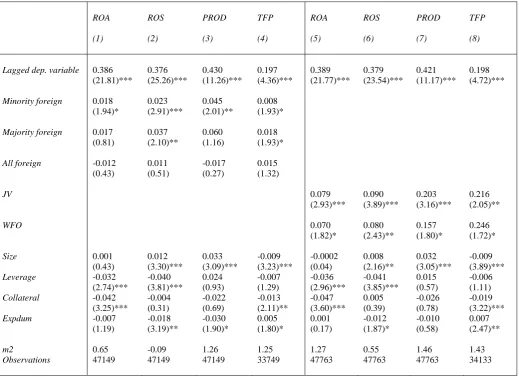
4.1 Are joint-ventures the best performers? Estimates of equation (1) are
reported in columns 1 to 4 of Table 2, which are respectively based on ROA, ROS,
PROD, and TFP as measures of corporate performance20. We can see that the lagged
dependent variable always has a positive and statistically significant coefficient,
suggesting persistence. Minority foreign always has a positive and precisely
determined coefficient, while the coefficient on Majority foreign is also positive but is
only significant for ROS and TFP. Finally, the coefficient on All Foreign is never
precisely determined, suggesting that being fully foreign owned is not associated with
a statistically significant performance advantage. These findings confirm that
joint-ventures generally perform better than purely domestic and purely foreign owned
firms. Yet, the fact that in two out of four cases, the coefficient associated with
Majority Foreign is not precisely determined indicates that, as suggested by the
descriptive statistics in section 2.2, there may be a level of foreign ownership beyond
which corporate performance starts to decline. Hence, foreign ownership is associated
with improved firm performance only as long as it is accompanied by a sufficient
degree of local investors’ participation, without which foreign agents may be unable
to perform optimally.
original specification expressed in first differences and in levels) would be required (Blundell and Bond, 1998).
19
If the un-differenced error terms are i.i.d., then the differenced residuals should display first-order, but not second-order serial correlation. Note that the m2 test does not allow to discriminate between bad instruments and model specification. As in Benito (2003), we do not rely on the Sargan test (test for overidentifying restrictions) because when samples with a very large cross-sectional dimension are used in estimation, this test tends to over-reject the null hypothesis of instrument validity (also see Blundell et al., 2000).
20
As for the other regressors included in equation (1), Size is positively and
significantly associated with ROS and PROD, but negatively associated with TFP.
Leverage is negatively linked with ROA and ROS, suggesting evidence of debt
overhang. Collateral has a negative and precisely determined coefficient for ROA and
TFP, indicating that a relative prevalence of tangible assets in the firm’s capital
structure may hamper its performance. Finally, our export dummy (Expdum) is
positively associated with TFP. This is in line with the vast literature, which has
shown that exporters are typically more productive than non-exporters (see
Greenaway and Kneller, 2007, for a survey). Yet, surprisingly, Expdum is negatively
associated with PROD. In all cases, the m2 test does not indicate problems with the
specification or choice of instruments.
Next, because our ownership measures based on the share of capital may
suffer from miscoding problems, we verify the robustness of our results to the use of
registration-based firm ownership characteristics. In particular, we replace the
Minority foreign, Majority foreign and All foreign dummies in equation (1) with
dummies indicating whether, according to its registration code, the firm is a
joint-venture (JV) or fully foreign owned (WFO)21. Joint-ventures can be either equity
joint-ventures (EJV) or contractual joint-ventures (CJV). In the case of EJVs, profit,
control, and risks are divided according to the equity shares invested by the parties.
On the other hand, the CJV parties’ profit, control, and risks are divided according to
negotiated contract terms (Folta, 2005). Focusing on these new definitions of foreign
ownership, 15.95% of our firm-years are made up of equity joint-ventures; 2.78%, by
contractual joint-ventures; and 17.28%, by wholly foreign owned firms. This leaves
63.98% of domestically owned firm-years, which compares favorably with the
corresponding share based on the capital paid in by non foreign agents (60.95%).
Estimates of equation (1), using registration information are reported in
columns 5 to 8 of Table 2. In column 5, ROA is used as our measure of corporate
performance. Column 6 refers to ROS; column 7, to PROD; and column 8, to TFP.
We can see that the JV dummy always has a positive and strongly significant
coefficient for all our measures of corporate performance, while the coefficient on the
WFO dummy is generally smaller and only marginally significant in three out of four
21 Unfortunately, using registration-based ownership information does not allow us to differentiate
cases22. In line with Abraham et al. (2007), Yusuf et al. (2006), and Pan et al. (1999),
these findings indicate that while both joint-ventures and fully foreign owned firms
perform better than purely domestic firms, the former have a larger advantage. Our
main result that joint-ventures are top performers in China is therefore robust to using
based ownership measures. It should be noted, however, that
registration-based measures may be inaccurate, since they are typically updated with significant
delay, and firms may have incentives to falsely register as foreign to take advantage
of tax benefits (Dollar and Wei, 2007).
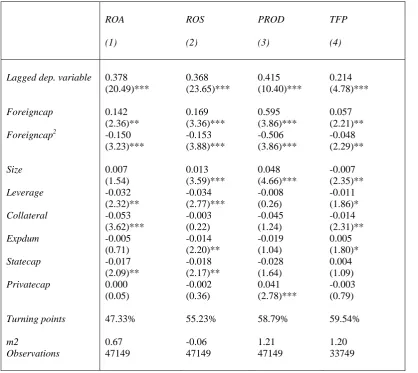
4.2 What is the exact nature of the relationship between the degree foreign
ownership and corporate performance? Table 3 provides estimates of equation (2),
which is aimed at better understanding the precise nature of the relationship between
the degree of foreign ownership and corporate performance. Columns 1, 2, 3, and 4
contain estimates respectively for ROA, ROS, PROD, and TFP. In all specifications
Foreigncap attracts a positive and statistically significant coefficient, while
Foreigncap2 has a negative and precisely determined coefficient. This suggests that foreign ownership and corporate performance are linked by an inverted U-shaped
relationship. The turning points are 47.33% for ROA, 55.23% for ROS, and 58.79%
for PROD, and 59.54% for TFP: foreign ownership enhances corporate performance
if it is below these thresholds, and decreases it thereafter. These findings confirm the
results reported in sections 2.2 and 4.1, which showed that it is partially foreign
owned firms which are the top performers in the Chinese economy. Foreign
ownership is associated with improved firm performance only as long as it is
accompanied by some degree of local investors’ participation: without sufficient
participation by private agents, foreign investors may be unable to perform optimally.
Turning to the other control variables, Statecap generally displays a negative
coefficient, statistically significant for ROA and ROS, which suggests the higher the
state’s participation in a firm’s capital, the lower its performance. This is consistent
with the findings in many of the studies on privatization surveyed by Estrin et al.
(2008). Privatecap, on the other hand, is positively related only with PROD. As in the
previous specifications, Leverage and Collateral display either negative or poorly
determined coefficients. Size is positively associated with ROS and PROD, but
22
negatively associated with TFP, and Expdum displays a positive and significant
coefficient in the TFP regression. In none of the specifications does the m2 test
highlight problems with the specification of the model or the choice of instruments.
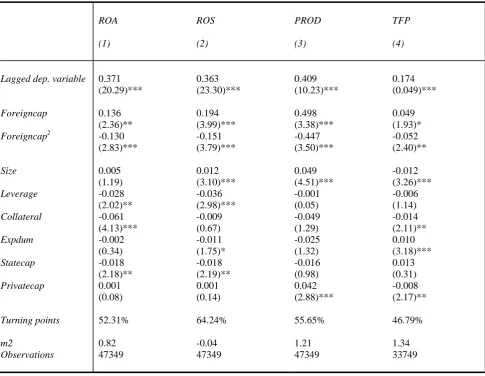
As foreign presence typically varies considerably across provinces (see
Appendix 1C), we next verify whether our estimates of equation (2) are robust to
replacing the industry dummies interacted with time dummies, with province
dummies interacted with time dummies23. Results are reported in Table 4. Once
again, Foreigncap has a positive and statistically significant coefficient, while
Foreigncap2 has a negative and precisely determined coefficient, suggesting an
inverted U-shaped relationship between foreign ownership and corporate
performance, with turning points of 52.31%, 64.24%. 55.65%, and 46.79%,
respectively for ROA, ROS, PROD, and TFP. These turning points are comparable to
those reported in Table 3.
Our data indicate that the average share of foreign capital paid in by all foreign
investors is 28.92%. A share of 14.51% is paid in by investors from Hong Kong,
Macao, and Taiwan (HMT), while a share of 14.36% is paid in by other foreign
investors. It has been argued that although investors from HMT may enjoy an
advantage based on cultural and geographical proximity to China, they are likely to be
fundamentally different from investors from other parts of the world. Specifically, it
may be that investment by HMT firms simply represents “round-tripping” by
domestic Chinese investors hoping to take advantage of the favorable tax and
regulatory treatment received by foreign investors (Huang, 2001). In such cases, one
would not necessarily expect firms owned by investors originating from Hong Kong,
Macao, and Taiwan to perform better than domestic firms.
Tables A3 and A4 in Appendix 1D report descriptive statistics similar to those
presented in Table 1, where observations are partitioned on the basis of the share of
total capital paid in by investors originating from countries other than HMT, and by
HMT entrepreneurs, respectively. Like Table 1, Table A3 indicates that corporate
performance increases with the share of non HMT capital participation, but declines
for 100% non HMT owned firms. The pattern in Table A4 is less clear, as very little
23 These dummies also control for factors such as the prevalence of foreign owned firms in a given
difference in corporate performance is observed among firms with HMT participation
between 1% and 49.99%, and between 50% and 99.99%. Moreover 100% HMT
owned firms exhibit the worst performance (column 4). In summary, ownership by
HMT investors does not seem to lead to a clear-cut productivity advantage: this can be
seen as indirect evidence in favor of the “round-tripping” hypothesis.
To shed further light on this issue, we estimate a new version of equation (2),
in which we replace Foreigncap and Foreigncap2 with corresponding variables for
non HMT investors (Non HMT Foreigncap and Non HMT Foreigncap2), and HMT
investors (HMT Foreigncap and HMT Foreigncap2). The estimates are reported in
Table 5. On the one hand, Non HMT Foreigncap always attracts a positive and
statistically significant coefficient, while Non HMT Foreigncap2 has a negative and precisely determined coefficient. The turning points are 50.00%, 60.68%. 55.03%,
and 48.73%, respectively for ROA, ROS, PROD, and TFP. These are comparable to
those reported in Table 3. On the other hand, ownership by investors from HMT has
less clear-cut effects: the coefficients on both foreign ownership variables are in fact
poorly determined for TFP, and in the regression for ROA, only the coefficient on
HMT Foreigncap2 is marginally significant. In the regression for PROD, HMT
Foreigncap has a significant coefficient, which is much smaller in magnitude
compared to the corresponding coefficient in Table 3, and HMT Foreigncap2 has a
negative but marginally significant coefficient. The turning point is 73%. For ROS,
both the coefficients on HMT Foreigncap and HMT Foreigncap2 are precisely
determined at conventional levels, and the turning point of 57.85%. In summary, these
results suggest that the inverted U-shaped relationship between foreign ownership and
corporate performance is mainly driven by non HMT foreign investors
The use of a GMM estimator, which makes use of lagged values of foreign
ownership (and other variables) as instruments, ensures in principle that the
relationship found between foreign ownership and corporate performance is
essentially explained by the effects of the exogenous component of foreign ownership
on corporate performance. Yet, it could be argued that if foreign investors target the
most productive domestic firms, the direction of causality could in fact go from
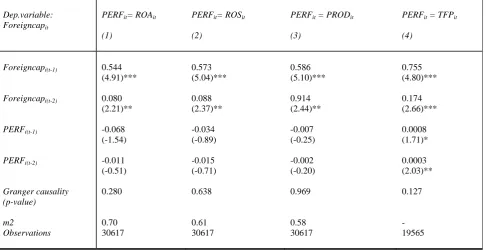
corporate performance to the foreign equity share of the firm. To investigate this, we
perform a panel Granger causality test (Holtz-Eakin et al., 1989). Specifically, we
(3) Foreigncapit = aoForeigncapi(t-1)+ a1Foreigncapi(t-2)+ b1PERFi(t-1) +
+ b2PERFi( t-2)+ vi + vt + vjt + eit
where PERF represents in turn one of our four indicators of corporate performance.
The structure of the error term in equation (3) is similar to that in equations (1) and
(2). In this framework, PERF is said not to Granger cause Foreigncap if the
coefficients on PERFi(t-1) and PERFi(t-2) in equation (3) are not significantly different
from 0, i.e. if b1 = b2 = 0. The results of the estimates of equation (3), together with
the p-values associated with the F-test aimed at testing our null hypothesis are
presented in Table 6. We can see that for each of our four measures of corporate
performance, the null hypothesis cannot be rejected. We therefore conclude that there
is no obvious evidence that corporate performance Granger causes foreign
ownership24.
Overall, our findings indicate that foreign ownership is only beneficial to the
performance of Chinese firms, as long as the degree of foreign ownership does not
pass a certain threshold which ranges between 47% and 64%, depending on the
measure of corporate performance used. This suggests that a certain degree of
domestic ownership is necessary to ensure optimal performance. We next construct a
simple theoretical model aimed at underpinning these empirical findings.
5. Theoretical model
We now construct a simple theoretical model which can generate predictions of a
non-monotonic relationship between a firm’s degree of foreign ownership and its
performance similar to that found in the previous section25.
5.1. The model: We assume that the market is made up of I firms labeled with the
subscript i (i = 1...I), each of which produces a different product, also labeled with i.
24
These results were robust to adding other control variables to the regressions.
25
Let and denote the quantity of firm i’s product, and that of a competitively
supplied numeraire good, respectively. Consumers maximize the following utility
function: i
q q0
(4) 0 , 1,
1 i i 0
I
U q q
i
ρ
γ ρ γ
= + ∑ < >
=
Utility maximization yields the following demand curve:
(5) , 1 1,
( )
1
i i i i i
q A p σ σ A γ ρ σ
ρ
−
= ≡ > ≡
− ,
where pi represents the price of good i, and is a demand shifter, which is
exogenous to individual firms. Labor is the only factor of production, and production
technology exhibits constant returns to scale, with total labor costs given by i A i i i q w c v = ,
where w and vi represent respectively the wage (common to all firms) and
productivity (firm-specific).
Each firm is potentially a joint-venture between two owners: a foreign (F) and
a domestic owner (D). Each may contribute a non-contractible input (such as effort) to
affect the productivity of the joint-venture (vi). Productivity can hence be expressed as
follows (for simplicity, we hereafter suppress the firm subscript i):
(6) (v= x+a) (α y b+ )β , a≥0,b≥0,α +β =1.
x and y represent the non-contractible inputs supplied respectively by F and D. x may
be interpreted as the foreign owner’s effort aimed at improving the quality of the
design of the product, or any other form of “knowledge capital”. y could be seen as
the domestic owner’s effort aimed at promoting the sale and marketing of the product
in the local market (e.g. through the organization and monitoring of a sales team), or
at facilitating the political connection (Guanxi) with local governments, which is often
considered as a key factor in determining firms’ performance in China (Hsieh and
Klenow, 2007). Both inputs are assumed to be greater than or equal to 0, (i.e. x≥0 and
y≥0)26. Furthermore, equation (6) implies decreasing returns to scale of x and y (i.e.
vxx<0, vyy<0)27.
26
This non-negativity assumption means that neither party can contribute negative inputs to incur “damage” to the productivity of the joint-venture, by making v fall below its benchmark level given by
= . ) 0 , 0 (
v aαbβ
27 As we will show below, this feature will turn out to be crucial for the inverse-U shaped
The parameter α(β)captures the “relative importance” of the contribution of
to productivity. The relative marginal return to x is in fact given by:
) (y x
/
/ 1
v x y b
v y x a
α α
∂ ∂ +
=
∂ ∂ − + , which is increasing in α . The greater α , the greater the
contribution of x to firm productivity. In the extreme case in which α =0, x is
completely “unimportant” to v, which is purely determined by y.
The parameter inversely captures the “absolute indispensability” of x (y):
the lower a(b), the greater the marginal return to x (y). In the extreme case in which
(b=0), v=0 if x=0 (y=0), indicating that x (y) is completely “indispensable”,
since x(y) must be strictly positive in order to achieve a positive productivity.
) (b a 0 = a
We further assume that there are implicit costs borne by each party to increase
their inputs. These can be expressed as:
(7) ( )
k F rx G x k = , ( ) k D ty G y k
= , where k ≥1, r>0,t>0.
Note that these implicit costs are assumed not to be incurred by the joint-venture, but
only by the individual owners. For example, the domestic party may need to devote
some of his/her own time to monitor the local sales team, incurring a disutility.
Finally, the ownership shares of the firm allocated to parties F and D are respectively
S and 1-S. S is assumed to be exogenous: it could partly depend on the bargaining
power of the foreign party and on other factors beyond the control of individual
investors (such as government interventions).
5.2 Nash equilibrium: Each firm’s profit is given by π( )v = pq−c . Profit
maximization leads to the following optimal price:
( 1) w p v σ σ =
− , which yields the
following optimal profit:
(8) π =Bvσ−1 , B≡ A w1−σ
( )
σ-1σ-1σ-σParties F and D receive respectively shares S and 1-S of the total profits. Each
simultaneously chooses the inputs that it contributes to maximize his/her individual
net payoff, taking the other party’s inputs as given. The two parties’ maximization
(9) F: max
[
( , ) ( )]
(
)
1( )1 1 ( 1) u z F x rS x y G x S x a y b x
B
π α
σ
− − k−
− ⇔ + + =
−
(10) D: max 1
(
)
( , ) ( )(
1) (
)
( ) 1( 1)
u z
D y
t
S x y G y S x a y b y
B π β σ k − − ⎡ − − ⎤⇔ − + + = ⎣ ⎦ − ,
where z≡1−β σ( −1), u≡α σ
(
−1)
. Equations (9) and (10) imply a standard Nash equilibrium problem, whereby eachparty strategically chooses its input, depending on the choice made by the other party.
For the purpose of the presentation, we will hereafter focus on the simple case in
which the cost functions of x and y are symmetric (r=t) and linear (k=1)28. In this
case, the equilibrium is determined by:
(11) Sα
(
x+a)
u−1(y+b)1−z =Q−1(12) (1−S)β
(
x+a)
u(y+b)−z =Q−1,where . To ensure that the second order conditions for each party’s
optimization problem hold, we assume that
(
1
[
Q≡r− B σ −1 ]
)
2
σ < 29
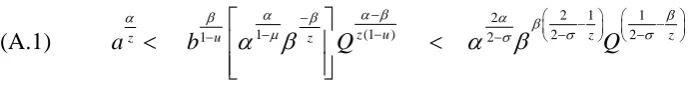
. As shown in figure 1, equations
(11) and define y, respectively, as a concave and a convex function of x, ensuring
the existence of a unique Nash equilibrium (12)
30
. The equilibrium values of x and y, x
and y, are thus given by:
1 1
(13)
1 1
2 2 2
1 (1 )
z z
x S σ S σ M σ
−
− − −
= − −a
(14)
1 1
2 2 2
1 (1 )
u u
y S σ S σ N σ
−
− − −
= − −b,
where M ≡β α1−z zQ and . Inspection of these two equations reveals that
both x
1 u u
N ≡β α− Q
1 and y1 are inverse U-shaped functions of S [since 1 ≥(<)0
∂ ∂
S x
if S ≤ (>) z and
0 ) (
1 ≥ <
∂ ∂
S y
if S≤ (>)u]. Focusing on the relationship between S and x, the intuition
behind these relationships can be explained considering that, according to the setup of
our model, an increase in S has two opposing effects on x. On the one hand, when
u− =α σ − − < z (1 )( 1) 1 0
28
Although our qualitative results were largely unaffected in more general cases, the example allows us to derive simple closed form solutions to the problem.
29 The second order conditions associated with (11) and (12) are, respectively:
and
(
)
1 1 1 0 − = −α σ − − < .Since α <1, σ <2 ensures that both
of these inequalities hold.
his/her share in total profit (S) increases, party F tends to provide more input x, as this
raises the reward to his/her input. We call this the “share effect”. On the other hand,
an increasing share S means a decreasing share of party D in total profits (1-S),
leading to a decreasing input from D, which in turn tends to reduce productivity and
hence total profit. This decreases the marginal return to F’s inputs, and hence induces
F to provide less input. We call this the “strategic effect”. The overall effect turns out
to depend on the value of S: when S is low (high), the “share effect” (“strategic
effect”) dominates, leading to a positive (negative) relationship between S and x.
Equations (13) and (14) imply that x and y could possibly be negative. Yet, we
assumed that neither x nor y can take a value below zero (non-negativity assumption).
It follows that:
(15) if x1 <0, x=0 ⇒
[
]
(
)
1
2 arg max (1 ) (0, ) 1
u z
y
y= y ≡ −S π y −ry =⎣⎡β −S a Q⎤⎦ −b
(16) if y1 <0, y =0 ⇒
[
]
1
1 1
2 arg max ( , 0)
z u
x
x=x ≡ Sπ x −rx =⎣⎡αSb Q− ⎤⎦− −a
Note that x ( ) is monotonically increasing in S(1-S). Using the non-negativity
assumption and combining equations
2 y2
(13) to (16), the equilibrium levels of the inputs
and contributed respectively by F and D are given by : *
x y*
x S1( ) , x1 >0,y1 >0
(17) x*= x S2( ) , x2 >0,y1<0
0 , otherwise
y S1( ) , x1 >0,y1 >0
(18) y*= y S2( ) , y2 >0,x1<0
0 , otherwise
5.3 Relationship between ownership and productivity: We now investigate the
share of foreign ownership (S) and firm productivity (v*)31. Substituting (17) and (18)
into (6), we obtain the equilibrium value of productivity as a function of S, i.e.:
(19)
(
)
1 2
1 ( ,1 1) 1
v =v x y =⎡⎣Sα −S βα βα βQ⎤⎦ −σ , x1>0,y 1>0
*
v = v2 v(0,y2) a (y2 b) a
(
1 S a Q)
u z βα β α⎡β ⎤
= = + = ⎣ − ⎦ , x1<0,y2 >0
1 1
3 ( , 0)2 ( 2 )
z u
v v x x a b Sb Q b
α
α β ⎡α − ⎤− β
= = + = ⎣ ⎦ , y1<0,x2 >0
v4 =v(0, 0)=a bα β , otherwise
From (19), it is straightforward that 1
( )0 v
S
∂ ≥ <
∂ if S≤ (>) α. In words, v1 is an inverse
U-shaped function of S, maximized at S =α. Furthermore, 2
0 v S ∂ < ∂ , 3 0 v S ∂ >
∂ , and
4 0 v S ∂ = ∂ .
What conclusions can we draw from the above analysis about the effects of
the degree of foreign ownership on owners’ inputs and corporate productivity? As can
be seen from equations (17)-(19), depending on the model parameters, x*, y*, and v*
could either be linked to S by an inverted U-shaped relationship, or be monotonically
increasing or decreasing in S, or be independent of S. This implies that, in general, the
impact of S on x*, y*, and v* is ambiguous.
However, under reasonable parameter ranges, the model yields clear-cut
predictions on the relationship between foreign ownership (S) and firm productivity
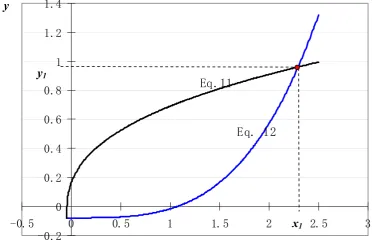
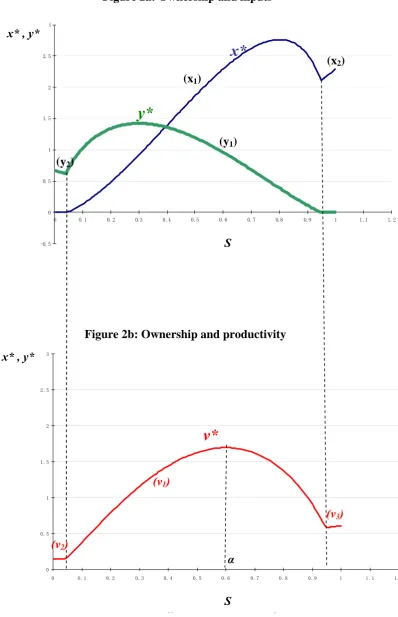
(v*) that broadly fit the empirical results obtained in section 4. Figures 2a and 2b,
which plot the values of x*, y*, and v* against S, illustrate a situation of this type32.
The following important features emerge. First, the best performing
joint-venture is more productive than the wholly foreign owned company, which in turn
outperforms the purely domestic company. This can be expressed as follows:
(20) v*(α)>v*(1)>v*(0)
31
These predictions can be generalized to other types of firm performance indicators such as profitability (π), which are monotonically increasing in v* (see equation 8).
32Like figure 1, figures 2a and 2b are based on the parameter values: σ=1.5, α=0.6, r=1, B=10, a=0.05, b=0.08. Note that v4 does not appear in figure 2b, as it requires that x*= y*=0, which only occurs
Note that according to (19) and (13)-(14), v* (0)=v2(0) , v*(1)=v3(1) , and
1
* ( ) ( )
v α =v α . As shown in Appendix 2A, it follows that necessary and sufficient
conditions for (20) are that both a and b are sufficiently small, and that a is
sufficiently small relative to b (given α β, and Q). In word, the above pattern of
productivity ordering requires that both the foreign and domestic party’s inputs are
crucial to the joint-venture’s productivity performance, with the foreign party’s inputs
being relatively more important. This is consistent with the fact that, in developing
countries, the foreign parties of joint-ventures usually provide core technology and
design of the products, which are often regarded as “key inputs” to production and,
hence, to productivity.
Second, for a joint-venture with an intermediate ownership share S (between
5% and 95% in our example), there exists an inverse U-shaped relationship between
the share of foreign ownership and productivity, with maximum productivity level at
α
=
S . As shown in Appendix 2B, this feature requires that v*(S) is dominated by the
inverse U-shaped function , which in turn requires that both parameters a and b
are sufficiently small. To understand the intuition behind this inverse U-shaped
relationship, it is important to note that the firm’s productivity depends on the joint
inputs from both parties. As can be seen from figures 2a and 2b, when S is low, the
input contributed by party F is low, leading to relatively low productivity. Similarly,
when S is high, party D’s contribution is low, which once again leads to relatively low
productivity. This is because, as shown in section 5.1, the contributions of inputs x
and y to overall firm productivity are characterized by decreasing return to scales.
Hence, a high S (1-S) leads to “undersupply” of input y(x), as the marginal return to
this input is relatively high, and to “oversupply” of input x (y), whose marginal return
is low. It is only when S is at an intermediate level, which depends on the relative
marginal returns of the two inputs, and equals the foreign owner’s share in the
productivity function (
1( )
v S
α) that the joint inputs contributed by both parties lead to the highest productivity of the joint-venture. This result mirrors a well-known conclusion
from the “property rights” theory of the firm, according to which the optimal
allocation of property rights should assign more assets to the party whose investment
has greater impact on production (Grossman and Hart 1986, Hart and Moore 1990).
Third, when foreign ownership (S) is very low (high), firm productivity (v*) is
figure 2a, when S is very low (<5% in this example), party F will always provide zero
inputs, meaning that a marginal increase in S will decrease party D’s share in total
profits (1-S). This will reduce party D’s incentive to contribute to production (y*),
leading to a lower level of total productivity. Reasoning analogously, when S is very
high, party D will always provide zero inputs, whilst party F’s incentive to contribute
to production will increases in S. Consequently, productivity will increase in S.
To conclude, although the above theoretical predictions on the relationship
between ownership and performance depend on model parameters, and in particular
on the degree of “indispensability” of both parties’ inputs (a, b), the key merit of this
theoretical model is to provide a rationale for why there could exist a productivity
ordering between joint-ventures, wholly foreign owned firms, and purely domestic
firms, and an inverse U-shaped relationship between the degree of foreign ownership
and corporate performance, similar to those empirically revealed in sections 2 and 4.
This rationale hinges on the strategic interactions between the owners’
non-contractible inputs, and the optimal allocation of ownership according to the relative
importance of each owner’s inputs.
6. Conclusions
We have used a panel of 21,582 unlisted Chinese firms over the period 2000-2005 to
analyze the relationship between the degree of foreign ownership and corporate
performance. Focusing on the return on assets, the return on sales, labor productivity,
and TFP, we have found that joint-ventures generally perform better than purely
foreign owned and purely domestic firms. This finding is robust to defining
joint-ventures on the basis of the capital paid in by various foreign agents, and on the basis
of registration information. It can be explained considering that both the domestic and
foreign parties of a joint-venture bring in attributes essential to achieving high
performance. Specifically, the former contribute knowledge of the Chinese market
and legal environment, as well as important political connections with local
governments; and the latter, modern technologies, capital, better corporate governance
through monitoring and market discipline, and managerial and international
networking skills.
We have then shown that foreign ownership and the performance of our
Chinese firms are linked by an inverted U-shaped relationship. Specifically, corporate
depending on the measure of performance used, and declines thereafter. This suggests
a certain degree of domestic ownership is necessary to ensure optimal performance.
Furthermore, it is those firms owned by investors other than those originating from
Hong Kong, Macao, and Taiwan that benefit most from their foreign ownership.
Finally, we have rationalized these results with a simple theoretical model of a
joint-venture, where, under plausible conditions, strategic interactions between the
non-contractible inputs contributed by a foreign and a domestic owner may lead to a
non-monotonic relationship between a firm’s degree of foreign ownership and its
performance similar to that found in our data.
Our findings contribute to understanding the link between FDI and economic
growth: in countries where FDI inflows are large and mainly take the form of
joint-ventures between domestic and foreign firms, the effect of FDI penetration on the
performance of recipient firms could be an important channel through which FDI
affects economic growth. Attracting more FDI in the form of joint-ventures could
hence be beneficial to long-run growth.
Appendix 1: Data
A. Structure of the unbalanced panel
Number of obs. per firm
Number of observations
Percent Cumulative
2000 11,813 12.77 12.77
2001 13,864 14.98 27.75
2002 15,822 17.10 44.84
2003 16,564 17.90 62.74
2004 17,665 19.09 81.83
2005 16,814 18.17 100.00
Number of obs. per firm
Number of observations
Percent Cumulative
1 1,404 1.52 1.52
2 5,922 6.40 7.92
3 8,052 8.70 16.62
4 12,616 13.63 30.25
5 18,630 20.13 50.38
6 45,918 49.62 100.00
Total 91,139 100.00
B. Definitions of the variables used
Ownership variables
Minority foreign: dummy variable (DV) equal to 1 if the share of the firm’s total
capital owned by foreign investors is positive but lower than 50%, and 0 otherwise.
Majority foreign: DV equal to 1 if the share of the firm’s total capital owned by
foreign investors is greater than or equal to 50% but lower than 100%, and 0
otherwise.
All foreign: DV equal to 1 if the share of the firm’s total capital owned by foreign
investors is equal to 100%, and 0 otherwise.
Foreigncap: share of the firm’s capital paid in by foreign investors (including
investors from Hong Kong, Macao, and Taiwan).
HMT Foreigncap: share of the firm’s capital paid in by investors from Hong Kong,
Macao, and Taiwan.
Non HMT Foreigncap: share of the firm’s capital paid in by foreign investors other
than those from Hong Kong, Macao, and Taiwan.
Statecap: share of the firm’s capital paid in by the state.
Privatecap: share of the firm’s capital paid in by private investors.
EJV: DV equal to 1 if the firm is registered as an equity joint-venture (registration
codes 210 or 310), and 0 otherwise.
CJV: DV equal to 1 if the firm is registered as a contractual joint-venture (registration
codes 220 or 320), and 0 otherwise.
JV: DV equal to 1 if the firm is registered as an EJV or as a CJV, and 0 otherwise.
WFO: DV equal to 1 if the firm is registered as wholly foreign owned (registration
Corporate performance variables
Return on Assets (ROA): ratio of the firm’s net income to total assets.
Return on Sales (ROS): ratio of the firm’s net income to total sales.
PROD: labor productivity, calculated as the ratio of the firm’s net income to total
number of employees.
TFP: total factor productivity calculated using the Levinsohn and Petrin (2003)
method, applied separately to different industrial groups.
Other variables
Total assets: sum of the firm’s fixed and current assets, where the former include
tangible, intangible, and other fixed assets; and the latter include inventories, accounts
receivable, and other current assets.
Size: logarithm of the firm’s total assets.
Leverage: ratio of current liabilities plus non-current liabilities to total assets, where
current liabilities include loans, accounts payable, and other current liabilities; and
non-current liabilities include long-term debt and other non-current liabilities.
Collateral: ratio of tangible assets to total assets.
Employees: total number of people employed by the firm.
Expdum: dummy equal to 1 if the firm reports a positive value of firm’s overseas
sales, and 0 otherwise.
Deflators: all variables are deflated using provincial GDP deflators, taken from
various issues of the China Statistical Yearbook.
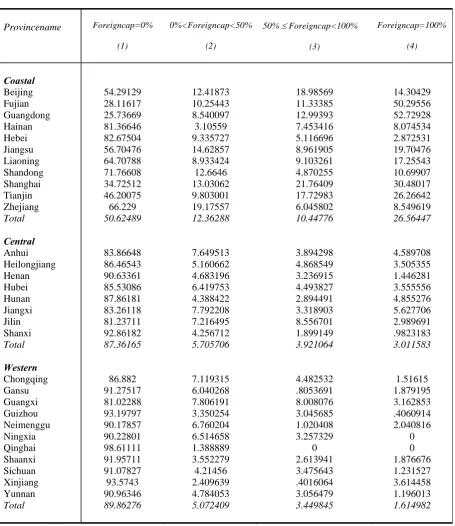
C. FDI patterns by region and industry
Table A1 shows how our observations are distributed among the four foreign
ownership categories described in section 2.2, within China’s 30 provinces, which are
in turn divided into three broad regions (Coastal, Central, and Western)33. We can see
that most of the foreign owned firm-years are concentrated in the Coastal region,
where only 50.62% of the firms are domestically owned. The corresponding figures in
the Central and Western regions are 87.36% and 89.86%, respectively. This
33