1
The Impact of Information Provision on Agglomeration Bonus Performance:
An Experimental Study on Local Networks
Simanti Banerjee (Corresponding Author)
Department of Economics, 227 Rice Hall, 10. North Professor Street, Oberlin College, Oberlin, Ohio, USA, 44074. Ph: +1-440-775-8484, Fax: +1-440-775-6978.
Email: [email protected] Frans P. deVries
Division of Economics, 3B85 Cottrell Building, University of Stirling, UK, FK94LA. Ph: +44-1786-467485, Fax: +44-1786-467469.
Email: [email protected] Nick Hanley
Division of Economics, 3B86 Cottrell Building, University of Stirling, UK, FK94LA. Ph: +44-1786-466410, Fax: +44-1786-467469.
Email: [email protected] Daan P van Soest
Department of Economics and Tilburg Sustainability Center, Tilburg University, P.O. Box 90153, Netherlands 5000 LE Tilburg, Ph: +31–13–466 2072,
Email: [email protected]
Acknowledgements:
2
Improvements to the delivery of ecosystem services from farmland such as habitat protection, biodiversity conservation, carbon sequestration and pest management, can be obtained by adopting pro-conservation land uses on properties otherwise devoted to profit-based agriculture (Swinton et al. 2007). Adopting such pro-conservation land uses is typically costly to the landowner/farmer, meaning that they may require financial compensation for implementing them (Armsworth et al. 2012). As a result, Payment for Ecosystem Services (PES) schemes have been introduced by conservation agencies in many countries to incentivize these changes in land management (Wunder 2005). For example, the Conservation Reserve Program (CRP) in the U.S. has disbursed nearly $26 billion to retire 36.8 million acres of farmland from agriculture to reduce soil erosion and preserve approximately 1.8 million acres of wetland habitats (Kirwan et al. 2005; Ferris and Siikamäki 2009; Cowan 2010). In Europe an increasing fraction of total spending on agriculture goes to funding agri-environmental schemes (Cooper et al. 2009) with further increases planned under reforms to the post-2013 Common Agricultural Policy.
3
patches to create habitat corridor linkages which facilitate species mobility may be beneficial for biodiversity conservation (Margules and Pressey 2000; Dallimer et al. 2010). Further, spatial clustering of organic farm operations can lead to lower negative impacts on water quality by minimizing runoff, can mitigate losses from retiring land to create buffers preventing pesticide spill-over from neighboring conventional farms, and can even reduce certification costs of organic farmers (Parker and Munroe 2007). Finally, creation of large contiguous areas of non-crop habitat for natural predators in the landscape can be more successful in eradicating pests than strategies which ignore such spatially agglomerated habitat management (Landis et al. 2000; Zhang et al. 2010).
One approach to achieving spatial coordination of conservation land uses and land management is the Agglomeration Bonus (AB) subsidy scheme (Parkhurst et al. 2002;
Parkhurst and Shogren 2007).1 The AB is a two-part payment scheme comprising a base level compensation for all participants and a top-up bonus which they receive if their neighbors also participate and implement similar pro-conservation land use practices on their properties. By rewarding coordinated actions across space, land management decisions of neighboring landowners under the AB scheme can be considered to be strategic interactions in a coordination game. This game has multiple Nash equilibria which can be Pareto ranked in terms of payoffs. The existence of multiple equilibria can, however, give rise to coordination failure. Experimental evidence provided by Parkhurst and Shogren (2005; 2007) and Warziniack et al. (2007) indicates that 1) repeated interaction between players during which they become increasingly familiar with the game and are able to view the land choice networks produced as a result of everyone’s choices, 2) simple spatial targets to which
4
participants can coordinate with relative ease and 3) non-binding pre-play communication prior to making a choice, can lead to spatial coordination. Successful coordination on socially desirable land use outcomes is also more likely on landscapes with fewer participants owing to the difficulty of coordination in larger groups (Banerjee et al. 2012).
A key issue that has received limited attention in the AB literature, and which forms the focus of this article, is that the outcome of strategic interactions between landowners depends on the amount of information available to them about other landowners’ land management
choices. This article reports results of a laboratory experiment that varies the information each participant receives about the land use decisions others make within the purview of an AB scheme. Our interest in this issue is motivated by both the nature of relationships within farming communities and the existing scientific literature on equilibrium selection and individual behavior in coordination games. Interpersonal relationships in agricultural communities are a product of socio-economic ties and the private properties’ locations on the farming landscape. Farmers may routinely lend and borrow machinery to/from neighbors, lobby together to influence local or national policy determination, or become members of the same (regional) input-purchasing and marketing cooperatives (Hanson et al. 2004; Parker and Munroe 2007). These ties facilitate the generation and flow of information which is conducive to cooperation with respect to (local) biodiversity and natural resources management (Pretty and Ward 2001; Pretty and Smith 2004; Schusler and Decker 2004; Isaac et al. 2007).
5
and conservation payments earned. The literature on the impact of information on individual decisions in strategic settings supports this claim. Experimental studies suggest that providing more information to subjects increases economic efficiency in terms of Nash equilibria selected in coordination games (Berninghaus and Ehrhart 2001; Devetag 2003) and trust games (Bracht and Feltovich 2009). Yet Wilson and Sell (1997) find that more information reduces efficiency in public good games, while in the study by Duffy and Feltovich (2002) there is no significant impact of providing information about others’ choices on game outcomes. Thus, the impact of information on choices and the Nash equilibria selected is a function of the nature of the strategic environment and the features of the game itself. Therefore, in determining the effectiveness of an AB based policy scheme in delivering environmental benefits via spatially coordinated land management, we need to explicitly consider the impact of varying the information available to landowners, on their land use actions.
This article analyses the impact of varying the information available to student subjects who assume the role of landowners in a laboratory experiment. The laboratory allows us to exercise control over the strategic environment – the testbed (Plott 1997) – and to evaluate the impact of the information treatment on land management decisions and types of spatial patterns produced. The controlled (and context free) laboratory environment permits the “wind-tunnel testing” of the AB incentive scheme for internal validity and analysis of general
6
The experiments involve subjects arranged on a circular local network where each subject is
directly linked to a subset of all individuals in the group (a direct neighbor each in the clockwise and anti-clockwise direction) and indirectly to everyone else through their direct linkages (Jackson 2010). Within this network setup, we vary the information subjects receive by way of feedback after they have made a choice in the AB coordination game. In the baseline control sessions, subjects obtain information about the choices and payoffs of their two direct neighbors. This information feedback format is similar to those implemented in prior AB experiments. In the treatment sessions subjects’ information sets additionally include knowledge about the choices and payoffs of their closest indirect neighbors, i.e., their direct neighbors’ direct neighbors. This treatment specification is different from existing AB
research and is motivated by the fact that while people may be aware of the strategic interactions within their closest domain of interaction i.e. their neighbors, friends, and/or networked partners, they usually do not have full information about all relevant strategic interactions in the economy or within their social network beyond this closest domain (Alós-Ferrer and Weidenholzer 2008). Moreover it is quite likely that the impact of indirectly linked networked individuals’ choices on a single player’s behavior is decreasing with the
distance between them. Given these factors, our experimental treatment investigates the role of the extra feedback information on the emergence and persistence of efficient coordination and effective ecosystem services provision in a strategic AB policy environment.
Note that the impact of more information is ex ante unclear. Receiving information about actions selected by one’s neighbors and neighbors’ neighbors may facilitate coordination on
7
refraining from choosing the efficient strategy too. Our experimental results indicate that providing more information produces a significant difference in subject behavior and resultant AB configurations. Overall there is more efficient coordination in the groups with more information relative to those where information exchange is limited to direct neighbors only. The positive impact of extra information on coordination is substantial, but we also find that, given our payoff parameterization, providing the extra information is not able to prevent the decrease in the share of subjects coordinating on the Pareto efficient equilibrium over time. While in early periods of the experiments more information results in a larger share of subjects coordinating on the efficient Nash equilibrium, with repeated interaction subjects’ behavior switches towards the inefficient, Nash equilibrium with efficient coordination persisting at the localized level only.
The Model
Consider players, indexed representing landowners, each of whom has a fixed position on a landscape represented by a circular local network. This network representation simultaneously introduces a spatial component into the strategic setting and captures the features of farming communities in which social networks play an important role in sustainable resource management (Bodin 2009). On this circular landscape the neighborhood structure is symmetric whereby all landowners have two direct neighbors: one each in the clockwise and anti-clockwise direction.2 These two individuals make up the local
8
neighborhood of a player. Landowners are indirectly linked to other networked individuals via their direct neighbors. This network is illustrated in figure 1.
< Figure 1 about here >
A landowner’s choice set in the AB game is related to how they manage their land. Each landowner owns one plot of land, and can choose between two land management options: . Option refers to conservation management on agricultural land (“land sharing”:
Balmford et al. 2012), and refers to retirement of cropland such as under the CRP with land being converted to nature farming, what Balmford et al. (2012) call “land sparing”. Both land management options thus provide conservation services, but the N type more so than G.3
Let us now specify society’s benefits from environment friendly land management under the two options and Any parcel of land under either land management option yields ecosystem service benefits, , and let these “stand-alone” benefits be larger under than
under .4 Let us assume that and . Environmental agglomeration
3
Of course, the third option is not participating and using the land for intensive agriculture. This possibility is, however, not implemented in the experiment as our focus is on the role of information in influencing landowners’ choice of one conservation strategy over the other. We thus implicitly assume that compensation is sufficiently generous for both conservation strategies to make participation incentive compatible. This assumption is not at odds with reality as PES schemes have been known to overcompensate landowners in order to guarantee participation (Kirwan et al. 2005, Munoz-Pina et al. 2008).
9
benefits exist for both types of land management options. We assume that these benefits are larger for choice than for given the nature of ecosystem services delivered from land sparing and sharing options. Also regardless of network size , we assume that agglomeration benefits denoted by are generated on the basis of similar land use choices made by player ’s direct neighbors only.
Let denote the number of neighboring plots adjacent to that of landowner i, that are under the same land management option as the plot of landowner i. Then the total agglomeration
benefits are denoted by for . Let the benefit values for each strategy be
and . Hence, for any given value of (which, in our circular local
network setup is equal to 0, 1 or 2), both the benefits, , and the agglomeration conservation benefits, , are strictly larger for than for . We assume that the landscape-level environmental benefit contribution of a landowner choosing a management option depends on the direct neighbors’ decisions, but not on those of their indirect neighbors
in order to capture the spatial nature of environmental processes and hence benefits, which are often decreasing with increasing geographical distance. Also, the conservation benefits provided by selecting N are the same independent of whether the direct and indirect neighbors to one’s left (right) choose GN(NG), or NN. The same is true for the G option.
In addition to the conservation benefits of land use, society values agricultural profits too, and these are larger under G than under N. Let denote a landowner’s profits from agriculture. When land is managed for agricultural production, profits are positive (
cultivated land management option is conducive to species that like the “openness” of such fields. Meadow
10
)) whilst they are zero when land is abandoned to nature ( )). Depending on the
land use choice of direct neighbors, the social benefits provided by landowner i’s land use
choice reads as:
(1)
We are interested in the efficiency of land use decisions in the presence of agglomeration benefits, and not in how rents are allocated between landowners and the government (or the tax payer). For simplicity, we therefore assume that landowners receive the full social benefits generated by their pro-environmental land use activities, i.e., they receive subsidies equal to . On the basis of our model, the government thus implements a payment scheme where the subsidy is set at the Pigouvian level5,6 and expression (1) is the total payment received by landowner i when choosing land option . This specification of the payoff function is similar to the one implemented by Parkhurst et al. (2002) and Parkhurst and Shogren (2007) where landowners’ payoffs depend upon the management option and the number of participating neighbors choosing that same action.
5 By making this assumption we ignore the fact that raising funds for subsidies results in welfare losses to society because taxes tend to be distortionary.
11
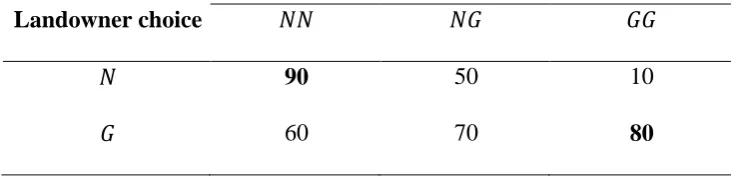
Using the AB payoff function from equation (1), table 1 presents the social (and private) welfare associated with each land management option and corresponding payoffs associated with the AB scheme involving a landowner and their two direct neighbors. On the basis of this payoff table, the AB scheme resembles the Stag-Hunt coordination game. This three-player game has two pure strategy Nash equilibria where all three-players choose G or N. These Nash equilibria are Pareto ranked in terms of payoffs. The payoffs for coordination on N is 90 while the payoffs for coordination on G is 80 – implying that the all-N equilibrium is the Pareto dominant one. On the other hand the Nash equilibrium corresponding to G is the risk dominant Nash equilibrium as the 1) the cost imposed on a player when neighbors deviate and 2) the range within which the payoffs for selecting G for any combination of neighbors’ strategy choices vary is lower if the player chooses G than N.7 At the network level, choice of the same strategy by all K players creates a convention: the Pareto efficient convention all-N
or the risk dominant all-G convention.
Harsanyi and Selten (1988) argue that in such coordination games the players’ collective rationality regarding higher payoffs will lead them to coordinate to the Pareto efficient Nash equilibrium. Yet this outcome is predicated on the risk and payoff dominant Nash equilibria corresponding to the same strategy. In our AB policy setting this is not the case as choosing the natural land management option , while lucrative, is riskier relative to strategy as it yields a higher payoff loss when neighbors don’t coordinate on N. In an environment where
every individual is subject to strategic uncertainty about other players’ choices, this relative risk ranking may make more likely than . The combination of direct and indirect links on local networks increases players’ strategic uncertainty even further. These features, in turn,
may prevent the achievement of the social optimum and lead to the inefficient outcome – a
12
scenario referred to as coordination failure. On the basis of this setup and our conjectures, this study explores the impact of varying the amount of information available to subjects about their neighbors’ previous choices on their likelihood of choosing N and coordinating on the
socially optimum all- outcome.
Experimental Design and Procedures
We consider twelve subjects arranged on a circle with every subject having a direct neighbor to their left and right. These direct neighbors are referred as the clockwise (left) and anti-clockwise (right) neighbors in the experimental instructions. All subjects are randomly assigned an ID ranging from 1 to 12 to preserve player anonymity and identify their direct neighbors. For example, the player with ID equal to 1 is directly linked to players with IDs 12 and 2. Every subject is indirectly connected to the remaining nine players via their direct neighbors. Since landowner identity and location does not change regularly on actual geographical landscapes, we adopt a fixed matching scheme whereby all networked players’
IDs and location remain unchanged during the lifetime of the experiment. Additionally, the fixed matching scheme permits us to study the impact of subjects’ reputation for the play of a particular strategy on other subjects’ choices.
13
direct neighbors and their direct neighbors’ direct neighbors’ (closest indirect neighbors).8
Per our model specification, in both treatments payoffs are determined by own and direct neighbors’ choices only.
< Table 1 about here >
The experiments for this study were conducted at the Laboratory for Economics, Management and Auctions (LEMA) at the Pennsylvania State University in February 2012 using student subjects. In total 144 subjects participated in twelve 12-subject sessions resulting in 6 independent observations for each treatment. The show-up fee was US$5 and experimental earnings were converted into actual currency at the rate of 150 experimental dollars to one U.S. dollar. The experiments were implemented using z-Tree (Fischbacher 2007) and sessions lasted between 45 and 60 minutes. Average subject earning for the 2INFO and 4INFO sessions was US$19.95 and US$22.38 respectively.
At the beginning of every session a figure representing the networked landscape and players’
neighbors was shown to the subjects. Figure 1 represents the landscape information shown to subjects in the 2INFO sessions. In the 4INFO sessions, the location of the closest indirect neighbors were labeled in the figure as well. This diagram is provided in the Appendix. The instructions (which are included in the Appendix) were made available on the computer screen and were read aloud to maintain an environment of common knowledge. Subjects
14
were informed about their role as a landowner with two types of land management actions, which would generate payoffs. No other contextual terminology such as ecosystem services, biodiversity conservation or endangered species was included in the experimental instructions.
We adopted this context free approach to 1) study behavior and land use outcomes while subjects were responding to financial incentives generated by the AB payments and reputational incentives generated during repeated interactions with the same set of neighbors under the two information conditions, and because 2) explicit consideration of non-economic motivations towards conservation that typically vary between private landowners would impose subject heterogeneity in our experiment which although realistic can potentially confound the results of our information treatment (in addition to being orthogonal to it). In keeping with the game theoretic nature of the experiment, the instructions mentioned that subjects’ payoffs would be influenced by their neighbors’ actions. They were also informed
that the game would be repeated for 30 periods. Before starting the experiment, all subjects participated in a quiz about different features of the experiment to verify their understanding of the strategic environment, the game choices and the associated payoffs.
Results
15
General results
Figure 2 and table 2 present the average share of N choices for all sessions for both treatments over 30 periods. We make two observations. First, the average share of N choices in 2INFO falls from 63% to almost zero after 20 periods and then stays under 10% for the remaining periods. In 4INFO, N choices fall from 73% in Period 1 to 18% in Period 30 as well. Hence, with increasing experience the vast majority of the subjects end up choosing the risk-dominant option. This long run result corresponds to theoretical evidence on contagion of risk dominant choices on local networks provided by Ellison (1993) & Weidenholzer (2010) and experimental evidence recorded in Keser et al. (1998) and Berninghaus et al. (2002). The reduction in the frequency of efficient N choices and the increase in instances of coordination failure is also consistent with experimental evidence obtained in other non-network coordination game environments such as the minimum and average effort games (Van Huyck et al. 1990, 1991) and public good games (Andreoni 1988, Keser and Van Winden 2000).
An explanation for this result is that over multiple periods of interaction, most subjects’ strategic uncertainty in the game gets resolved in favor of G since this can reduce the magnitude of payoff loss in the event of their neighbors’ failure to coordinate on the efficient
16
The second observation is that, while the average share of N choices is falling in 4INFO, in every period the value is higher in 4INFO than in 2INFO. Thus, information about choices of more players on the network delays the decay in efficient coordination but cannot prevent it: if Player observes that their direct neighbor Player chooses N but that their indirect neighbor Player chooses G, they may anticipate that Player will most likely switch to G (since choosing G is the best response when neighbors choose different strategies) inducing Player to choose G as well.
In our experiments, transition to G following the above reasoning is likely as the payoff matrix produces conditions which are quite adverse for coordination on the efficient equilibrium. The payoff difference between the NNN and GGG outcomes is 10. This difference is less than the loss associated with choosing N when at least one neighbor deviates from NN to NG (40). Additionally, the payoff difference between a choice of N and G when facing previous choices corresponding to NG is 20. Hence, a player stands to lose much higher payoffs from choosing N repeatedly to influence G playing neighbors to choose N in order to earn a payoff of 90. Thus, the prospect of generating an NNN outcome is not worth the payoff losses needed to do so. As a result, the tendency of voluntary loss making to influence neighbors to choose N is weakened contributing to the decrease in the likelihood of efficient coordination with increasing experience. In fact debriefing of subjects after every session revealed that an increasing number of subjects chose G or switched from N to G
owing to the magnitudes of the out-of equilibrium payoffs relative to the Nash equilibrium ones.
17
light of this scenario, the fact that 1) extra information on the network is able to increase the frequency of N choices under the current adverse payoff circumstances and 2) that in the previous non-network AB studies information about everyone’s choices improves coordination strengthens our result: with more information coordination is less likely to unravel if the circumstances for coordination are already favorable.
< Table 2 about here > < Figure 2 about here >
Let us analyze the result more formally. Table 3 reports the shares of N choices for both treatments using two types of observations: average N choices for the first period taking each subject’s action as an independent observation (implying that there are 6 independent
observations from 6 sessions in each cell of the table) and the same averaged over all 30 periods for 6 groups. Using standard Mann-Whitney tests9 (with corresponding p-values presented in table 3) we find no significant treatment effect in the first period but over the experimental lifetime of 30 periods there is a significant impact of information (at 5% level of significance).
Lack of significance in Period 1 is to be expected as subjects are randomly assigned to both treatments, face the same payoff table, and make decisions without receiving any feedback about others’ choices. Considering all 30 periods together, relative to 2INFO, in 4INFO, subjects’ strategic uncertainty associated with choosing the risky payoff efficient strategy is
lower since they are able to view the current and all previous choices of their direct and closest indirect neighbors. As a result, strategic uncertainty for many players gets resolved in
18
favor of N, leading to an upfront increase in N choices in 4INFO and significantly more N
choices on average in 4INFO relative to 2INFO. This result holds regardless of the fact that owing to the adverse payoff conditions and lack of visibility of more than 50% of the participants’ choices, N choices fall in both treatments with repeated interactions. Our
findings are also supportive of the theoretical model by Alós-Ferrer and Weidenholzer (2008) in which players successfully choose the efficient strategy when receiving information from two direct and two closest indirect neighbors.
< Table 3 about here >
Analysis of spatial patterns on local networks
Having presented the impacts of information and repeated interactions on the frequency with which the Pareto efficient N choice is selected, we now analyze the location of these N
choices and the development of the land choice configurations over multiple periods. In figures 3-5 we present snapshots of the network configurations in each of the six sessions for periods 1, 15 and 3010 where N choices are marked with red triangles and G choices with black circles. The spatial patterns in these periods reflect the difficulty of coordinating on the Pareto dominant all-N equilibrium. While all groups start with between 7 and 9 subjects (mostly adjacent) choosing N in the first period, in the final period, very few adjacent N
choices remain.
10
19
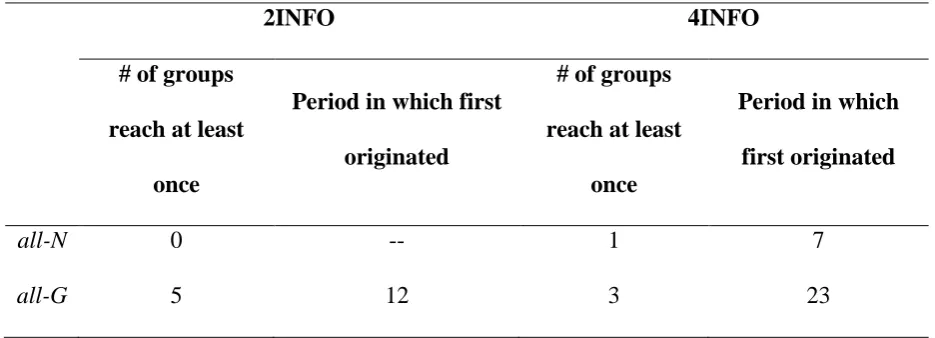
Table 4 presents the number of groups and the earliest period in which any group reached an equilibrium configuration. We find that there is only one cohort which is able to reach an all-N equilibrium in 4INFO. This efficient land use configuration is produced in Period 7 in the sixth cohort and is stable with some variation till Period 22. Beyond this period, only a few localized N choices persist. Of the remaining five 4INFO groups, localized N choices transition to the all-G outcome (which is produced earliest in any of the groups in Period 23) in three groups. In the remaining two, only isolated N choices remain. In 2INFO on the other hand, all-N is never produced and the all-G outcome is obtained earliest in Period 12. This risk dominant network level configuration is both stable and resilient. Of the five groups that reach this pattern in Period 30, two groups never deviate away from it and the three which do revert back to it in 1-2 periods. The stability and resilience of the all-G outcome is consistent with theoretical evidence provided by Alós-Ferrer and Weidenholzer (2006).
< Figures 3-5 about here > <Table 4 about here>
To support a formal analysis of these land use outcomes, we construct a metric to measure the degree of spatial contiguity generated by the AB scheme in terms of contiguous N and G
choices on the circular network. This metric measures the number of localized clusters of similar land use decisions produced by any 3 adjacent players, i.e., a player and their direct neighbors on the network.11 Formally the cluster metric reads as:
20
∑
(2)
where refers to the treatment, indicates whether the metric measures the share of clusters of N choices or G choices, t =1,…,30 denotes period, and =
1 if or = 0 otherwise. This metric can take a minimum value of 0 when no three adjacent players make the same choice implying that subjects cannot coordinate their decisions even within their local neighborhood where choices are always visible. The maximum value of the metric is K=12 which is obtained when a G or N convention is produced. This is because every player is at the center of one distinct local neighborhood. On
the basis of this metric we can evaluate the development of over time to identify how coordinated land use patterns on the network change during the experiment.12 Figure 6
(panels a and b) and table 2 present the average values of , , , and
for all thirty periods.
The positive values of the metric in all periods imply that the AB is able to reduce fragmentation of land uses and incentivize the creation of localized clusters of N and G
choices and the all-N and all-G outcome for the enhanced delivery of ecosystem services such as habitat protection and biodiversity conservation. Additionally, variation in information available about players’ choices produces significant differences in the nature of
these spatial patterns. Table 5 reports the p-values associated with Mann-Whitney tests for
12 We do not present our analysis in terms of the N convention as it originates in only one group and in terms of G convention as most groups coordinate to it with increased experience regardless of treatment. The analysis of
21
the N-clustering and G-clustering metric for all 30 periods (6 independent observations per cell in both cases)13.
<Insert Figures 6a and 6b about here>
< Table 5 about here >
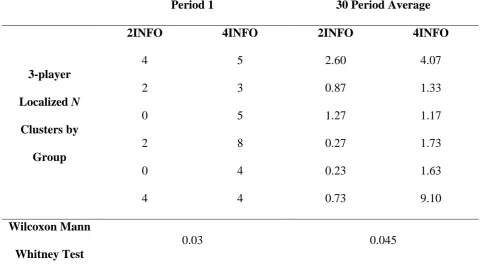
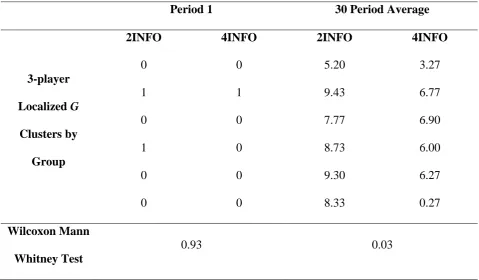
We find that the level of N-clustering is significantly different (p-value: 0.045) in strategic environments with information exchange between more participants than in those where information flows are limited. Thus additional information incentivizes land use patterns corresponding to the efficient Nash equilibrium configuration at least within players’ local neighborhoods. However, with limited information flows and repeated interactions over all 30 periods, nearly all subjects (69 out of 72) switch to G in 2INFO (while there are many subjects still selecting N in 4INFO), so that on average a significant treatment induced difference (p-value: 0.03) in the overall levels of G-clustering emerges as well.
Analysis of individual behavior
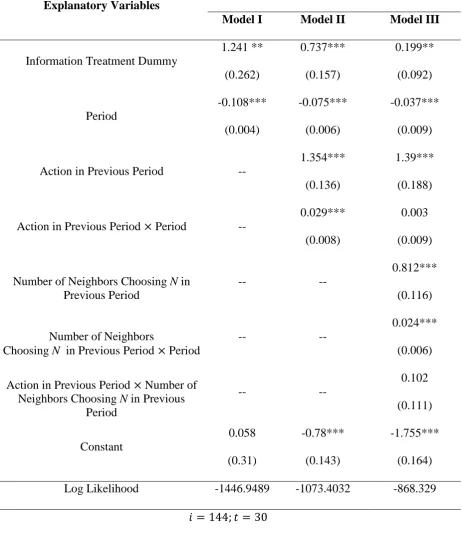
This section presents an analysis of factors affecting individual behavior in the experiment. We model the likelihood of making a socially efficient N choice as a function of a series of factors exogenous and lagged-endogenous to subjects within a dynamic random effects probit regression framework with the subject representing the random effect. The dependent variable is a binary variable taking a value of 1 for an N choice and 0 for a G choice by
subject in period .
22
Three separate models are presented. Model I considers the impact of the two exogenous variables: the information treatment D to which every subject is randomly assigned and the Period variable denoted by that controls for the impact of subjects’ game experience and familiarity within the experimental environment on their likelihood of making an N choice. In addition to these exogenous variables, in Model II the effect of a player’s previous period choice on the likelihood of selecting N in any period is considered. This variable controls for an effect which has been variously termed strategy inertia, a precedence effect or simply “force of habit”. An interaction term between the Period variable and the lagged choice is
included to evaluate whether the role of precedence in determining the likelihood of an N
choice in the current period varies as subjects become more experienced with the game.
Since neighbors’ choices influence own action, another Model III includes a variable
measuring the frequency of direct neighbors’ previous period N choices. This variable can take a value between 0 and 2, depending upon the number of neighbors selecting N. An interaction term between the neighbor choice variable and the Period variable is considered to explore the effect the frequency of neighbors’ choices have on a subject’s likelihood of choosing N at different levels of subject experience. A third interaction term between
and is included to analyze whether force of habit gets reinforced within the local
neighborhood depending on circumstances favorable for efficient strategy choice i.e. the number of neighbors choosing N. All other variables from the two previous models are included in Model III as well.
23
categories. In evaluating model performance, we use the value of the log-likelihood generated during the estimation.
( (3)
<Table 6 about here>
Table 6 presents the regression estimates for the three models. Consistent with our prior discussion the information treatment dummy effect estimate is positive and significant (at 1% level) in all the models. We also obtain a negative and significant estimate for the Period variable in all models providing support for the negative trend in N choices observed for both treatments. This result follows from the strategic uncertainty in the game getting resolved in favor of G owing to the adverse payoff circumstances associated with making an N choice and suffering high payoff losses (20 or 70) given neighbors’ selections.
24
(Brandts and Cooper 2006). Players voluntarily inflict payoff losses upon themselves by choosing N, even if their neighbors are choosing G in order to signal their sustained commitment towards choosing N and build a reputation for selecting N. Such costly signaling can be useful in reducing neighbors’ strategic uncertainty in favor of N, leading them to
switch from G to N in subsequent periods. More generally, the precedent effect also captures the role of human habit in economic decision making: subjects often adhere to what they have done in the past regardless of consequences, since a change requires them to act consciously which is cognitively effortful (Kahneman 2003; Thaler and Sunstein 2008).
The estimate for the interaction between precedence and Period variable is positive and significant in Model II. Per figure 7a that presents the marginal effect of the interaction between own previous choice and Period variable with 95% confidence intervals (generated using routines suggested by Xu and Long (2005) in Stata on the basis of Ai and Norton (2003)) to interpret interactions in non-linear regressions, we obtain a positive and significant interaction effect for all values of Period (none of the confidence intervals include 0). Although the estimate of the interaction term is not significant in Model III, figure 7b indicates a positive and significant interaction effect as well given the nature of the confidence intervals. Thus, per figures 7a & 7b, the effect of precedence on current choice is significantly different at varying levels of subject experience. With increased familiarity in the game habit is harder to break: an N choice made in the previous period in later phases of the game is more likely to be reinforced than when this choice is made in the early phases of the game.
25
Results from Model III provide insights about the likelihood of strategy selection and behavior consistent with the principle of Nash equilibrium. The estimate for the number of direct neighbors choosing N in the previous period is positive and significant (at the 1% level). Sustained choice of N by neighbors reduces a subject’s strategic uncertainty in favor of
N at least within their local neighborhood. Consequently, subjects are more likely to make an
N choice in the current period in order to create or increase the likelihood of creating an N -cluster at the center of which they earn a payoff of 90. This significant effect of neighbors’ choices – taken together with the precedent effect – explains the appearance of the all-N
outcome and localized N clusters in both treatments.
Finally, we focus on the two interaction effects which try to explain subject behavior given a favorable situation for efficient coordination within their local neighborhood. The estimate for the interaction term between the precedent and neighbors’ previous choice variable is positive. Figure 7c provides the diagrammatic representation of the marginal effect of interaction between precedent and number of neighbors selecting N in the previous period for three candidate Period values, 1, 15 and 30. We find the true interaction effect to be significant since 0 is not in any of the confidence intervals. Thus, strategy inertia associated with an efficient N choice is even stronger if more neighbors chose N previously. The interaction term between Period variable and neighbors’ choices is positive and significant (at
1% level of significance). Figure 7d represents the true interaction effect which is positive and significant and interpreted in the same manner. Thus a subject’s likelihood of selecting N
as a function of their neighbors’ previous N choices is higher in later periods. Despite being more likely to choose G in order to avoid suffering payoff losses, with more experience more
26
signal to them to choose N in the current period in order to generate an N-cluster and earn higher payoffs.
These two interaction effects pertaining to the local neighborhood represent the relative impact of the strategic interactions within the local neighborhood and the overall network environment. They suggest that the effect of direct neighbors’ choices are stronger relative to all indirect ones, whereby N-clusters survive in 3 of the 12 experimental sessions in the final Period 30, even if many subjects’ strategic uncertainty is resolved in favor of G. The value of the log-likelihood is the highest for Model III as well, indicating that this model most accurately explains the variability in subject behavior in the experiments that produces different spatial patterns and corresponding conservation benefit streams.
Conclusion
27
Our study is based on the fact that both direct and indirect linkages between landowners in networks can impact the nature of strategic interactions and the resultant likelihood of coordination when information flows between landowners are limited. Then information on the choices of other landowners in the network can reduce strategic uncertainty and improve likelihood of coordination towards the socially optimal outcome. We find that spatial coordination to the Pareto efficient outcome is significantly higher when subjects have more information available about the land management choice and payoffs of their neighbors.
Given that there is considerable generalizability of results from the lab to the field (Camerer forthcoming; Kessler and Vesterlund forthcoming), our study result lends scope for improved coordination to enhance ecosystem services delivery if restrictions on information exchange between landowners are relaxed. One of the many ways to do so would be for university extension staff to liaise with potential participants in an AB-type scheme in a neighborhood (e.g., a catchment), although this comes at a cost. Experience with conservation auctions in Australia suggests that such close contacts between extension personnel and farmers can be crucial to determining the extent of participation and the quality of outcomes (Reeson et al. 2011). Another method would be to disseminate information in farming community networks through internet bulletin boards and key actors (“model” or “demonstration” farmers) who are
linked to many others and can serve to reduce the levels of strategic uncertainty facilitating spatial coordination (Prell et al. 2009)
28
representation since this increases the strategic uncertainty of players to an extent greater than that in the earlier studies; and the experimental parameterization which is adverse to efficient coordination and was chosen keeping in mind that current conservation subsidy budgets have declined following the 2008 recession. In the context of improving the delivery of ecosystem services and other conservation benefits through land management on local networks, this result implies that when participants respond only to financial incentives, in the long run the AB may prove to be only partially effective in generating localized coordination patterns for ecosystem services delivery. For an environmental regulator or conservation agency who is constrained by tight budgets so that they cannot increase the subsidies associated with the conservation-friendly land management actions, finding a way of ameliorating this tendency of coordination to move away from the Pareto optimal outcome (maybe by appealing to participants’ non-economic behavioral & environmental motivations) is important if the
29
Appendix
Experimental Instructions14
General Information:
This is an experiment in decision making. In today's experiment you will participate in a group decision task which involves choosing between two actions. In addition to a $5 participation fee, you will be paid the money you accumulate from your choices which will be described to you in a moment. Upon the completion of the experiment, your earnings will be added up and you will be paid privately, in cash. The exact amount you will receive will be determined during the experiment and will depend on your decisions and the decisions of others. From this point forward all units of account will be in experimental dollars. At the end of the experiment, experimental dollars will be converted to U.S. dollars at the rate of 1 U.S. dollars for every 150 experimental dollars. If you have any questions during the experiment, please raise your hand and wait for the experimenter to come to you. Please
do not talk, exclaim, or try to communicate with other participants during the
experiment. Participants intentionally violating the rules may be asked to leave the experiment and may not be paid.
Group Decision Task:
The experiment will have thirty periods. In each period you will be in a group with 11 other participants. During this experiment each of you will assume the role of a landowner who can
30
adopt one of two types of land use actions on their property. Let these land uses be denoted by M and K. You will receive payoffs from choosing any one of these actions. All the players including you are arranged around a circular which is shown on the board. The black dots on the circle represent the locations of your properties. On this circle, you have two neighbors - a clockwise (C) and an anti-clockwise (AC) neighbor. Your neighbors will be the
same in all periods. You will never know the identity of your neighbors. Your ID will determine who your neighbors are. Thus if you are player 11 then your neighbors are players
10 and 12. Player 12 has you and player 1 as neighbors. Please keep in mind that every player has a different set of neighbors.
Your two neighbors and your neighbors’ neighbors together form your local neighborhood.
For example if you are player 11, then players 9, 10, 12 and 1 make up your local
neighborhood. Note that player 9 is the anti-clockwise neighbor of player 10 and player 1 is
the clockwise neighbor of player 12.
In each period, each one of you will make a choice between action M and action K. You will each receive money based on your choice and the choices of your neighbors. In a moment we will give you a detailed description of your choices and how your payment will be determined. Please raise your hand if there are any questions otherwise click "Continue".
Your Payment from Group Decision Task:
31
experiment. The amounts shown in the table reflect the possible payments you might receive for that period. Each number in the table corresponds to a payment (in experimental dollars) resulting from a possible combination of your choice of M or K (row) and your clockwise & anti-clockwise neighbors’ choices (column). In general, your payoff increases when you choose the same strategy as your neighbors.
Making a choice in a period:
Once the period starts, each of you will choose a strategy (M or K) by clicking on one of the buttons that will appear on the right of your screen. You may change your choice as often as you like, but once you click on OK your choice for that period is final. Note that when you are making your choice, you will not know the choices of others. Also, remember that you will never know the identity of anyone else in your group, meaning that all choices are confidential and that no one will ever know what choices you make.
At the end of each period, your screen will display your choice and payoff and the choices &
payoffs of all players in your local neighborhood for the current period - i.e. your neighbors’
and your neighbors’ neighbors’ choices and payoffs. Information on your accumulated
payment through the current period will also be provided.
32
We are now ready to begin the experiment. On the next screen you will participate in a quiz. Please note that you will not earn any money from participating in the quiz i.e. this is a non-paying period. Your answers in this quiz will not influence your payoffs at the end of the experiment.
Quiz
1) Suppose one of your neighbors plays strategy M and the other plays strategy K. Then your payoff from playing strategy M is 50
2) My neighbor has the same neighbors as I do. FALSE
3) Your neighbors change in every period. FALSE
4) What is your payoff when you chose K and all your neighbors chose M? 60
5) At the end of every period you will be able to see the choices and payoffs of your neighbors players in your local neighborhood.TRUE
Spatial Grid
33
[image:33.595.60.538.142.419.2]Tables Reporting Mann-Whitney Tests
Table I: Period 1 and Period 30 Average N Choices
Period 1 30 Period Average
Group -Level N
Choices
2INFO 4INFO 2INFO 4INFO
9 9 4.66 6.43
7 7 1.7 3.26
7 9 2.7 3.1
7 10 1.66 3.7
6 9 1.36 3.76
9 9 2.1 10.66
Wilcoxon Mann
Whitney Test
[image:33.595.57.539.491.764.2]0.109 0.03
Table II: Period 1 and Period 30 Average Localized N Cluster values
Period 1 30 Period Average
3-player
Localized N
Clusters by
Group
2INFO 4INFO 2INFO 4INFO
4 5 2.60 4.07
2 3 0.87 1.33
0 5 1.27 1.17
2 8 0.27 1.73
0 4 0.23 1.63
4 4 0.73 9.10
Wilcoxon Mann
Whitney Test
34
Table III: Period 1 and Period 30 Average Localized G Cluster values
Period 1 30 Period Average
3-player
Localized G
Clusters by
Group
2INFO 4INFO 2INFO 4INFO
0 0 5.20 3.27
1 1 9.43 6.77
0 0 7.77 6.90
1 0 8.73 6.00
0 0 9.30 6.27
0 0 8.33 0.27
Wilcoxon Mann
Whitney Test
0.93 0.03
References
Ai, C. and E. J. Norton. 2003. "Interaction terms in logit and probit models." Economics Letters, 80(1), 123-129
Alós-Ferrer, C., and S. Weidenholzer. 2006. "Imitations, Local interactions & Efficiency."
Economics Letters 93(2): 163-168
Alós-Ferrer, C., and S. Weidenholzer. 2008. "Contagion and efficiency." Journal of Economic Theory 143 (1): 251-74.
Andreoni, J. 1988. "Why free ride? Strategies and learning in public goods experiments."
35
Armsworth, P. R., S. Acs, M. Dallimer, K. J. Gaston, N. Hanley, and P. Wilson. 2012. "The cost of policy simplification in conservation incentive programs." Ecology Letters 15 (5): 406-14.
Balmford, A., R. Green, and B. Phalan. 2012. "What conservationists need to know about farming." Proceedings of the Royal Society B: Biological Sciences 279 (1739) (July 22): 2714-24.
Banerjee, S., A. M. Kwasnica, and J. S. Shortle. 2012. "Agglomeration bonus in small and large local networks: A laboratory examination of spatial coordination." Ecological Economics 84: 142-52.
Berninghaus, S. K., and K. M. Ehrhart. 2001. "Coordination and information: Recent experimental evidence." Economics Letters 73 (3): 345-51.
Berninghaus, S.K., K.M. Ehrhart, C. Keser. 2002. "Conventions and local interaction structures: experimental evidence." Games and Economic Behavior 39 (2): 177-205.
Blume, L. E. 1993. "The statistical mechanics of strategic interaction." Games and Economic Behavior 5 (3): 387-424.
Bodin, O. and B.I. Crona. 2009. "The role of social networks in natural resource governance: What relational patterns make a difference?" Global Environmental Change 19: 366 - 374
36
Bracht, J., and N. Feltovich. 2009. "Whatever you say, your reputation precedes you: Observation and cheap talk in the trust game." Journal of Public Economics 93 (9–10) (10): 1036-44.
Brandts, J., and D. J. Cooper. 2006. "Observability and overcoming coordination failure in organizations: An experimental study." Experimental Economics 9 (4): 407-23.
Camerer, C. F. “The promise and success of lab-field generalizability in experimental economics: A reply to Levitt and List.” In G. Frechette and A. Schotter, eds. The
Methods of Modern Experimental Economics. Oxford: Oxford University Press, in press.
Carvell, C., W. R. Meek, R. F. Pywell, D. Goulson, and M. Nowakowski. 2007. "Comparing the efficacy of agri-environment schemes to enhance bumble bee abundance and diversity on arable field margins." Journal of Applied Ecology 44 (1): 29-40.
Cooper, T., K. Hart, and D. Baldock. 2009. "The provision of public goods through agriculture in the european union." London: DG Agriculture and Rural Development, Contract No 30-CE-0233091 ⁄ 00-28.
Cowan T. 2010. "Conservation reserve program: Status and current issues. Washington DC: U.S. Department of Agriculture. Available at
http://crs.ncseonline.org/nle/crsreports/10Oct/RS21613.pdf.
37
Dallimer, M., K. J. Gaston, A. M. J. Skinner, N. Hanley, S. Acs, and P. R. Armsworth. 2010. "Field level bird abundances are enhanced by landscape level agri-environmental scheme uptake." Biology Letters 6 (5): 643-6.
Devetag, G. 2003. “Coordination and Information in Critical Mass Games: An Experimental Study.” Experimental Economics 6: 53-73.
Drechsler, M., Johst, K., Wätzold, F., Shogren, J. F. 2010. "An agglomeration payment for cost-effective biodiversity conservation in spatially structured landscapes." Resource and Energy Economics 32: 261-275.
Duffy, J., and N. Feltovich. 2002. "Do actions speak louder than words? an experimental comparison of observation and cheap talk." Games and Economic Behavior 39 (1): 1-27.
Ellison, G., 1993. "Learning, local interaction, and coordination." Econometrica 61: 1047– 1071.
Ferris J, and Siikamäki J. 2009. "Conservation reserve program and wetland reserve program: Primary land retirement programs for promoting farmland conservation." RFF Backgrounder, Resources for the Future.
Fischbacher, U. 2007. "Z-tree: Zurich toolbox for ready-made economic experiments."
Experimental Economics 10 (2): 171-8.
Hanley, N., S. Banerjee, G. D. Lennox, and P. R. Armsworth. 2012. "How should we incentivize private landowners to ‘produce’ more biodiversity?" Oxford Review of
38
Hanson, J., R. Dismukes, W. Chambers, C. Greene, and A. Kremen. 2004. "Risk and risk management in organic agriculture: Views of organic farmers." Renewable Agriculture and Food Systems 19 (04): 218.
Harsanyi, J. C., and R. Selten. 1988. "A general theory of equilibrium selection in games."
MIT Press Books, Cambridge, USA.
Holt, D.W. and S.M. Leasure. 1993. "Short-eared Owl. In The Birds of North America." No. 62 (A. Poole and F. Gill, eds.). The Academy of Natural Sciences, Philadelphia, and The American Ornithologists' Union, Washington, DC.
Isaac, M.E., B.H. Erickson, S.J. Quashie-Sam and V.R. Timmer. 2007. "Transfer of knowledge on agroforestry management practices: the structure of farmer advice networks." Ecology & Society 12(2): 32.
Jackson, M. O. 2010. "Social and economic networks."Princeton University Press.
Kahneman, D. 2003. "Maps of bounded rationality: Psychology for behavioral economics."
The American Economic Review 93 (5): 1449-75.
Keinath, D and M. McGee. 2005. Boreal Toad (Bufo boreas boreas): A Technical Conservation Assessment. Washington DC: U.S. Department of Agriculture, Forest Service, Rocky Mountain Region. Available at:
http://www.fs.fed.us/r2/projects/scp/assessments/borealtoad.pdf [1/2/14]
39
Keser, C and F. Van. Winden. 2000. "Conditional Cooperation and Voluntary Contributions to Public Goods." The Scandinavian Journal of Economics 102: 23–39.
Kessler, J. and L. Vesterlund. Forthcoming. "The External Validity of Laboratory Experiments: Qualitative rather than Quantitative Effects." In "Methods of Modern Experimental Economics", Guillaume Frechette and Andrew Schotter ed. Oxford University Press, UK, in press.
Kirwan, B., R. N. Lubowski, and M. J. Roberts. 2005. "How cost-effective are land retirement auctions? Estimating the difference between payments and willingness to accept in the conservation reserve program." American Journal of Agricultural Economics 87 (5): 1239-47.
Landis, D.A., S. D. Wratten, and G. M. Gurr. 2000. "Habitat management to conserve natural enemies of arthropod pests in agriculture." Annual Review of Entomology 45 (1): 175-201.
Margules, C. R., and R. L. Pressey. 2000. "Systematic conservation planning." Nature 405 (6783): 243-53.
Muñoz-Piña, C., A. Guevera, J.M. Torres and J. Braña. 2008. "Paying for the hydrological services of Mexico's forests: analysis, negotiations and results." Ecological Economics
65, 725–736.
40
Parkhurst, G. M., J. F. Shogren, C. Bastian, P. Kivi, J. Donner, and R. B. W. Smith. 2002. "Agglomeration bonus: An incentive mechanism to reunite fragmented habitat for biodiversity conservation." Ecological Economics 41 (2) (5): 305-28.
Parkhurst, G. M., and J. F. Shogren. 2005. "Does complexity reduce coordination." Applied Economics Letters 12: 447-452
Parkhurst, G. M., and J. F. Shogren. 2007. "Spatial incentives to coordinate contiguous habitat." Ecological Economics 64 (2): 344-55.
Plott, C. R. 1997. "Laboratory experimental testbeds: Application to the PCS auction."
Journal of Economics & Management Strategy 6 (3): 605-38.
Prell, C., K. Hubacek and M. Reed. 2009. "Stakeholder Analysis and Social Network Analysis in Natural Resource Management". Society and Natural Resources 22: 501-518.
Pretty, J., and H. Ward. 2001. "Social capital and the environment." World Development 29: 209–227.
Pretty, J., and D. Smith. 2004. "Social capital in biodiversity conservation and management."
Conservation Biology 18 (3): 631-8.
Reeson, A., K. Williams, and S. Whitten, S. (2011), ‘Targeting Enhanced Spatial Configuration in Biodiversity Conservation Incentive Payment Programs’, paper
presented to BioEcon conference, Geneva, September.
41
Schusler, T.M. and D.J. Decker. 2003. "Social learning for collaborative natural resource management." Society and Natural Resources 15: 309–326.
Sheeder, R. J. and G. D. Lynne. 2011. "Empathy-conditioned conservation." Land Economics, 87 (3): 433-452.
Straub, P. G. 1995. "Risk dominance and coordination failures in static games." The Quarterly Review of Economics and Finance 35 (4), 339–363.
Swinton, S. M., F. Lupi, G.P. Robertson, and S. K. Hamilton. 2007. "Ecosystem services and agriculture: Cultivating agricultural ecosystems for diverse benefits." Ecological Economics 64 (2) (12/15): 245-52.
Thaler, R. H., and C. R. Sunstein. 2008. "Nudge: Improving decisions about health, wealth, and happiness " Yale University Press.
Van Huyck, J.B., Battalio, R.C., Beil, R.O., 1990. "Tacit coordination games, strategic uncertainty, and coordination failure." The American Economic Review 80: 234–248. Van Huyck, J.B., Battalio, R.C., Beil, R.O., 1991. "Strategic uncertainty, equilibrium
selection, and coordination failure in average opinion games." Quarterly Journal of Economics 106 (3): 885–910.
Warziniack, T., J. F. Shogren, and G. Parkhurst. 2007. "Creating contiguous forest habitat: An experimental examination on incentives and communication." Journal of Forest Economics 13 (2–3) (8/6): 191-207.
42
Weidenholzer, S. 2010. "Coordination Games and Local Interactions: A Survey of the Game Theoretic Literature." Games 1: 551-585.
Wilson, R. K., and J. Sell. 1997. "Liar, liar...: Cheap talk and reputation in repeated public goods settings." The Journal of Conflict Resolution 41 (5) (Oct.): 695-717.
Windle, J., J. Rolfe, J. McCosker, and A. Lingard. 2009. "A conservation auction for landscape linkage in the southern desert uplands, queensland." The Rangeland Journal
31 (1): 127-35.
Wunder, S. 2005. "Payments for environmental services: Some nuts and bolts". CIFOR Bogor.
Xu, J. and J.S. Long, 2005. "Confidence intervals for predicted outcomes in regression models for categorical outcomes." The Stata Journal 5: 537-559.
Zhang, W., W. vd. Werf, and S. M. Swinton. 2010. "Spatially optimal habitat management for enhancing natural control of an invasive agricultural pest: Soybean aphid."
43
Footnotes:
1. An alternative approach investigated in the literature is auctions for spatially-coordinated land management project procurement (e.g., Windle et al. 2009).
2. As there are no edge effects, employing a circular network structure implies that all subjects face identical decision problems. This ensures that we are able to isolate the impact of the information treatment (that changes the subjects’ strategic uncertainty in
the coordination game) on choices and AB performance without having to worry about potential confounding problems arising from subjects having different levels of strategic uncertainty owing to a varying number of neighbors.
3. Of course, the third option is not participating and using the land for intensive agriculture. This possibility is, however, not implemented in the experiment as our focus is on the role of information in influencing landowners’ choice of one
conservation strategy over the other. We thus implicitly assume that compensation is sufficiently generous for both conservation strategies to make participation incentive compatible. This assumption is not at odds with reality as PES schemes have been known to overcompensate landowners in order to guarantee participation (Kirwan et al. 2005, Munoz-Pina et al. 2008).
44
owls (Holt and Leasure 1993) typically rely on grasslands for nesting and hunting but thrive less well on land retired from agriculture and abandoned to nature.
5. By making this assumption we ignore the fact that raising funds for subsidies results in welfare losses to society because taxes tend to be distortionary.
6. The reader may argue that given these modeling decisions the regulator can implement the optimal pattern by setting the subsidy equal to 55 or higher if landowners choose N, and zero otherwise. This will make choosing N a dominant strategy, independent of what the other landowners choose – there is no coordination problem. While this is correct, this scheme is not informative in explaining how subjects behave in the presence of subsidies where their payoffs depend on both their own and others’ decisions. Moreover, in the real world the regulator may not be fully
aware of both the opportunity costs of land conservation and the conservation benefits from agglomeration. Then paying landowners the social benefits of their actions would ensure that social welfare is maximized with certainty.
7. Following Harsanyi and Selten (1988), the deviation loss associated with G is 70 and with N is 30.
8. In order to keep the instructions simple, we used the phrase local neighborhood in the instructions for 4INFO sessions to refer to the set of direct & indirect neighbors whose responses would be visible to players in all periods. However, in the Results section of the article, the phrase local neighborhood refers to the set of direct neighbors only.
9. Table I in the Appendix contains data used for the Mann-Whitney tests.
45
11.We conducted the contiguity analysis with cluster sizes of 3 and 2 (which is a weaker measure of contiguity) and obtained the same qualitative results. Owing to the similarity in results and the fact that our AB game is a three-player game nested in a larger local network, in which a 2-sized cluster does not capture all the strategic effects faced by a player, we only include the 3-cluster analysis in this article.
12.We do not present our analysis in terms of the N convention as it originates in only one group and in terms of G convention as most groups coordinate to it with increased experience regardless of treatment. The analysis of localized choices on the other hand is more informative in representing the variability in the land choices observed on the network owing to the treatment implementation and game experience.
13.Data for the Mann-Whitney tests are included in Tables II & III in the Appendix. 14.In 4INFO sessions, in addition to all instructions, subjects saw the italicized text as
46
Table 1: Summary of Parameter Values and Game Payoffs
Market return to abandoned land: r
Market return to managed agricultural land: r(G) = 55 Participation component abandoned land:
Participation component managed agricultural land: Bonus component abandoned land:
Bonus component managed agricultural land:
Direct neighbors’ choices
Landowner choice
90 50 10