EVALUATION OF THE CRITICAL POINTS IN THE VALIDATION OF
500 MG LEVOFLOXACIN TABLETS FOR DISSOLUTION PROFILE
Nils Ramirez Arguedas1*, Esteban González Mora2, Jessica Morera Huertas3, Gustavo Carazo Berrocal4 and Lidiette Fonseca González5
1
Laboratory of Biopharmaceutics and Pharmacokinetics, Pharmaceutical Research Institute, Faculty of Pharmacy, Rodrigo Facio, San Pedro, Montes de Oca, San Jose, Costa Rica. 2
Laboratory of Biopharmaceutics and Pharmacokinetics, Pharmaceutical Research Institute, Faculty of Pharmacy, Rodrigo Facio, San Pedro, Montes de Oca, San Jose, Costa Rica. 3
Pharmaceutical Research Institute, Faculty of Pharmacy, Rodrigo Facio, San Pedro, Montes de Oca, San Jose, Costa Rica.
4
Laboratory of Biopharmaceutics and Pharmacokinetics, Pharmaceutical Research Institute, Faculty of Pharmacy, Rodrigo Facio, San Pedro, Montes de Oca, San Jose, Costa Rica. 5
Laboratory Biopharmaceutics and Pharmacokinetics, Pharmaceutical Research Institute, Faculty of Pharmacy, Rodrigo Facio, San Pedro, Montes de Oca, San Jose, Costa Rica.
ABSTRACT
The method was validated by ultraviolet spectrophotometry for the
determination of levofloxacin 500 mg tablets using dissolution profiles
to establish therapeutic equivalence. The parameters were satisfactory
according to accuracy and precision in a linear range between 2,0
μg/mL and 8.0μg/mL. Both, the relative error and relative standard
deviation were less than 2%, the recovery was on average of 98,5%,
the quantification limit (QL) obtained was 0,47 μg/mL. The effect of
filters Varian ® Full FlowTM of 70 microns used in the dissolution
equipment autosampler Varian ® 7010 and the effect of light were
evaluated. For the effect of the filter, three concentrations levels were
evaluated (3, 5, 7 μg/mL); no change in the recovery were observed
applying a T-test (both sides, 95% limit of confidence). The effect of
light was explored exposing levofloxacin standard’s to natural and
artificial light for 0, 6, 24, 48, 62 and 86 hours. We find that after 24
hours the response have significance’s changes. With a both-sides, 95 % limit confidence ANOVA, the homocedasticity (Leven’s test) and normality test (Shapiro-Wilk) were
checked. In conclude the developed method can be used to determine levofloxacine in tablets
Volume 5, Issue 8, 1482-1492. Research Article ISSN 2277– 7105
*Corresponding Author
Nils Ramirez Arguedas
Laboratory of
Biopharmaceutics and
Pharmacokinetics,
Pharmaceutical Research
Institute, Faculty of
Pharmacy, Rodrigo Facio,
San Pedro, Montes de Oca,
San Jose, Costa Rica. Article Received on 18 June 2016,
Revised on 09 July 2016, Accepted on 30 July 2016
for profile dissolution, and the filter used does not affect, but light effect is important, and
samples must not be handle for more than 24 hours.
KEYWORDS: levofloxacin, validation, filter effect, photosensitivity. INTRODUCTION
Levofloxacin is an antibacterial agent belonging to the fluoroquinolone class and is the
levorotatory isomer of ofloxacin.[1,2] Its IUPAC name is:
(S)-(-)-9-fluor-2,3-dihidro-3-methyl-10-(4-methyl-1-piperazinyl)-7-oxo-7H-pirydo[1,2,3-de]-1,4-benzoxacin-6- carboxylic acid
hemihydrate and its empirical formula C18H20FN3O4 ∙½ H2O with a molecular weight of
370,38 μg/mol.[3]
It is important in the treatment for Gram-positive and some Gram negative bacteria
pathologies as Escherichia coli and Pseudomonas aeruginosa among others.[4] For treatment
of susceptible pathogens, levofloxacin can be administered orally or intravenously in doses of
250 or 500 mg once or twice a day; but in the case of complicated skin infections and in
patients with hospital-acquired pneumonia, it is recommended to use a dose of 750 mg once a
day. [5]
[image:2.595.205.375.471.541.2]The chemical structure is shown below.
Figure 1. Structure of levofloxacin hemihydrate.
Its solubility keeps constant in a pH range of 0,6 to 5,8 (approximately 100 mg/mL),
levofloxacin solutions are unstable when exposed to light so it is recommended to use amber
vials for its storage. [3]
In the literature, various analytical techniques for quantification of levofloxacin appear such
as spectrophotometry or high performance liquid chromatography (HPLC). The
spectrophotometric method is preferred, because the results can be obtained more quickly,
when there is significant interference from the excipients in the formulation, to improve the
analytical sensitivity and when the scan can be automated.[6 ]
El-Brashy and colaborators in 2004 published two procedures for the spectrophotometric
determination of levofloxacin as raw material or in tablets by using chemical reactions for the
formation of colored complexes.[6] Thakkar et al.[7], and Gupta et al.[8] also used
spectrophotometric techniques to quantify levofloxacin in a dissolution study of tablets, in
which absorbance measurements were performed at a wavelengths of 293,0 nm and 293,7nm
respectively. Actually in the official monograph of the Pharmacopoeia of the United States
American (USP) [5] for levofloxacin tablets assays, dissolution and dose uniformity,
spectrophotometry is used as well as Desai et al describes. [9]
In order to verify the quality of levofloxacin tablets by a spectrophotometric method is
intended to validate the method by standard addition not only for pharmacopoeia tests but
also for “in vitro” therapeutic equivalence (dissolution profiles). For this reason, is that as
validation parameters were considered: linearity, accuracy, precision (repeatability and
intermediate precision), specificity for the system and for the method[10,11]; also evaluation of
the critical points for this type of test were performed, such as the use of filters in the
preparation of the samples and its stability to light exposure, even more that instability to
light for these preparations is reported.[5]
MATERIALS AND METHODS
The reference standard used was levofloxacin hemihydrate EUROPHARMA, lot 0706161,
98,83% of purity, and as reference tablets were used ELEQUINE® 500 mg, batch LCE 120,
made in Mexico by Janssen-Cilag.
Being the levofloxacin a photosensitive active ingredient, samples and standards were
covered with sheets of aluminium foil in a light restricted environment. An UV-VIS
spectrophotometer UNICAM Helios β was used for system validation of the analytical
method. Linearity was assessed by three standard calibration curves with the following
concentrations: 2, 3, 4, 5, 6, 7 and 8 μg/mL, 25,0 mL of each standard was prepared with the
appropriate dilution of a stock solution of the reference standard. The limit of quantitation
(LOQ) and the limit of detection (LOD) were also determined referred to the levofloxacin
The intermediate precision of three concentration levels (3, 5 and 7 μg/mL) were carried out
for five days and repeatability of the system at a concentration of 3 ug / mL which was
performed in triplicate.
The following parameters for the validation of the method were evaluated: linearity,
intermediate precision, repeatability and recovery; for validation of the method for the
determination of levofloxacin by standard addition[10.11]. Linearity was performed by standard
addition, by grinding 10 tablets of the drug reference and measuring an equivalent powder
tablets by triplicate, to prepare an equivalent stock solution of 1000 μg/ml levofloxacin base,
which 50 mL placed stock solution in two 25,0 mL volumetric flasks and aliquots of the
levofloxacin reference solution were added to each of the flasks respectively to have
equivalent concentration solutions 3, 4, 5, 6, 7 and 8 μg/mL. The measurements were
performed at a wavelength of 294,0 nm. All preparations were protected from light using an
aluminum foil cover. The homocedasticity system and the method was evaluated by the
Hartley test.[12] Validation`s parameters were calculated using Excel Microsoft Office 2007.
Evaluation of the sensitivity to light was performed at three concentration levels (3, 5 and 7
μg/mL) in triplicate at 0, 6, 24, 48, 62 and 86 hours at each level, through a ANOVA, the
Levene test and Shapiro Wilk test using the Statistic Software SPP 20. SPSS, IBM program.
"IBM SPSS statistics based 20." Chicago, IL: SPSS Inc (2011). The effect of the filter
Varian® Full FlowTM 70 microns, used in the dissolution equipment Dissolutor Varian®
model with auto sampler unit VK7010 VK7010 Varian ® was assessed by triplicate at three
concentration levels (3, 5 and 7 μg/mL) of levofloxacin basis reference standard, comparing
the responses of the preparations before and after filtering.
Determination of the content and the test for uniformity of content for levofloxacin tablets
was performed according to the guidelines of the USP.[5]
RESULTS AND DISCUSSION
Validation of the system and method, as well as assessments filter effect and light sensitivity
of the preparations of levofloxacin was performed at 294,0 nm.[8]
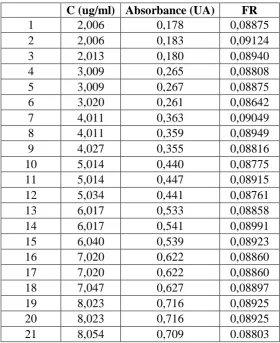
Table. 1. Study of the linearity of the system to levofloxacin
C (ug/ml) Absorbance (UA) FR
1 2,006 0,178 0,08875
2 2,006 0,183 0,09124
3 2,013 0,180 0,08940
4 3,009 0,265 0,08808
5 3,009 0,267 0,08875
6 3,020 0,261 0,08642
7 4,011 0,363 0,09049
8 4,011 0,359 0,08949
9 4,027 0,355 0,08816
10 5,014 0,440 0,08775
11 5,014 0,447 0,08915
12 5,034 0,441 0,08761
13 6,017 0,533 0,08858
14 6,017 0,541 0,08991
15 6,040 0,539 0,08923
16 7,020 0,622 0,08860
17 7,020 0,622 0,08860
18 7,047 0,627 0,08897
19 8,023 0,716 0,08925
20 8,023 0,716 0,08925
21 8,054 0,709 0.08803
Table 2. Results of analysis of variance of the regression line system
Parameter Value obtained
Slope (m) 0,08882
Intercept (b) -0,00003
Correlation coefficient (r) 0,9998
Coefficient of determination (r2) 0,9995
SD slope l 0,00045
SD for the intercept 0,00245
Standard error for y (Sy/x) 0,00417
Average response factor (RF) 0.08884358
CV RF 1.16 %
SD of the RF 0.00103
N (points number) 21
Confidence limits for the term b (-0,00268;0,00758)
Linearity is between 2,0 and 8,0 ug / mL, which meets the criteria for homoscedasticity found
by Hartley test[12] and the determination coefficient is between 0,98 and 1,00.[10]
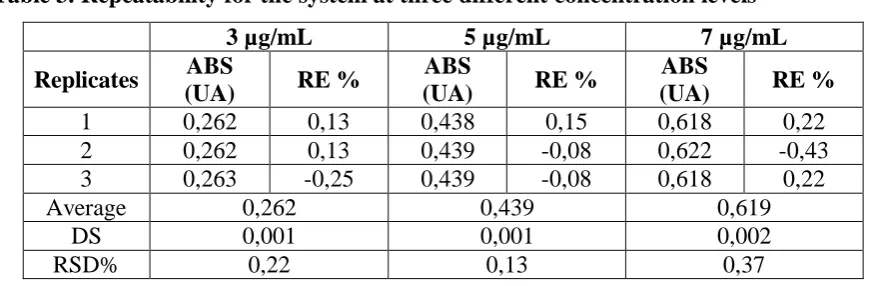
For precision and accuracy of the system we found that both, repeatability (Table 3) and
(CV %) as the relative error percentage (RE % ) it´s not greater than 2 % , in each of the three
concentration levels.[10]
Table 3. Repeatability for the system at three different concentration levels
3 µg/mL 5 µg/mL 7 µg/mL
Replicates ABS
(UA) RE %
ABS
(UA) RE %
ABS
(UA) RE %
1 0,262 0,13 0,438 0,15 0,618 0,22
2 0,262 0,13 0,439 -0,08 0,622 -0,43
3 0,263 -0,25 0,439 -0,08 0,618 0,22
Average 0,262 0,439 0,619
DS 0,001 0,001 0,002
[image:6.595.76.511.137.280.2]RSD% 0,22 0,13 0,37
Table 4. Intermediate precision for the system by five days at three concentration levels
3 µg/mL 5 µg/mL 7 µg/mL
Replicates ABS
(UA) RE %
ABS
(UA) RE %
ABS
(UA) RE %
1 0,266 0,97 0,443 0,94 0,632 0,60
2 0,268 0,22 0,449 -0,40 0,641 -0,82
3 0,268 0,22 0,448 -0,18 0,637 -0,19
4 0,271 -0,89 0,449 -0,40 0,635 0,13
5 0,270 -0,52 0,447 0,04 0,634 0,28
Average 0,269 0,447 0,636
SD 0,002 0,002 0,003
RSD% 0,73 0,56 0,54
The limit of detection (LOD) and the limit of quantitation (LOQ ) were respectively 0,14
µg/mL and 0,47 µg/mL of levofloxacin base, so the range of linearity could be extended.
According to Table 5 (t exp <t critical) there’s no significant difference in the effect of the
filter, indicating that the filter material does not absorb the analyte.
Table 5. Results obtained to evaluate filtering preparations of levofloxacin base solutions with a Varian® Full FlowTM 70 µm filter.
Condition No filtration Filtrated texp tcritic(2,0.005)
Concentration (µg/mL) ABS (UA) DS ABS (UA) DS
4,30
3,02 0,286 0,003 0,287 0,003 1,00
5,03 0,465 0,001 0,463 0,001 1,51
7,05 0,649 0,006 0,647 0, 006 0,65
Note: The results represent the average of three replicates in each of the conditions and to
Evaluation for light influence is shown in Table 6, these data were used to perform a two tails
ANOVA at a confidence level of 95%; for this, a Levene test were performed previously,
from which was observed that there is homoscedasticity in the data (p = 0.06, greater than or
equal to = 0.05 for a confidence level of 95%) and Shapiro-Wilk test, which indicates that
the data meets the assumption for normality (p = 0.05, greater than or equal to = 0.05 for a
confidence level of 95%). The ANOVA analysis showed that there are significant differences
in the data (p = 0.001, greater than or equal to = 0.05 for a confidence level of 95%), while
0 and 24 hours have no significant differences (p = 0.071, greater than or equal to = 0.05
for a confidence level of 95%). There is a difference between time of 24 hours and 48 hours.
Turkey test found no significant differences between times 0 and 6 hours but since 24 hours
there is a significant difference. Therefore, it requires working solutions in a shorter period,
less than 24 hours.
Table 6. Evaluation of the stability of levofloxacin exposed to natural and artificial light
Day 0 Day 1 Day 2 Day 3
Cn (µg/mL) 0 hours 6 hours 24 hours
3,02 0,279 0,281 0,283 0,287 0,286 0,288
5,03 0,461 0,464 0,466 0,471 0,469 0,470
7,05 0,650 0,646 0,649 0,652 0,650 0,653
Note: The results represent the average of three replicates in each of the conditions and to
each concentration level.
With USP method we determine the content and labeling percentage for reference
levofloxacin tablets, table 7 and 8.[5]
Table 7. Determination of content for levofloxacin base tablets for the reference (Elequine ®)
Muestra Mass (g) ABS sample (UA)
Concentration (mg/mL)
Content (mg/mL)
% of labeling
I 0,1402 0,456 0,0051 511,65 102,33
II 0,1402 0,450 0,0050 504,92 100,98
III 0,1404 0,456 0,0051 510,92 102,18
Promedio 509,2 101,8
DS 3,7 0,7
DSR% 0,7 0,7
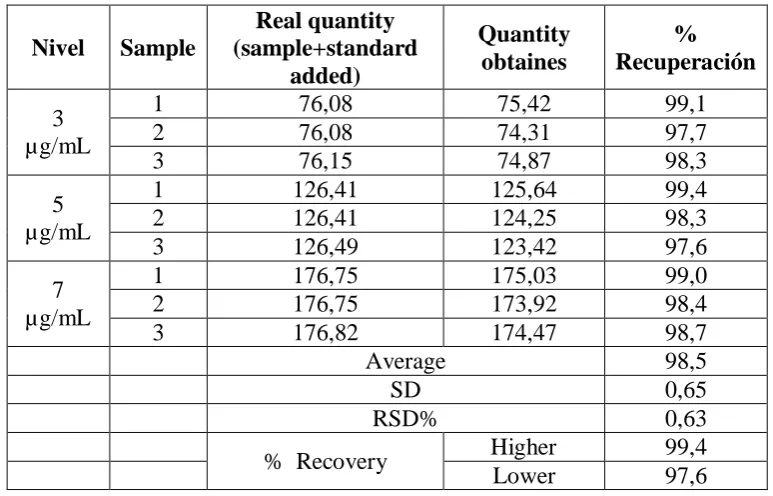
Table 8. Recovery obtained for levofloxacin tablets by standard addition at three concentration levels.
Nivel Sample
Real quantity (sample+standard
added)
Quantity obtaines
% Recuperación 3
µg/mL
1 76,08 75,42 99,1
2 76,08 74,31 97,7
3 76,15 74,87 98,3
5 µg/mL
1 126,41 125,64 99,4
2 126,41 124,25 98,3
3 126,49 123,42 97,6
7 µg/mL
1 176,75 175,03 99,0
2 176,75 173,92 98,4
3 176,82 174,47 98,7
Average 98,5
SD 0,65
RSD% 0,63
% Recovery Higher 99,4
Lower 97,6
As found in Table 7, the tablets are within the specification for the product, knowing this
information recovery determination was performed at three levels by adding standard with
equivalent concentrations to 3, 5 and 7 ug / mL. The recovery is between 97,6 and 99,4 %
which is within recommended specification for this type of methodology, 97,0 to 103,0 %,
with a lower RSD of 2% (Table 8). [10]
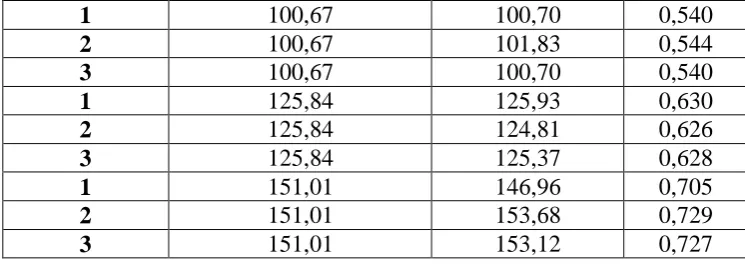
For standard addition method for levofloxacin tablets it complies to homoscedasticity criteria
(evaluated by test Hartley) and the determination coefficient is between 0,98 and 1, at table 9
and 10 linearity for standard addition data is presented.
Table 9. Correlation between the results found by adjustment and by added to the sample, and linearity for the added amount + sample quantity vs ABS
Stock solution Quantity added+ Sample quantity (µg)
Adjust quantity (µg)
ABS (UA)
1 25,17 25,30 0,271
2 25,17 24,18 0,267
3 25,17 24,74 0,269
1 50,34 52,21 0,367
2 50,34 51,09 0,363
3 50,34 50,25 0,360
1 75,50 76,04 0,452
[image:8.595.104.491.111.359.2]1 100,67 100,70 0,540
2 100,67 101,83 0,544
3 100,67 100,70 0,540
1 125,84 125,93 0,630
2 125,84 124,81 0,626
3 125,84 125,37 0,628
1 151,01 146,96 0,705
2 151,01 153,68 0,729
3 151,01 153,12 0,727
[image:9.595.110.483.72.204.2]
Table 10. Parameters for data of table 9.
Parámetro Valor obtenido
Pendiente (m) 0,00357
Intercepto (b) 0,18074
Coeficiente de correlación (r ) 0,9996 Coeficiente de determinación (r2) 0,9992
DS de la pendiente 0,00002
DS del intercepto 0,00204
Error estándar de y (Sy/x) 0,00518
The repeatability of the method is shown in Table 11, where it is found that it meets the RSD
% according to the criteria established for accuracy wich are less than 2 %, at each of the
concentration levels. For intermediate precision is found that for each day, criterion is
fulfilled of less than 2 %. In the case of intermediate precision, Table 12, F-test was applied
to establish whether there was similarity or not for the variances of both groups and therefore
there is no significant difference being the values obtained by the same analyst , on different
days(Fexperimental< Fcritic for (Fn1-1 / Fn2-1 α = 0.05). By applying the T-Student test using
Microsoft Office Excel 2007 (n-2 and α = 0.05) the experimental value turned out to be less
than the table value, demonstrating no significant difference between the average achieved by
[image:9.595.64.534.600.751.2]the same analyst on different days.
Table 11. Repeatability by addition standard method at three concentration levels
3,02 µg/mL 5,03 µg/mL 7,05 µg/mL
Réplica
Adjusted concentration,
µg/mL
Replicas
Adjusted concentration,,
µg/mL
Replicas
Adjusted concentration,
µg/mL
1 3,08 1 5,07 1 7,05
2 3,04 2 5,03 2 7,03
3 3,02 3 5,09 3 7,05
Average 3,05 Average 5,06 Average 7,04
SD 0,03 SD 0,03 SD 0,01
Table 12. Intermediate precision by standard addition method. Same analyst at different days (μg/mL)
5,06 5,07
5,06 5,03
5,07 5,09
5,03 5,04
5,10 5,07
Conc media= 5,06 Conc media= 5,06
S =0.02510 S= 0,02449
Fexp= 1,05
Ftab=6,39 (Fn1-1/Fn2-1),
= 0,05)
Texp=0,26 Ttab=1,86
n-2 = 0,05
CONCLUSIONS
The analytical method complies with the specifications in a linear range of 2,0 to 8,0 µg/ mL,
with respect to linearity, accuracy and precision. Full FlowTM Varian® filters of 70μm used
for determining the dissolution profiles do not absorb levofloxacin; therefore does not affect
its recovery. This implies that the methodology is appropriate for the analysis of dissolution
profiles of tablets of levofloxacin by the automated system dissolutor Varian VK7010 ®
model.
Because of its light stability, levofloxacin preparatiions should be protected from light and
used within a period no longer than 24 hours.
REFERENCES
1. Drug Information of the Health Care Professional. (USP DI). Vol 1. 277th ed.
Massachusetts:Thompson Micromedex; 2007.
2. Valenti J, Cardenas E, Azanza J, Muñoz M, García E. Levofloxacino. Experiencia clínica
en tratamientos de larga duración de infecciones osteoarticulares. Rev Med Univ
Navarra,. 2002; 46(3): 23-27.
3. FDA. Levaquin. USPI Proposed Interactions with Laboratory or Diagnostic Testing.
[online] 2016 [date of access April, 11, 2016]. FURL rom available at:
http://www.accessdata.fda.gov/drugsatfda_docs/label/2006/020634s039,020635s042,021
721s006lbl.pdf
5. United States Pharmacopoeia 38 (USP). 38th ed. Rockville: U.S. Pharmacopoeial
Convention Inc; 2015.
6. El-Brashy A, Metwally M, El-Sepai F. Spectrophotometric Determination of Some
Fluoroquinolone Antibacterials through Charge-transfer and Ion-pair Complexation
Reactions. Bull Korean Chem Soc, 2004; 25(3): 365-372.
7. Thakkar V, Shah P, Soni T, Parmar M, Gohel M, Gandhi T. Goodness-of-Fit
Model-Dependent Approach for Release Kinetics of Levofloxacin Hemihydrates Floating Tablet.
Dissolution Technol,. 2009; 16(1): 35-39.
8. Gupta Gupta V, Bonde C. Statistical Assurance of Process Validation by Analytical
Method Development and Validation for Levofloxacin IR Tablets and Blend. Int.J.
PharmTech Res, 2009; 1(3): 921-924.
9. Desai VN Desai, Ozadheoghene E Ozadheoghene, Afieroho, Dagunduro BO Dagunduro,
Okonkwo TJ, Ndu Okonkwo and CC Ndu. A Simple UV Spectrophotometric Method for
the Determination of Levofloxacin in Dosage Formulations Tropical Journal of
Pharmaceutical Research. 2011; 10(1): 75-79.
10.Ministerio de Salud. Guía de Validación de Métodos Analíticos. [online] 2016 [date of
access April, 11, 2016]. FURL rom available at :
http://www.ministeriodesalud.go.cr/index.php/tramites-ms/registro-de-productos-de-
interes-sanitario/medicamentos-1/documentos-de-interes-3/guias-de-registro-medicamentos/2472-guia-de-validacion-de-metodos-analiticos/file
11.International Conference on Harmonisation of technical requirements for registration of
pharmaceuticals for human use. ICH Harmonised Tripartite Guideline. Validation of
Analytical Procedures: Text and Methodology Q2(R1). [on line] 2016 [date of access
April, 11, 2016]. FURL rom available at:
http://www.ich.org/fileadmin/Public_Web_Site/ICH_Products/Guidelines/Quality/Q2_R1
/Step4/Q2_R1__Guideline.pdf
12.Correa JC, Iral R, Rojas L. Estudio de potencia de pruebas de homogeneidad de varianza.