INTRODUCTION
The sperm whale Physeter macrocephalusforages in the deep waters of the world’s oceans, primarily on meso- and bathy-pelagic cephalopods (Kawakami 1980, Smith & Whitehead 2000, Whitehead 2003). Recently, the analysis of naturally occurring carbon and nitrogen isotope ratios has become an important tool for studying diet (Kelly 2000), and has been suc-cessfully applied to several cetacean species (Abend &
Smith 1997, Hooker et al. 2001, Lesage et al. 2001, Lee et al. 2005) including sperm whales (Ruiz-Cooley et al. 2004). This technique integrates diet over a period of roughly 2 mo (Ruiz-Cooley et al. 2004).
Sperm whale populations are strongly structured both socially, with females living in long-term social units (Whitehead & Weilgart 2000) and, possibly, cul-turally, with social units assignable to vocal clans based on their production of short patterns of clicks (termed codas; Rendell & Whitehead 2003). Groups
© Inter-Research 2007 · www.int-res.com *Email: [email protected]
NOTE
Sperm whale feeding variation by location, year,
social group and clan: evidence from
stable isotopes
Marianne Marcoux
1, 3,*, Hal Whitehead
1, Luke Rendell
21Department of Biology, Dalhousie University, 1355 Oxford Street, Halifax, Nova Scotia B3H 4J1, Canada 2Sea Mammal Research Unit, Gatty Marine Laboratory, School of Biology, University of St. Andrews, St. Andrews,
Fife KY16 8LB, UK
3Present address: Natural Resource Sciences, McGill University, Macdonald Campus 21,111 Boulevard Lakeshore,
Ste-Anne-de-Bellevue, Québec H9X 3V9, Canada
ABSTRACT: We studied the diet of sperm whales Physeter macrocephalusby measuring carbon and nitrogen isotope ratios in 106 sloughed skin samples and 10 squid beaks (Histioteuthidae spp.), the latter collected from sperm whale defecations. Samples were collected during 8 studies conducted between 1989 and 2000 in the South Pacific Ocean. We examined diet variation across region, year, social group and vocal clan. The isotopic signatures of groups and acoustic clans of sperm whales were compared using a nested analysis of variance (ANOVA) and the absolute distances between each pair of samples were calculated. The δ13C and δ15N values ranged from –17.8 to –14.5 ‰ and from 8.5 to 22.3 ‰, respectively. The δ15N values of defecated squids were about 3 ‰ lower than val-ues of the sperm whale, corresponding to a trophic difference of one level. There was a significant difference in both the δ15N and δ13C values between groups (nested within clans and the studies) and clans (nested within studies). Most of the variation was between studies. The latitude at which the samples were collected was inversely related to the δ15N values. We suggest that the differences in diet between the groups from different clans are mainly caused by characteristic behaviour of the clans and differential use of micro-habitats; i.e. groups from a clan with a generally more benthic or inshore distribution had higher δ13C than groups with a more offshore or pelagic influence, a general characteristic of this isotope in marine habitats.
KEY WORDS: Culture · Physeter macrocephalus· Carbon · Nitrogen · Histioteuthidae spp. squid
from different clans seem to differ in their movement patterns and in the way they use their habitat. More-over, differences in feeding success between clans have been observed (Whitehead & Rendell 2004), but it is unclear whether these dissimilarities reflect different diets or different ways of hunting prey. We wanted to test whether the dietary variation of South Pacific sperm whales maps onto social-cultural as well as geo-graphic divisions. We used the stable isotopes ratios in sloughed skin samples to examine how the diet of sperm whales varies with region, year, clan, and social group. We also measured the same ratios in a number of squid beaks from fecal samples to understand how sperm whale isotope ratios relate to those of their pre-sumptive, predominant prey in this region of the Pacific Ocean.
MATERIALS AND METHODS
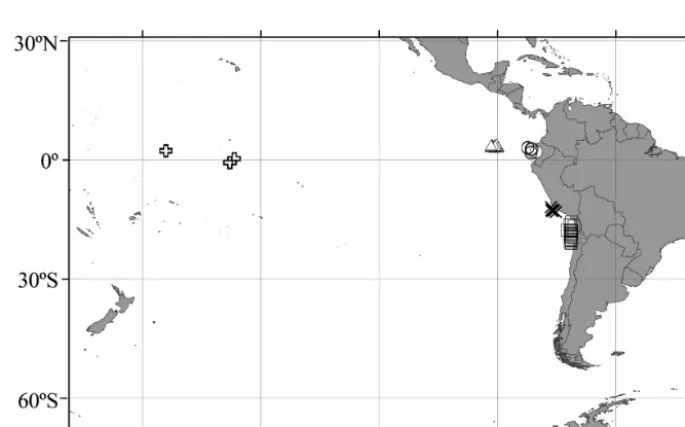
Collection of samples. While in the proximity of sperm whale groups, naturally-sloughed skin samples were collected from 10 to 13 m auxiliary sailing vessels using a dip net, or by snorkellers (Whitehead et al. 1990), off northern Chile in 1993 and 2000, off the Galápagos Islands in 1989, 1991 and 1995, off Peru in 1993, and in the Southwest Pacific in 1992 (Fig. 1). If samples were not from photographically-identified individuals within a group, we used samples of the group from different days or if not possible, from differ-ent encounters during the same day (to minimize the chance of analyzing the skin of the same individual). Squid beaks (Histioteuthis spp.) were gathered from
sperm whale feces off the Galápagos in 1989 and 1991 and Chile 1993 using the same collection techniques as for skin.
[image:2.612.127.470.486.699.2]Storage and preparation of the samples. Most of the skin samples were preserved in dimethyl sulfoxide (DMSO) solution. Squid beaks were preserved in ethanol solution. All samples were prepared following a technique commonly used for marine mammals (e.g. Das et al.2000, 2003, Van de Vijver et al. 2003). The samples were first rinsed with distilled water, then the pieces of skin were lipid extracted by several rinses with a 2:1 mixture of chloroform and methanol for 24 h. Samples were then dried at 50°C for 48 h and ground into a homogenous mixture. Isotopic analysis was com-pleted by the Sinlab at University of New Brunswick and the G. G. Hatch Isotope Laboratory at University of Ottawa. At both laboratories, the isotopic composition was determined by combustion in a Carlo Erba NC2500 Elemental Analyzer followed by a gas chro-matograph separation and an analysis by continuous-flow with a Delta XP or a Thermo-Finnigan Delta Plus isotope ratio mass spectrometer. The standard used for the carbon measurements were Pee-Dee Belemnite carbonate (Craig 1957), and for the nitrogen, atmos-pheric nitrogen (Mariotti 1983) was used. The typical precision obtained by repeated analyses of primary standards at both laboratories was approximately ± 0.2 ‰, for both δ13C and δ15N, which represent about 28 and 5.8%, respectively, of the standard deviation in these measures between our samples of different sperm whales. Among the total samples (n = 106), a subset of 15 were analyzed in duplicate. The average differences were 0.2 and 0.17 ‰ for δ13C and δ15N,
respectively. In addition, to test for possible biases between the 2 laboratories, 6 samples were analyzed in both.
Statistical analysis. The δ13C and δ15N ratios of the samples from females and immature males were com-pared using a nested analysis of variance (ANOVA) within the general linear model (GLM) procedure in SAS V8. We included the independent categorical variables group, clan and study (a combination of the year and the location); the groups were nested within the clans and the study, and the clans within the study. The replicates were skin samples from different ani-mals. Group and clan memberships were determined by Rendell & Whitehead (2003).
RESULTS
The analysis comprised 106 skin samples represent-ing 31 groups from among 4 clans. We discarded 13 samples as their results were outliers (from a stem and leaf plot, their values were more than 1.5 times the dis-tance between the lower and the upper quartiles; McClave & Sincich 2000) and were probably the result of deterioration due to bad storage. In order to test the effect of storage in DMSO, we divided one single sam-ple of skin (collected in 2004), originally stored in ethanol, into 12 pieces. We soaked half of the pieces in DMSO for 2 wk and compared the measured isotopic ratios of these samples to those stored only in ethanol. There was no significant difference in either the car-bon or nitrogen signatures between the DMSO and in those left in ethanol (t-test, t2,10 = 2.23, p = 0.29 and t2,10= 2.23, p=0.93, respectively), a result that concurs with previous studies that found that neither DMSO or ethanol storage significantly affect isotope signatures after lipids are extracted (Hobson et al. 1997, Todd et al. 1997). There was no significant difference between laboratories in the reported isotope ratios of those sam-ples analyzed in both (paired t-test, p> 0.1).
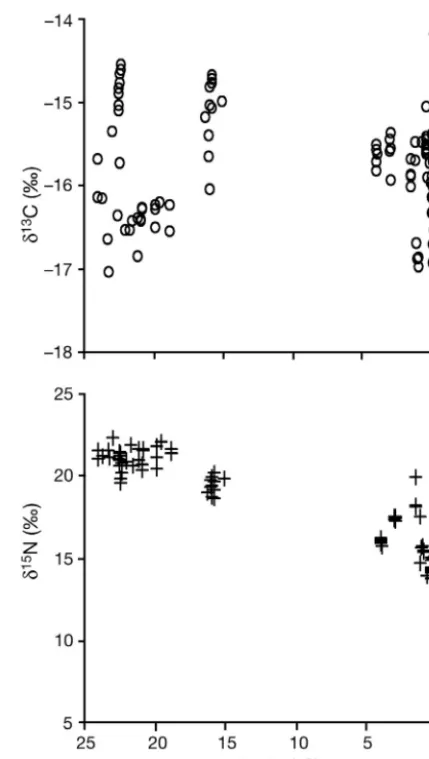
The δ13C ratios of all the sperm whale skin samples (n = 106) ranged from –17.6 to –14.2 ‰ (mean = –16.0 ‰, SD = 0.7 ‰) and the δ15N ra-tios, from 8.5 to 22.3 ‰ (mean = 16.8 ‰, SD = 3.5 ‰) (Fig. 2). These results show substantial variation compared with the results of Ruiz-Castro (2002), but the present study covered much larger space and time scales.
In the ANOVA analysis, residuals in the δ13C model for the sperm whale isotope results were normally distrib-uted but those for the δ15N model were not. Consequently, p-values for tests of
[image:3.612.316.531.148.528.2]statistical significance for the δ15N values should be treated cautiously. Both the δ13C and the δ15N ratios differed significantly among groups (nested within clan and study; Table 1). Often, samples from the same group were closely clustered for both isotopes,
Fig. 2. Physeter macrocephalus. (A) δ13C and (B) δ15N values
(‰) of sperm whale skin samples, vs. latitude (°) of sampling location
Source df Types F p % var
(nesting) SS IV
δδ13C
Group (within clan & study) 16 6.6 3.8 < 0.001 20.1 Clan (within study) 7 3.45 4.48 < 0.001 10.5
Study 6 22.82 34.62 < 0.001 69.4
δδ15N
Group (within clan & study) 16 90 8.88 < 0.001 8.8 Clan (within study) 7 22.82 5.14 < 0.001 2.2
Study 6 909.1 239.0 < 0.001 89
Table 1. Physeter macrocephalus. ANOVA table for the δ13C and 15N values
[image:3.612.243.536.598.722.2]although there are some instances in which samples from the individuals within the same group were quite different, especially in δ15N. There was significant variation among clans for both the δ13C and the δ15N values (nested within the study, Table 1). The sperm whale samples from the ‘Regular’ clan had lower δ13C values than those from the ‘Short’ clan (t-test, t= 6.359, p < 0.001). This difference is consistent across the 2 studies in which the 2 clans are both present (Chile 2000 and Galápagos 1991).
Both the δ13C and the δ15N values differed signifi-cantly among studies (Table 1) and this single factor explains a large part of the variation observed in the δ13C and the δ15N values. Conceivably, some of the inter-study variation observed in the δ15N and δ13C val-ues might in part be caused by the preservative effect of storage in DMSO. However, this preservative effect is largely minimized, and therefore does not affect the above-mentioned results, because the variables ‘clan’ and ‘group’ are both nested within the variable ‘study’.
There was a significant negative relationship be-tween the latitude at which the samples were collected and the δ15N (coefficient= –0.325, r = 0.896, p<0.001, Fig. 2) values, and a significant but very weak relation-ship with the δ13C values (coefficient = –0.018, r = 0.259, p=0.007). The negative relationship with δ15N is still present when all the samples from the Galápagos (which have the lowest δ15N values and are located on the equator) are excluded.
Seven squid beaks from squids taken from near the Galápagos and 3 off Chile were included in the analy-sis. The squid samples from the Galápagos ranged
from –18.6 to –17.3 ‰ (mean = –17.9 ‰, SD = 0.4 ‰) for δ13C and from 7.4 to 12.0 ‰ (mean = 9.6 ‰, SD = 1.5 ‰) for δ15N, while the samples off Chile ranged from –18.2 ‰ to –16.95 ‰ (mean = –17.7 ‰, SD = 0.7) for δ13C and from 17.0 to 18.5 ‰ (mean = 17.9 ‰, SD = 0.8 ‰) for δ15N (Fig. 3). The squid samples off Chile had signifi-cantly higher δ15N ratios (t2,8 = 8.82, p < 0.001) but did not differ in their δ13C ratios (t2,8 = 0.37, p = 0.723).
DISCUSSION
We have shown here that stable isotope ratios (both nitrogen and carbon) in sperm whales vary among groups, clans and geographic areas. These results sug-gest that sperm whale feeding can vary even within the same general area, and that the differences in for-aging behaviour observed between clans (Whitehead & Rendell 2004) are reflected in the prey consumed. These stable isotope results also make sense given what we already know about the social structure in this species.
Some of our data also differ in interesting ways from the results of previous studies, notably 13C levels in general, and 15N levels in females and immatures sam-pled around the Galápagos (c.f. Ruiz-Cooley et al. 2004). The δ13C values in the sperm whale skin sam-ples measured in this study were lower (t-test, t = 8.288, p < 0.001) than those reported by Ruiz-Castro (2002) for sperm whales in the Gulf of California. The Gulf of California is a very productive area with a com-plex hydrographical system (Santamaría-del-Angel & Alvarez-Borrego 1994) and its organic pool is likely different to the ones in the areas of this study resulting in different δ13C values for the sperm whale skin samples.
The δ15N values for the sperm whale skin samples measured in this study generally decrease with increasing latitude. This is consistent with the latitudi-nal gradient of the δ15N values in phytoplankton shown by Wada & Hattori (1991) caused by the low concentra-tion of ammonia and nitrite in tropical areas, and in temperate areas during the summer. The δ15N values from the females and immatures of the 3 study years in the Galápagos appear very low (from 8.5 to 20.0 ‰, mean of 13.9 ‰) compared to the other locations in this study (e.g. in Chile, from 19.6 to 22.3 ‰, mean of 21.1 ‰) and to mean δ15N values reported for females and immatures in the Gulf of California (19.6 ‰; Ruiz-Castro 2002). In this study, the average δ15N values of the squid prey (Histioteuthis spp.) off the Galápagos (9.6 ‰) were also lower (t-test, t = 11.192, p < 0.001) than the δ15N values for the same squid genus off Chile (17.9 ‰; Fig. 3). In both cases, the mean δ15N values of the sperm whales were about 3.5 ‰ higher than values
-19 -18 -17 -16 -15 -14
5 10 15 20 25
Squid gal Squid chile Sperm gal Sperm chile CATEGORY
δ13C (‰)
δ
15
[image:4.612.79.271.80.273.2]N (‰)
Fig. 3. δ13N vs. δ15C values (‰) of Histioteuthisspp. beak
sam-ples from sperm whale defecations off Chile (+) and Galápa-gos (x) plotted along with mean δ13C vs. δ15N values (‰) per
of the squid beaks (Chile: difference in means = 3.28 ‰, t = 6.60, p = 0.009; Galápagos: difference in means = 4.27 ‰, t= 6.44, p<0.001), which corresponds to a trophic enrichment of one level (Hobson & Welch 1992). Thus, our results for the squid are consistent with the values of the sperm whales and suggest that the same general squid species may be part of the diet of the sperm whales in the 2 locations. The Chilean coast is characterized by upwellings and a very pro-ductive ecosystem (Hebbeln et al. 2000). This is likely to result in high nitrogen ratios as found by Takai et al. (2000) in squid samples.
Clarke & Paliza (2001) argue that Histioteuthid beaks, and beaks of other relatively small squids, found in the stomachs and feces of southeast Pacific sperm whales are ‘prey-of-prey’, the food of the bigger squid (primarily Dosidicus gigas), which are them-selves eaten by the sperm whales. Our results, on the surface, suggest only one trophic level between the sperm whale and the Histioteuthidsquid beaks taken from their feces. The possibility remains that there might be depletion in 15N of the beaks of the Histio-teuthis spp. compared to its muscle, due to differences in metabolic rates in different tissue types, just as there is in Psychroteuthis glacialis(3 to 4 ‰; Cherel & Hob-son 2005). Thus, the Histioteuthidsquids might be only a part of the sperm whale diet feeding on lower trophic levels. Data on enrichment in the various tissues of Histioteuthis spp. is needed to fully evaluate the trophic relationship with sperm whales. However, our results do not support the ‘prey-of-prey’ hypothesis.
The observed differences in isotopic signature of skin samples are consistent with what is known of the social structure of female sperm whales. The significant dif-ferences in both the δ13C and δ15N values between the groups and the clans within most study locations indi-cate that the diets differ in composition at the 2 levels consistently over periods of more than 2 mo (Ruiz-Coo-ley et al. 2004). In general, members of the same group had similar signatures, which is reasonable since they travel together and so are expected to feed on similar prey and thus have similar isotopic signatures.
Previous work has shown that ‘Regular’ clan groups have had generally more inshore distribution patterns than the ‘Plus-one’ clan groups (Whitehead & Rendell 2004). This is consistent with the higher δ13C values of the ‘Regular’ clan groups compared to the ‘Plus-one’ clan groups found in this study (Galápagos 1989, Fig. 3) and the benthic-coastal gradient of carbon stable isotopes found in marine ecosystems (France 1995). Thus, behavioural differences between the groups of the 2 clans are probably at the origin of this difference. There are many examples in the literature of differ-ences in diet within a species; most are explained by environmental, genotypic or class-specific effects, but
in the few cases that are not, cultural transmission acts to maintain the difference (Estes et al. 2003). We pro-pose that the differences in diet between the 4 clans of sperm whales found here reflect cultural variation in foraging behaviour between the clans. Traditions affecting habitat use and food choice can affect the fit-ness of a group. Different habitats have different prey availability and the type of prey eaten influences the fitness of a consumer because each prey has a particu-lar cost and benefit to the consumer (Estes et al. 2003). Major shifts in the food chain are thus likely to affect sperm whale groups and clans differently. Therefore, it is important to include culture in considerations of the management and conservation of this species (White-head et al. 2004).
Acknowledgements. Thanks to S. Walde, C. Barber and J. Gordon for their valuable comments on the manuscript, and to I. Ruiz-Castro for sharing her data. The manuscript was improved by comments from 3 anonymous reviewers. The National Geographic Society and the Natural Sciences and Engineering Research Council of Canada provided funding for fieldwork; M.M. was supported by Le Fonds Québécois de la Recherche sur la Nature et les Technologies and L.R. by a NERC Post-Doctoral Fellowship (NER/I/S/2002/00632).
LITERATURE CITED
Abend AG, Smith TD (1997) Differences in stable isotope ratios of carbon and nitrogen between long-finned pilot whales (Globicephala melas)and their primary prey in the western north Atlantic. ICES J Mar Sci 54:500–503 Cherel Y, Hobson KA (2005) Stable isotopes, beaks and
predators: a new tool to study the trophic ecology of cepholopods including giant and colossal squids. Proc R Soc Lond B 272:1601–1607
Clarke R, Paliza O (2001) The food of sperm whales in the southeast Pacific. Mar Mamm Sci 17:427–429
Craig H (1957) Isotopic standards for carbon and oxygen and correction factors for mass-spectrometric analysis of car-bon dioxide. Geochim Cosmochim Acta 12:133–149 Das K, Lepoint G, Loizeau V, Debacker V, Dauby P,
Bouqueg-neau JM (2000) Tuna and dolphin associations in the North-east Atlantic: evidence of different ecological niches from stable isotope and heavy metal measure-ments. Mar Pollut Bull 40:102–109
Das K, Beans C, Holsbeek L, Mauger G, Berrow SD, Rogan E, Bouquegneau JM (2003) Marine mammals from Northeast Atlantic: relationship between their trophic status as determined by delta C-13 and delta N-15 measurements and their trace metal concentrations. Mar Environ Res 56: 349–365
Estes JA, Riedman ML, Staedler MM, Tinker MT, Lyon BE (2003) Individual variation in prey selection by sea otters: patterns, causes and implications. J Anim Ecology 72: 144–155
France RL (1995) Carbon-13 enrichment in benthic compared to planktonic algae: foodweb implications. Mar Ecol Prog Ser 124:307–312
Hobson KA, Welch HE (1992) Determination of trophic rela-tionships within a high arctic marine food web using δ13C
and δ15N analysis. Mar Ecol Prog Ser 84:9–18
Hobson KA, Gibbs HL, Gloutney ML (1997) Preservation of blood and tissues samples for carbon and stable-nitrogen isotope analysis. Can J Zool 75:1720–1723 Hooker SK, Iverson SJ, Ostrom P, Smith SC (2001) Diet of
northern bottlenose whales inferred from fatty-acid and stable-isotope analyses of biopsy samples. Can J Zool 79: 1442–1454
Kawakami T (1980) A review of sperm whale food. Sci Rep Whales Res Inst 35:199–218
Kelly JF (2000) Stable isotopes of carbon and nitrogen in the study of avian and mammalian trophic ecology. Can J Zool 78:1–27
Lee SH, Schell DM, McDonald TL, Richardson WJ (2005) Regional and seasonal feeding by bowhead whales Bal-aena mysticetusas indicated by stable isotope ratios. Mar Ecol Prog Ser 285:271–287
Lesage V, Hammill MO, Kovacs KM (2001) Marine mammals and the community structure of the Estuary and Gulf of St Lawrence, Canada: evidence from stable isotope analysis. Mar Ecol Prog Ser 210:203–221
Mariotti A (1983) Atmospheric nitrogen is a reliable standard for natural 15N abundance measurements. Nature 311: 251–252
McClave JT, Sincich T (2000) Statistics. Prentice-Hall, Upper Saddle River, NJ
Rendell LE, Whitehead H (2003) Vocal clans in sperm whales (Physeter macrocephalus). Proc R Soc Lond B 270:225–231 Ruiz-Castro RI (2002) Relación Trófica entre el cachalote (Physetermacrocephalus) y el calamar gigante (Dosidicus gigas) en el Golfo de California mediante el análisis de isótopos estables de carbono y nitrógeno. MS thesis, CICI-MAR-IPN, La Paz, México
Ruiz-Cooley RI, Gendron D, Aguiniga S, Mesnick S, Car-riquiry JD (2004) Trophic relationships between sperm whales and jumbo squid using stable isotopes of C and N.
Mar Ecol Prog Ser 277:275–283
Santamaría-del-Angel E, Alvarez-Borrego S (1994) Gulf of California biogeographic regions based on coastal zone color scanner imagery. J Geophys Res C 99:7411–7421 Smith SC, Whitehead H (2000) The diet of Galápagos sperm
whales Physeter macrocephalusas indicated by fecal sam-ple analysis. Mar Mamm Sci 16:315–325
Takai N, Onaka S, Ikeda Y, Yatsu A, Kidokoro H, Sakamoto W (2000) Geographical variations in carbon and nitrogen stable isotope ratios in squid. J Mar Biol Assoc UK 80: 675–684
Todd S, Ostron P, Loein J, Abrajano J (1997) Use of biopsy samples of humpback whales (Megaptera novaeanglia) skin for stable isotope (δ13C) determination. J Northwest
Atl Fish Sci 22:71–76
Van de Vijver KI, Hoff PT, Das K, Van Dongen W and 5 others (2003) Perfluorinated chemicals infiltrate ocean waters: link between exposure levels and stable isotope ratios in marine mammals. Environ Sci Technol 37:5545–5550 Wada E, Hattori A (1991) Nitrogen in the sea: forms,
abun-dances and rate process. CRC Press, Boca Raton, FL Whitehead H (2003) Sperm whales: social evolution in the
ocean. University of Chicago Press, Chicago, IL
Whitehead H, Rendell L (2004) Movements, habitat use and feeding success of cultural clans of South Pacific sperm whales. J Anim Ecol 73:190–196
Whitehead H, Weilgart L (2000) The sperm whale: social females and roving males. In: Mann J, Connor RC, Tyack PL, Whitehead H (eds) Cetacean societies: field studies of whales and dolphins. University of Chicago Press, Chicago, IL, p 154–172
Whitehead H, Gordon J, Mathews EA, Richard KR (1990) Obtaining skin samples from living sperm whales. Mar Mamm Sci 6:316–326
Whitehead H, Rendell L, Osborne RW, Wursig B (2004) Cul-ture and conservation of non-humans with reference to whales and dolphins: review and new directions. Biol Conserv 120:427–437
Editorial responsibility: Howard Browman (Associate Editor-in-Chief), Storebø, Norway