1
Decision Support for Firm Performance by Real Options Analytics
Bernadette Power (Lecturer, UCC), Gavin C Reid (Professor, Abertay and St Andrews) Abstract
This paper develops a real option decision support tool for raising the performance of the firm. It shows how entrepreneurs can use our intuitive tool quickly to assess the nature and type of action required for improved performance. This exploits our estimated econometric relationship between: precipitators of entrepreneurial
opportunities; time until exercise; and firm performance. Our 3D chromaticity plots show how staging investments, investment time, and firm performance, support
entrepreneurial decisions to embed, or to expedite, investments. Speedy entrepreneurial action is securely supported with this tool, without expertise in econometric estimation or in formulae for real option valuation.
Keywords: Real Options, Decision Support, Strategic flexibility, Performance
JEL: C21, C42, G31, L25, M13, M21
I. Introduction
Our research is part of a recent movement, in the fields of managerial economics, finance and decision analysis, which focusses on enhancing a manager’s ability to make superior investment decisions, thus improving the firm’s performance. We argue the merits of a new tool we have developed, that uses real option reasoning, supported by 3D chromaticity plots. We feel it should find its place in the emerging tool kit for better managerial decision making, which currently includes decision tree analysis
2
despite advantages referred to in the literature, e.g. McGrath (1999), Luehrman (1998), about adopting real options methods for managing flexibility, many businesses fail to do this in practice, see Baker et al. (2011). Cited reasons for the failure to adopt and/or the infrequent use of real options include: implementation obstacles; organisational
complexity; lack of familiarity; and too much sophistication, see Rambaud and Sánchez Pérez (2016), Driouchi and Bennett (2012) and Block (2007).
Real option analysis (as contrasted with financial option analysis, Black and Scholes, 1973; Meyers, 1977) emerged in the literature on valuing strategic flexibility in non-marketed settings (see Bowman and Hurry, 1993; Luehrman, 1998; McGrath, 1997, 1999; Klingebiel and Adner, 2015). This focussed particularly on the value of waiting and the value of staging resource commitments. Such values are influenced
fundamentally by uncertainty. Hasty decisions can sacrifice flexibility, and raise the firm’s exposure to uncertainties in new markets, while delayed decisions allow uncertainties to resolve, potentially raising performance by building on good, or by mitigating bad, fortune. Thus entrepreneurs have the ability to adapt, as the project advances, on access to new information.
3
While contemporary applied research in the area of real options has been progressive, it has tended to limit its focus to valuing real options, based on specific investment
characteristics (Rambaud and Sánchez Pérez, 2016; Sarkar, 2009; Wang and Dryer, 2010), or to testing the performance implications of real options logic or their
usefulness (see Gong et al., 2011; Klingebiel and Adner, 2015; and Power and Reid, 2013). We hold that greater emphasis should be put on exploring investment appraisal techniques for managing a portfolio of real options. The outcomes of proceeding in this way critically depend on the ability of managers to monitor and manage the value of these options appropriately over time (Kogut and Kalatilaka, 1994; Luehrman, 1998). While more empirical applications, and new tools to support managers in such
applications, have been recommended in this area (see Reurer and Tong, 2007; Trigeorgis, 1996; Bowman and Hurry, 1993), there has been a dearth of exemplars of this approach. To mitigate this shortfall, our paper develops a decision support system (DSS) which helps owner-managers of entrepreneurial firms to monitor and manage the value of these real options, with ease and accuracy, thus raising their firms’ long-run performance. We agree with the argument of Driouchi and Bennett (2012, p.56) that ‘real option attention, knowledge and management can be more crucial for
organizations than real options opportunities.’ That is, the focus should be on implementing, rather than just identifying, real options opportunities.
4
5
decision support tool for entrepreneurs that reduces the complexity of decision making, and the fine balancing of opposing effects, to simple choices of colours on performance plots.
The key logic underpinning this approach is a temporal sequence. First, the firm identifies precipitators of change. Second, in the light of this, it decides on the point at which to act to implement change, through investment. Third, it decides to embed this change, over a specific further period of investment time. This sequence is modelled, applied econometrically, and then interpreted through our new DSS. It formalises the temporal schema:
Precipitators → (time to act) → Investment decision → (time to invest) → Embed investment
Decision support systems (DSS) are of great utility in economic and financial settings, and have been developed since desk top computing emerged, Miller (1975). The tools available are diverse, including data mining and data warehouses. Economic and financial examples include Kumar et al. (1997) who were the first to explore decision support, using classification models, for solving (simply and rapidly) liquidation-merger problems. More recent developments include the works of Serrano-Cinca and
6
suitable for rationally implementing entrepreneurial investments, using applied real options analytics. It has been shown in the empirical literature by O’Brien et al. (2003) that whether managers are versed in the formality of real options theory or not, most entrepreneurs evaluate the value of waiting, given uncertainties, and the value of staging resource commitments,given irreversibility,in an examination of entry decisions. Our DSS will further assist them in this endeavour.
Our paper presents, first, the theoretical model, its econometric implementation, and the data on which it is estimated. Second, it discusses the results of the estimation, and demonstrates how they can be understood in the form of accessible DSS analytics, which are fit for entrepreneurial use.
II. Model and Data
Model
7
Technically, we consider the sequential staging of investments in the firm, so the version of real options analysis we use is that of the bundling of options into a compound option. To illustrate, if G(v, t) is an embedded option, then a two-stage compound option can be written as C(S, t) = F[G(v, t), t] where C(.) is increasing in G(.). Fortunately, as Trigeorgis (1993) has shown, compound options generally behave like simple options. In the compound relationship F[G(.), t] we note that F[.] is increasing in G (.), that is FG > 0. In our work, performance (z) depends upon C and
two classes of real options, namely shared (SRO) and propriety (PRO) real options. That is, the theoretical model is z = Φ [SRO, PRO, C(.)] where SROs are real options that the firm and its rivals alike can undertake freely; and PROs are real options exclusive to the firm. For example, SROs might relate to technology or marketing; whilst PROs might relate to headcount, or production capacity. In applicable form the model is written:
z = ϕ(PRO, SRO, Precipitators, Precipitator Time, Embedded Options, Investment Time, ε) (1)
Here, Precipitators (x), a count measure of what factors (e.g. demand, innovation etc.), lead to a key change in the business, Precipitator Time (y) is the time between noting and acting on Precipitators (x). Embedded Options (u) is a count measure of the number of investment opportunities (e.g. plant, software etc.) identified by the entrepreneur, and Investment Time (v) is the time between identifying the necessary investment and
embedding it. Finally, ε is a random error term. The specific functional form for ϕ (.) for equation (1)is given in Table 1 (first column under Regressors and Coefficients). The functional form of z = ϕ (.) is that performance (z) is linear in parameters βi (i = 0, 1,
8 Data
The data for this paper derive from face-to-face interviews with Scottish entrepreneurs, see Power and Reid (2013). The instrumentation was an administered questionnaire, covering all key dimensions of business activity from sales and finance, to strategy, and innovation. The sampling frame was made up of the caseloads of Enterprise Trusts. The Enterprise Trusts were small, locally-based, business incubation units liberally distributed across all regions of Scotland, jointly funded by private and public
initiatives: see Reid and Jacobsen (1988, Ch 5). The Directors of these units provided random samples of entrepreneurs from their client lists, and this privileged access led to very detailed micro-micro data being obtained by interviews in the field with the
entrepreneurs. Comparative analysis shows this sampling procedure produced a realistic representation of the distribution of firms in Scotland see Reid (2007, Ch. 2, p. 23), where the proportions of micro-firms in the sample, as compared to the population of firms, were, respectively: 61.4%, 65.0 % (for sizes 1-4); 20.5%, 17.5% (for sizes 5-9); and 8.0%, 9.9% (for sizes 10-19) where here size is measured by headcount.
9
paper on decision support. The sample is a longitudinal unbalanced panel, concatenating three ‘parent’ samples over the period 1985-2002. There were 396 firms in total, of which 186 were available for estimation, made up of 63 surviving firms and 123 non-surviving firms - which enabled correction to be made for sample selection bias: see Notes (a) and (b) of Table 1 which give the binary probit estimates for survival and the inverse Mills ratio.
We measured performance (z) using an index constructed from twenty eight attributes, like cash-flow, costs, and competition, which were rated by entrepreneurs on a 100 point scale. We found this index satisfied rigorous tests for attributes like consistency (e.g. Cronbach’s α = 0.78 > 0.70 the key critical value). In addition, it acts as a useful proxy for more traditional accounting measures, see Power and Reid (2015). Our indicator is, as expected, negatively correlated with asset growth (Pearson’s R = -0.298, Prob. value<0.05) mirroring the relationship between accounting profit and asset growth (Pearson’s R = -0.747, Prob. Value<0.0001) and (again as expected) negatively correlated with the level of indebtedness of the firm (Pearson’s R = - 0.208, Prob. Value < 0.05) similarly to traditional measures. The magnitude (1.97% ≈ 2%) of the associated elasticity of profitability with respect to our measure of performance is considerable, see Power and Reid (2012), which strongly validates our modelling. Our indicator also fits well with yardstick performance measurement models (cf. Sandberg and Hofer, 1987; Chrisman et al., 1998) and is strongly supported by our confirmatory factor analysis [χ2(16) = 9.9762; prob. value = 0.868].
To capture the underlying determinants of real option value, key organisational changes exercised by the firm over its life were precisely identified by the firm.
10
significant organisational changes were compound real options in nature (e.g. changes in the line of business, changes in location etc.). For each significant change,
entrepreneurs were asked from a list of thirty diverse potential precipitators of the change (including features like demand, competition, growth, cost changes, technology) to identify the precipitating influences (xi) and to say how soon it was afterwards that
the key change or real option was exercised. The latter provided us with a measure of precipitator time (yi). Owner-managers were also asked to document the embedding of
investments in these compound real options. They identified from a list of thirty diverse consequential adjustments the embedded options that were made and the length of time it took to implement them. Specifically, embedded options were calibrated by a count of the number of consequential adjustments that were made (ui) and investment time by
how long it took (vi) to exercise the adjustments. The lists of organisational changes
exercised by the firm over its life were also classified as shared and proprietary. A count of proprietary real options (PRO) and a count of shared real options (SRO) exercised over the firm’s lifetime were also included in estimation. This process is documented in greater detail in Power and Reid (2013).
III. Results and DSS Analytics
11
1 below, we note the similarity of estimates for the broader (i) or narrower (ii) financial index. Thus, the coefficient on Precipitator is positive and highly significant (***) for both the general index (i) and the financial sub-index (ii), reinforcing our conclusion that greater uncertainty raises performance and option value. The sign on the
interaction term (Precipitator × Precipitator Time) is negative and highly significant (***), again both in (i) and (ii), strengthening the finding of diminishing returns to adopting a ‘wait and see’ approach. Thus, for both estimates, the marginal effect of seeking more precipitators of change is lesser the greater is the time to exercising the
real option.
Understanding and interpreting the full content of Table 1 is complex, which hinders applying real options in practice by entrepreneurs. We argue that representing the estimates in 3D space aids interpretation and provides a solid basis for real
entrepreneurial decisions. We develop our argument under the sub-headings of Option Recognition and Interpretative Value. We start with overall performance (i) then move to financial performance (ii).
[Insert Table 1 near here]
Option Recognition
Focussing on the option recognition stage, we explain predicted Performance (ẑ) by the following function of Precipitators (x) and Precipitator Time (y):
ẑ = F(x, y) = 56.5798 + 3.2808 x + 0.5548 y - 0.2195(x × y) (2)
where in (2) four independent variables have been ‘washed out’ of the estimated equation in Table 1 by setting the values of PRO, SRO, Embedded Options and
12
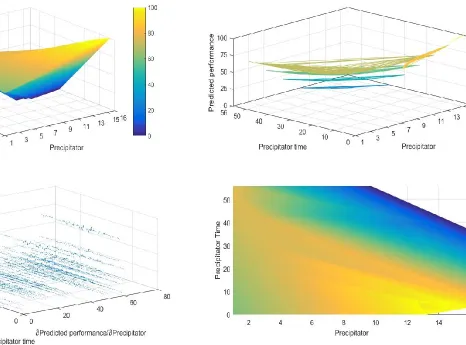
equation (2),are then used to create four different 3D chromaticity plots using MATLAB®.
Figure 1 below illustrates the use of four such plots: (a) a surface plot (upper left hand corner); (b) a contour plot (upper right hand corner); (c) a quiver plot, which represents the partial derivatives of ẑ with respect to coordinates x and y (lower left hand corner), so the blue arrows become longer, the greater the surface gradient; and (d) a 2D representation of the surface plot in (a) (lower right hand corner), essentially an orthogonal projection of ẑ onto the (x, y) space. In interpreting the plots, ‘chromaticity’ is used, for which blue denotes ‘low’ and yellow denotes ‘high’ performance.
Chromaticity shows, for example, that a greater number of precipitators are recognised in a shorter precipitator time. The contours of plot (b) Figure 1 illustrate the
diminishing returns to adopting a ‘wait and see’ strategy: notably this is so for values of precipitator times beyond twenty months (especially if a high number of precipitators have already been identified). One also observes graphically how taking longer to recognise precipitators of change reduces performance.
13
retire. He perceived that within the business resided the necessary skills base to run the firm competently, requiring only marginal alterations of the functions of existing management. For Case A, three precipitators were identified (viz. skills, management and a negotiated MBO to enable his retirement): not immediately but over a two-year period (24 months). Because of the long time-lapse from recognition of precipitators to exercise of the option, the predicted performance for Case A (at 63.90) falls below the sample average of 67.35. We conclude that had more precipitators been identified, and had the exercise of the option been advanced more rapidly, Case A would have enjoyed better performance. Case B: A plant and equipment hire company. Its entrepreneur identified 7 precipitators of the real option of a change in ownership. These were typically growth orientated, over various dimensions (e.g. growth potential, increased demand). Prerequisites to growth included more investment in Case B. The interested buyer was motivated by a desire to develop the business and, to that end, he offered better access to customers, new opportunities to increase profitability, and superior marketing of products. A ‘serial entrepreneur’, he had prior experience as a company director within three previous businesses. He planned to exercise the option to buy within a six-month period, and this relatively short time-scale set Case B’s predicted performance at a much higher level than for Case A (viz. at 73.7 for Case B, as contrasted with 63.90 for Case A). The lesson learnt is that whilst waiting can raise value, it is subject to decreasing returns. Case C: A gift retail outlet. Exercise of the real option entailed the incumbent entrepreneur investing in a new product range for Case C. He identified as many as 8 precipitators of the change (e.g. peak sales
14
relatively short period of time to exercise of twelve months. The large number of identified precipitators, and the relatively short time to exercise, combined to yield a forecasted performance level of 69.00, which is also above that for Case A, and indeed above that for the sample average for performance. Whilst profit and sales oriented, this entrepreneur of Case C did not neglect customer care, and benefitted from early
alertness to the need for investment, and rapid action in implementing the investment too. Cases A, B and C illustrate well how ‘real options in practice’ can benefit from analytical decision support in complex settings that is both realistic and consistent in its prescriptions, as well as having the beauty of being simple to use.
Quiver plot (c) in Figure 1 shows how the blue arrows get longer as the surface function gets steeper. The surface gradient in this plot is more influenced by the partial derivative (∂Predicted Performance/∂Precipitator) than by the partial derivative (∂ PredictedPerformance/∂ Precipitator Time), with the latter being generally level, for given values of Precipitator. It follows that better scanning of the environment, other things being equal, will lead to better firm performance. This is consistent with the findings of other studies which explore the link between environmental scanning and firm performance (Garg et al., 2003) and between environmental scanning and new product development and innovation success (Yoo and Sawyerr, 2014; Frishammar and Hörte, 2005).
15
illustrates well the nuance that, while adopting a ‘wait and see’ strategy to find more precipitators is important, speed in identifying these precipitators is also vital, as diminishing returns to waiting set in rapidly. Thus a simple visual representation like Figure 1, plot (d) enables entrepreneurs to consider: a) which real options to hold; b) whether they need to scan the environment more effectively for precipitators of change; and c) whether there is still value in waiting. Our diagrams allow them to conduct a visual evaluation rapidly, using information which is understandable and accessible. Cobb and Charnes (2010) similarly use graphical representations of the expected cash flow functions to communicate the option exercise strategy in valuing switching options.
[Insert Figure 1 Near here]
Interpretative Value
Figure 2 demonstrates the value of staging investments during the investment process, again using four similarly designed plots. We now use Embedded Options (u) and Investment Time (v), rather than Precipitators (x) and Precipitator Time (y) to predict overall performance (ẑ) by equation (3):
ẑ = F (u, v) = 52.9228 + 1.301u + 0.8868v - 0.0884(u × v) (3)
16
positive consequences for performance. Intuitively, lengthening the investment time acts as a restraint on the level of irreversible investment, until uncertainty is resolved.
However, quiver plot (c) Figure 2 shows here similarly that the surface gradient in this plot is more influenced by the partial derivative (∂Predicted Performance/∂Embedded Options) than by the partial derivative (∂ PredictedPerformance/∂ Investment Time). Here the latter is generally level, for given values of Investment Time. It follows that fewer investment stages in compound options, other things being equal, will lead to better firm performance. Note staging creates value by lowering downside risk. It contains the costs of the investment (see Klingebiel and Adner, 2015; Kroussis et al., 2007). Only a few studies value embedded options in compound real options. For examples see Lina and Wang (2012) for natural resource investments, Giaccotto et al., (2007) for lease contracts and Alvarez and Stenbacka (2006) for takeovers. These studies generally value all embedded options (e.g. abandonment, growth and divestment options etc.). They do not explore the performance effects of the fewer investment stages or embedded options.
[Insert Figure 2 near here]
Finally, Figure 3 presents comparable plots for predicting financial performance, rather than overall performance. Our interpretation of plots (a) to (d) (Figure 3) readily mimics that of equivalent plots in Figure 1, which suggests the robustness of our
findings. The 3D plots of Figure 3 show generally how lower values for Precipitator Time and higher values of Precipitators are required for greater financial performance. Further, simplifying to the 2D plot, of plot (d) (the heat map) in Figure 3, the
17
one) - is certainly critical to reaching the high financial performance zone (viz. the bright yellow area). Scanning the environment for precipitators of change is crucial as again here the surface gradient in quiver plot (d) is more influenced by the partial derivative (∂Predicted Financial Performance/∂Precipitator).
[Insert Figure 3 near here]
IV. Conclusion
In this paper, we have shown how real options can be represented in an appealing, intuitive way to support entrepreneurial decision-making, to the end of raising firm performance. While others such as Trigeorgis and Ioulianou (2013), and Nigro et al. (2016) have tried to make real options analysis more accessible, their approaches still require mastery of complex formulae for valuing real options, and sophisticated
interpretation of the interrelationships between risk, time and option value. By contrast, our set of 3D chromaticity plots uses known entrepreneurial decision dimensions (like precipitators, time to exercise, embedded options and investment time). This facilitates rapid, unambiguous action by the entrepreneur that will yield greater overall, and financial, performance of the firm in the long run. Bell et al. (1999) show there is a high level of support for, and interest in, visual interactive tools amongst managers, particularly when they are making capital investment decisions. We provide such a tool, which, despite the sophistication of the underlying modelling, has the merit of simplicity in use, yet accuracy in implementation.
18
from off-the-peg, bespoke and in-house provision, to individual user development. Sauter (2012) has subsequently codified the model and data requirements for
developing such DSS, through easy-to-use menu or command systems. Contemporary work, building on these foundations (and foreshadowing the future) by the likes of the team of Rose et al (2016), who look at UK farming businesses, shows the great potential for applying new DSS tools in the future. Such tools are typically software based, and are used to suggest the optimal paths to high performance for its users. As in our paper, these newly developed tools depend heavily on the visual presentation of decision-making information. They must satisfy the key criterion of being ‘quick and easy’, as well as satisfying subsidiary criteria like high performance, ease of use, trustworthiness, and relevance.
References
Alvarez, L. H. & Stenbacka, R. (2006). Takeover timing, implementation uncertainty and embedded divestment options. Review of Finance, 10, 417–441. doi: 10.1007/s10679-006-9002-y.
Baker, H., Dutta, S. & Saadi, S. (2011). Management views on real options in capital budgeting. Journal of Applied Finance, 2, 18–29.
Bell, P. C., Anderson, C. K., Staples, D. S. & Elder, M. (1999). Decision-makers' perceptions of the value and impact of visual interactive. Omega, International Journal of Management Science, 27, 155-165. doi: 10.1016/S0305-0483(98)00035-8.
Black, F. & Scholes, M. (1973). The pricing of options and corporate liabilities. The Journal of Political Economy, 81, 637-654. doi: 10.1086/260062.
Block, S. (2007). Are “real options” actually used in the real world? The Engineering Economist, 52, 255–267. doi: 10.1080/00137910701503910.
Bloom, N. & van Reenen, J. (2002). Patents, real options and firm performance. The Economic Journal, 112, C97-C116. doi: 10.1111/1468-0297.00022.
19
Chrisman, J. J., Bauerschmidt, A., & Hofer, C. W. (1998). The determinants of new venture performance: An extended model, Entrepreneurship, Theory and Practice, Fall, 5-29.
Cobb, B. & Charnes, J. J. (2010). A graphical method for valuing switching options. Journal of Operational Research Society, 61, 1596-1606. doi: 10.1057/jors.2009.128. Denison, C. A. (2009). Real options and escalation of commitment: A behavioral analysis of capital investment decisions. The Accounting Review, 84, 133–55. doi: 10.2308/accr.2009.84.1.133.
Denison, C. A., Farrell, A. M. & Jackson, K. E. (2012). Managers’ incorporation of the value of real options into their long-term investment decisions: An experimental investigation. Contemporary Accounting Research, 29, 590–620. doi: 10.1111/j.1911-3846.2011.01116.x.
Driouchi, T. & Bennett, D. J. (2012). Real options in management and organizational strategy: A review of decision-making and performance implications. International Journal of Management Reviews, 14, 39–62. doi: 10.1111/j.1468-2370.2011.00304.x. Duan, Y. & Xu, M. (2009). Decision support systems in small businesses. Encyclopaedia of Science and Technology. Hershey, PA, USA: ICI Global. Ch 155, 974-975.
Frishammar, J. & Hörte, S. A. (2005). Managing external information in manufacturing firms: The impact on innovation performance. Journal of Product Innovation Management, 22, 251–266. doi: 10.1111/j.0737-6782.2005.00121.x.
Garg, V. K., Walters, B. A. & Priem, R. L. (2003). Chief executive scanning emphases environmental dynamism, and manufacturing firm performance. Strategic Management Journal, 24, 725-744. doi: 10.1002/smj.335.
Giaccotto, C., Goldberg, G. M. & Hegde, S. P. (2007). The value of embedded real options: Evidence from consumer automobile lease contracts. The Journal of Finance, LXII, 411-445. doi: 10.1016/j.frl.2008.08.003.
Gong, J. J., Van Der Stede, W. A. & Young, S. M. (2011). Real options in the motion picture industry: Evidence from film marketing and sequels. Contemporary Accounting Research, 28, 1438–1466. doi: 10.1111/j.1911-3846.2011.01086.x.
Klingebiel, R. & Adner, R. (2015). Real options logic revisited: The performance effects of alternative resource allocation regimes. Academy of Management Journal, 58, 221-241. doi: 10.5465/amj.2012.0703.
20
Kroussis, N., Martzoukos, S. H. & Trigeorgis, L. (2007). Real R&D options with time to learn and learning by doing. Annals of Operations Research, 151, 29-55. doi:
10.1007/s10479-006-0127-3.
Kumar, N., Krovi, K., & Rajagopalan, B. (1997). Financial decision support with hybrid genetic and neural based modelling tools. European Journal of Operational Research, 103, 339-349. doi: 10.1016/s0377-2217(97)00124-0.
Lina, C-G. & Wang, Y-S. (2012). Evaluating natural resource projects with embedded options and limited reserves. Applied Economics, 44, 1471–1482. doi: 10.1080/00036846.2010.543076.
Luehrman, T. A. (1998). Strategy as a portfolio of real options. Harvard Business Review, 76(5), 89-99.
Makropoulou, V. (2011). Decision tree analysis and real options: A reconciliation. Managerial and Decision Economics, 32, 261–264. doi: 10.1002/mde.1532.
McGrath, R. G. (1997). A real options logic for initiating technology positioning investments. Academy of Management Review, 22, 974-996. doi: 10.2307/259251. McGrath, R. G. (1999). Falling forward: Real options reasoning and entrepreneurial failure. Academy of Management Review, 24, 13-30. doi:
10.5465/AMR.1999.1580438.
Miller, I. M. (1975). Graphics in business decision support. Computer and Graphics, 1, 293-296. doi: 10.1016/0097-8493(75)90021-7.
Myers S. C. (1977). Determinants of corporate borrowing. Journal of Financial Economics, 5, 147-176. doi: 10.1016/0304-405X(77)90015-0.
Nigro G. L., Morreale, A. & Abbate, L. (2016). An open innovation decision support system to select a biopharmaceutical R&D portfolio. Managerial and Decision Economics, 37, 392-406. doi: 10.1002/mde.2727.
O'Brien, J. P., Folta, T. P. & Douglas, R. J. (2003). A real options perspective on entrepreneurial entry in the face of uncertainty. Managerial and Decision Economics 24, 515-533. doi: 10.1002/mde.1115.
Power, B. & Reid, G. C. (2015). Performance and strategy: Simultaneous equations analysis of long-lived firms. International Journal of the Economics of Business, 22, 345-377. doi: 10.1080/13571516.2015.1051751.
Power, B. & Reid, G. C. (2013). Organisational change and performance in long-lived small firms: A real options approach. European Journal of Finance, 19, 791-809. doi: 10.1080/1351847X.2012.670124.
21
Advances in Decision Sciences, 2016, Article ID 7605909, 12 pages. doi: 10.1155/2016/7605909.
Reid, G. C. (2007). The foundations of small business enterprise: An entrepreneurial analysis of small firm inception and growth. Oxford: Routledge.
Reid, G. C. & Jacobsen, L. R. (1988). The small entrepreneurial firm. Aberdeen: Aberdeen University Press.
Reuer, J. J. & Tong, T. W. (2007). Corporate investments and growth options. Managerial and Decision Economics, 30, 863–877. doi: 10.1002/mde.1335.
Robertson, P. K. (1988). Visualizing color gamuts: A user interface for the effective use of perceptual color spaces in data displays, IEEE Computer Graphics and
Applications, 8, 50-64. doi: 10.1109/38.7761.
Rose, D. C., Sutherland, W. J., Parker, C., Lobley, M., Winter, M., Morris, C., Twining, S., Ffoulkes, C., Amano, T. & Dicks, L. V. (2016). Decision support tools for agriculture: Towards effective design and delivery, Agricultural Systems, 149, 165-174. doi: 10.1016/j.agsy.2016.09.009.
Sandberg, W. R. & Hofer, C. W. (1987). Improving new venture performance: The role of strategy, industry, structure and the entrepreneur. Journal of Business
Venturing, 2, 5-28. doi: 10.1016/0883-9026(87)90016-4.
Samaras, G. D., Nikolaos, F., Matsatsinis, N. F. & Zopounidis, C. (2008). A multicriteria DSS for stock evaluation using fundamental analysis. European Journal of Operational Research, 187, 1380-1401. doi: 10.1007/BF02936406.
Sarkar, S. (2009). A real-option rationale for investing in excess capacity. Managerial and Decision Economics, 30, 119–133. doi: 10.1002/mde.1446.
Sauter, V. L. (2012). Decision support systems for business (2nd ed.). Hoboken, NJ, USA: Wiley.
Serrano-Cinca, C. & Gutierrez-Nieto, B. (2013). A decision support system for financial and social investment. Applied Economics, 45, 4060-4070. doi: 10.1080/00036846.2012.748180.
Smit, H. T. J., & Trigeorgis, L. (2006). Strategic Planning: Valuing and Managing Portfolio of Real Options. R&D Management, 36, 403-419. doi: 10.1111/j.1467-9310.2006.00440.x.
Trigeorgis, L. (1996). Real options: Managerial flexibility and strategy in resource allocation. Cambridge, MA: MIT Press.
22
Trigeorgis, L. & Ioulianou, S. (2013). Valuing a high-tech growth company: The case of Echostar Communications Corporation. European Journal of Finance, 19, 734–759. doi: 10.1080/1351847X.2011.640343.
Tziralis, G., Kirytopoulos, K., Rentizelas, A. & Tatsiopoulos, I. (2009). Holistic investment assessment: Optimization, risk appraisal and decision making. Managerial and Decision Economics, 30, 393–403. doi: 10.1002/mde.1458.
Wang, T. & Dyer, J. S. (2010). Valuing multifactor real options using an implied binomial tree, Decision Analysis, 7, 185-195. doi: 10.1287/deca.1100.0174.
Wu, L-C & Wu, L-H. (2013). Tracking a benchmark index using a spreadsheet-based decision support system as the driver. Expert Systems, 30, 79-88. doi: 10.1111/j.1468-0394.2012.00624.x.
Yoo, S-J. & Sawyerr, O. (2014). The search for broad environmental information and new product development success in technology-based SMEs. Journal of Enterprising Culture, 22, 27-55. doi: 10.1142/S0218495814500022.
23
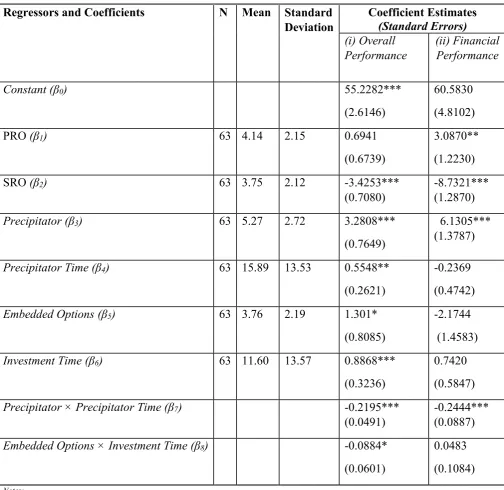
Table 1. Heckman Sample Selection Estimation (N=186)
Notes:
(a) Binary Probit Selection Equation Model I (N=186) where the probability of survival (y=1):
yˆ= -0.33+0.039 Sector -0.0036FTemployees – 0.14 PTemployees – 0.0032StYear+4.94E(-07)**StSales
(0.91) (0.20) (0.012) (0.017) (0.011) (2.50 e(-07))
(b) Inverse Mills Ratio
(i) (ii)
1170k (1197k) 3319k (2367k)
0.156 0.241
7523k 13800k
Wald 2 8.21k 2.061k
Prob. Value 0.000 0.000
(c) Standard errors are in brackets.
(d) One tailed significance: *** 1%; ** 5%; *10%.
(e) Estimates in Column (i) only are reproduced from Power and Reid (2013), Table 3, Model II.
Regressors and Coefficients N Mean Standard Deviation Coefficient Estimates (Standard Errors) (i) Overall Performance (ii) Financial Performance
Constant (β0) 55.2282***
(2.6146)
60.5830 (4.8102)
PRO (β1) 63 4.14 2.15 0.6941
(0.6739)
3.0870** (1.2230)
SRO (β2) 63 3.75 2.12 -3.4253***
(0.7080)
-8.7321*** (1.2870)
Precipitator (β3) 63 5.27 2.72 3.2808***
(0.7649)
6.1305*** (1.3787)
Precipitator Time (β4) 63 15.89 13.53 0.5548**
(0.2621)
-0.2369 (0.4742)
Embedded Options (β5) 63 3.76 2.19 1.301*
(0.8085)
-2.1744 (1.4583)
Investment Time (β6) 63 11.60 13.57 0.8868***
(0.3236)
0.7420 (0.5847)
Precipitator × Precipitator Time (β7) -0.2195***
(0.0491)
-0.2444*** (0.0887)
Embedded Options × Investment Time (β8) -0.0884*
(0.0601)
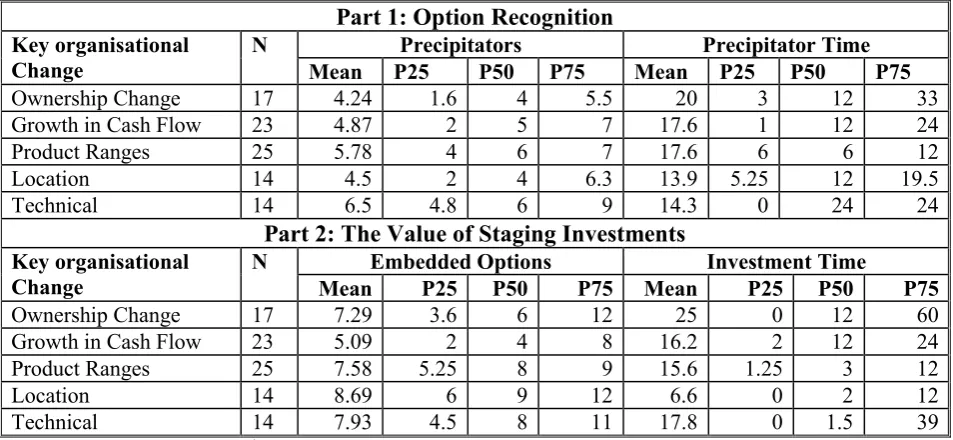
24 Table 2. Selected Key Organisational Changes
Part 1: Option Recognition Key organisational
Change
N Precipitators Precipitator Time
Mean P25 P50 P75 Mean P25 P50 P75
Ownership Change 17 4.24 1.6 4 5.5 20 3 12 33
Growth in Cash Flow 23 4.87 2 5 7 17.6 1 12 24
Product Ranges 25 5.78 4 6 7 17.6 6 6 12
Location 14 4.5 2 4 6.3 13.9 5.25 12 19.5
Technical 14 6.5 4.8 6 9 14.3 0 24 24
Part 2: The Value of Staging Investments Key organisational
Change
N Embedded Options Investment Time
Mean P25 P50 P75 Mean P25 P50 P75
Ownership Change 17 7.29 3.6 6 12 25 0 12 60
Growth in Cash Flow 23 5.09 2 4 8 16.2 2 12 24
Product Ranges 25 7.58 5.25 8 9 15.6 1.25 3 12
Location 14 8.69 6 9 12 6.6 0 2 12
Technical 14 7.93 4.5 8 11 17.8 0 1.5 39
25
26
27