An insight into the yielding and normal compression of sand with irregularly-shaped particles using DEM
J. P. de Bono*; G. R. McDowell
University of Nottingham, UK
*Contact: John de Bono: [email protected]
Abstract
The micro mechanics of one-dimensional and isotropic normal compression of granular soil have recently been revealed using the discrete element method. By modelling soil grains as spheres and implementing a new crushing model, the authors have previously investigated the influence of fracture mechanism, particle strengths (and distributions), and the size-hardening law on both the normal compression line and resultant particle size distribution; this resulted in a new compression law. In this work, irregular particle shape is introduced, using ‘clumps’ (groups of spherical
particles), allowing different relative densities of the same material to be subjected to normal compression. An investigation into the mechanics of yielding is presented, in which the onset of crushing is related to the average particle octahedral shear stress and ‘yield’ is seen to be a function of the available void space. Beyond yield, the normal compression lines for the clumps at different initial densities are examined and compared to that for spheres. The effect of coordination number and particle shape on the normal compression are studied, and in particular the micro mechanics behind the evolution of a fractal particle size distribution are revealed.
1. Introduction
It has recently been demonstrated by the authors that it is possible to accurately model the one-dimensional compression of sand using the discrete element method [1]. It was shown that the normal compression line (NCL) for a sand should be linear when plotted on double-logarithmic axes (confirming earlier propositions, e.g. [2,3]), and that the compression index—i.e. the slope of the compression line in log e-log σ space—is solely a function of the size-hardening law for the particles. This proposition was further demonstrated by a subsequent work focused on isotropic normal compression [4], in which isotropic boundary conditions were shown to give rise to anisotropic local shear stresses within a granular soil sample. For one-dimensional normal compression, the
McDowell and de Bono [1] compression law is given by the equation:
log 𝑒 = log 𝑒y− 1 2𝑏log
𝜎
𝜎y (1)
where e is the current voids ratio, σ is the applied stress, ey is the value on the linear log-log plot at a
stress corresponding to the yield stress σy, and b controls the size effect on average particle strength
σav:
where d is the particle diameter. This new compression law correctly predicts the slope of the NCL for a range of discrete element method (DEM) simulations using spheres and demonstrates agreement with experimental results for granular soil. One of the key features of this recent work was the development of an original crushing model, which allowed particle breakage to be implemented to DEM simulations.
The work presented here utilises the same crushing model, but introduces irregular particle shape. By using non-spherical particles while keeping variables such as the particle strengths and the hardening-law the same, the effects that particle shape has on yielding are investigated; as is the influence of initial density and average coordination number, which can now be varied due to the ability of non-spherical particles to interlock, and maintain higher voids ratios.
2. DEM Model 2.1 Particle Breakage
The software used in this work is PFC3D [5], a commercial DEM code. This software uses two physical entities—balls and walls—and uses Newton’s 2nd Law combined with a force-displacement law at the contacts to establish accelerations, velocities and displacements of particles using a time-stepping scheme. Key assumptions of the code include treating the particles as rigid bodies, and using a soft-contact approach, whereby the particles are allowed to overlap one another. The magnitude of contact overlap is related to the contact force by the stiffness model; a Hertzian contact model being used in the simulations presented here. A detailed description of the underlying theory can be found in the software manual [5].
The essential features of the crushing model will now be briefly summarised; however readers are directed to the authors’ prior publications for full documentation [1,4]. To determine whether fracture of a particle should occur or not, the average octahedral shear stress within each particle is used:
𝑞 =1
3[(𝜎1− 𝜎2)2+ (𝜎2− 𝜎3)2+ (𝜎1− 𝜎3)2]1 2⁄ (3)
which is calculated from the average principal stresses (σ1, σ2, σ3) for each particle. The average
principal stresses are retrieved by software, and are calculated according to:
𝝈
̅𝑖𝑗(𝑝)= 1
𝑉(𝑝)∑ (𝑥𝑖 (𝑐)− 𝑥
𝑖 (𝑝))
𝑁c(𝑝)
𝐹𝑗(𝑐,𝑝) (4)
where V(p) is the volume of the particle (p), Nc(p) is the number of contacts on the particle, xi(c) and xi(p) are the locations of the contact and particle respectively, and Fj(c,p) is the force acting on the particle at contact (c).
McDowell [6] measured the tensile strength of sand grains by diametral compression between flat platens as σ = F / d2 [7] and showed that the stresses at failure for a given particle size satisfied a Weibull distribution of strengths. These distributions were described by a characteristic value of strength, σ0 and a Weibull modulus, m. In PFC3D, the value of octahedral shear stress, q induced in a
spherical particle compressed diametrically between two walls is proportional to F / d2 [4]; hence, it is assumed that for a particle under multiple contacts, the particle will break if the octahedral shear stress, calculated using Equation (3), is greater than or equal to its strength, where the strengths of the particles satisfy a Weibull distribution of q values. Assuming the Weibull size effect is applicable to soil particles [e.g. 8], then the size-hardening parameter b in Equation (2) is equal to (3 / m). Rewriting this equation in terms of octahedral shear strength the particle strengths can be related to size by:
𝑞0∝ 𝑑− 3𝑚 (5)
where q0 is the characteristic particle strength, and is a value of the distribution such that 37%
(exp[-1]) of random strengths are greater (and for a given m is proportional to the mean); and m is the modulus (which is related to the coefficient of variation).
In their previous work on normal compression [1,4,9], the authors allowed each (spherical) particle to split into two new fragments, the new sphere fragments overlapping enough to be contained with the bounding parent sphere, while obeying conservation of mass. The axis joining the new spheres was aligned in the direction of minor principal stress. The simulation procedure started by applying a small, macroscopic vertical stress increment. Then, all particles were checked and allowed to break if their strength was exceeded; this step was followed by a number of computational timesteps to allow overlapping fragments to move apart. These two steps were repeated if necessary until no further breakages occurred, after which the stress was reapplied (if necessary). An example of the results for such simulation using spheres, which will form the basis of comparison for the following simulations is given in Figure 1. This graph presents the one-dimensional compression behaviour for a simulation of silica sand, with d0 = 2 mm, q0 = 37.5 MPa and m = 3.3. The normal compression line
2.2 Particle Shape
In this work the results of three simulations, similar to that shown in Figure 1 but with irregularly-shaped particles, and subjected to compression from varying initial density, are presented. With the exception of the particle geometry and varying initial voids ratio, the oedometer dimensions (7 mm x 30 mm) and simulation procedure (summarised below)are identical to that in the authors’ previous work [1,4,9].
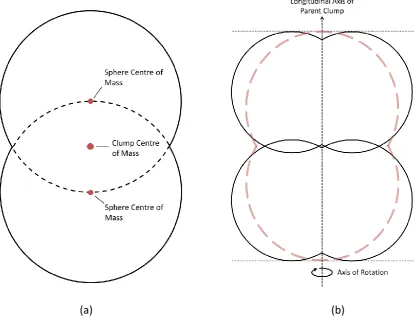
To capture more realistic particle shape, the ‘clump’ feature of the software is used; clumps consist of rigid bodies of overlapping spheres, in which internal contacts are ignored. In the case shown in Figure 2(a), two-ball clumps are used which comprise two equally-sized spheres with the centre of mass of mass of each constituent sphere located on the surface of its partner-sphere. The initial samples are generated using the radius-expansion method, i.e. the clumps are created at a greatly reduced size, then gradually expanded.
[image:4.595.159.434.68.301.2]As previously for the spheres, when a clump breaks it is replaced by two smaller, identically-shaped fragments. The new fragments are placed perpendicularly, with the vector connecting their centres of mass aligned with longitudinal axis of the parent clump, as shown in Figure 2(b). Due to the clump geometry, the fragments are not created within the volume of the parent clump, however their placement is bounded by the longitudinal extent of the original clump—indicated by thin dotted lines in the figure. The new fragments are given a random orientation by applying a rotation about the axis of the parent clump, also labelled in the figure.
For the sake of comparison with the spheres, the initial clumps in all the three simulations are given a characteristic value of strength, q0 of 37.5 MPa, and a Weibull modulus, m of 3.3, equal to that of
the spheres case, and obtained from experimental data [1]. For the previous simulations with spheres, it was not possible to obtain a significant range of initial densities under stress, due to the inability of the particles to interlock, which is the motivation for investigating various initial densities with clumps. To achieve these differing initial densities, different target voids ratios are specified during sample generation (e.g. specifying a higher e0,for a given sample volume and particle size
results in fewer clumps being generated).
After application of the first load increment (125 kPa), the three clump simulations have voids ratios of 0.74, 0.80 and 0.84, and are termed ‘dense’, ‘medium’ and ‘loose’ herein respectively. These each consist correspondingly of 640, 575 and 535 particles. Although these numbers are small, and will initially result in relatively significant boundary effects, simulations with larger samples and/or more initial particles were not computationally feasible. Previous exploratory simulations (with spheres), with larger samples appeared to result in the same compression behaviour as smaller samples, but were unable to reach high pressures due to the large number of particles covering a very wide range of scales, thus rendering the timestep too small. Even so, the simulations shown here were
terminated once the timestep became unsustainable; for the clumps this was generally when dmax / dmin ≥ 20 (i.e., when the smallest particle in existence was <0.1 mm in diameter). This ratio is
significantly less than that achieved for the sphere simulation (dmax / dmin ≥ 150 at the point of
termination), due to the clumps by their nature being more computationally demanding.
[image:5.595.85.505.80.397.2](a)
(b)
Also, for the sake of comparison, the initial clumps are equal in volume to the initial spheres—i.e. each individual clump has a volume equal to a sphere with a diameter of 2 mm. This means that the clump and the sphere samples (before crushing) consist of particles with the same nominal
diameter, d0. It is this nominal diameter that is used with Equation (5) when attributing strengths to
new clump fragments, ensuring they follow the same hardening law as for the spheres. The
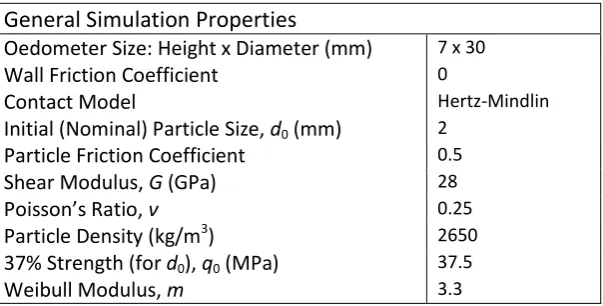
boundary conditions and initial properties that apply to all the simulations discussed in this work are reported in Table 1 below.
3. Normal Compression of Clumps 3.1 Macroscopic yield
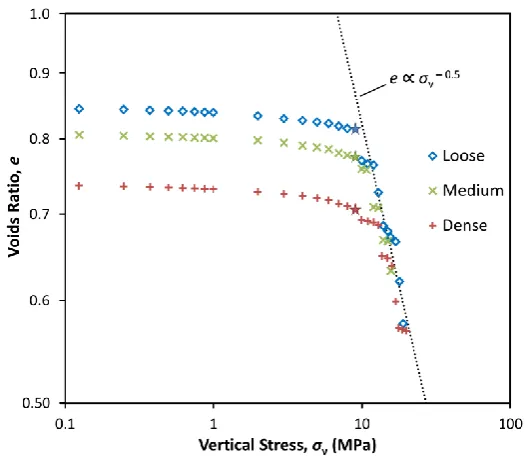
The compression results of the loose, medium and dense clump simulations are presented in Figure 3. The three simulations appear to converge to a unique normal compression line, consistent with experimental studies [2,e.g. 10]. This is also in agreement with the authors’ compression law (Eq. 1), which states that the slope of the NCL is solely a function of the particles’ size-hardening law, and predicts a slope of 0.5; the law is shown in Figure 3 by the dotted line. The hardening law for the clumps (and therefore slope of the NCL) is the same as that for the spheres; thus the dotted lines in Figures 1 and 3 are identical.
[image:6.595.149.451.241.394.2]Yielding in normal compression is usually considered to be the point at which the compressive behaviour transitions from elastic to plastic; and is usually assumed to represent the onset of particle crushing [e.g. 11–14]. As such, the macroscopic yield stress is often related to the particle strengths. According to the experimental literature [e.g. 10,13], for a given material, the earlier yielding of looser samples is attributed to the logic that such samples have lower coordination numbers (i.e. on average, the particles have fewer contacts). This implies that the particles are subjected to higher induced stresses, which causes major particle breakage (i.e. yielding) to begin at lower applied stresses. From visual inspection of Figure 3, by taking either the point where the first ‘change in direction’ occurs, the point of maximum curvature, or by using Casagrande’s method [e.g. 15]; it is clear that the higher the initial voids ratio, the lower the apparent yield stress.
Table 1. General DEM properties that apply to all simulations.
General Simulation Properties
Oedometer Size: Height x Diameter (mm) 7 x 30
Wall Friction Coefficient 0
Contact Model Hertz-Mindlin
Initial (Nominal) Particle Size, d0 (mm) 2
Particle Friction Coefficient 0.5
Shear Modulus, G (GPa) 28
Poisson’s Ratio, ν 0.25
Particle Density (kg/m3) 2650
37% Strength (for d0), q0 (MPa) 37.5
Furthermore, from Figure 3 it is apparent that for the loosest sample (e0 = 0.84), the first deviation
from the stiff, elastic initial part of the compression curve occurs at 9 MPa. For the medium sample (e0 = 0.80), a similar but smaller deviation occurs at 9 MPa, and the first major decrease in voids ratio
occurs at 11 MPa. Similar behaviour can be observed for the dense sample (e0 = 0.74), for which
there is a small decrease in voids ratio at 9 MPa, and the first major decrease occurs at 13 MPa. At stresses higher than this, the three NCLs approximately converge and follow the same path.
As yielding is unequivocally linked to particle crushing, the actual breakage occurring in the different samples will now be quantitatively analysed. Considering first of all the loose sample—as stated above, the first deviation from the initial elastic curve occurs at 9 MPa, which is indicated in Figure 3 by a star symbol. At this stress, 19 particles have already broken, constituting 2.43% of the mass of the sample that has fractured; and the average octahedral shear stress for all particles, qave, is
7.94 MPa. During the next increment (9–10MPa), there are a further 72 breakages, representing 8.18% of the mass that fractures; and the voids ratio decreases by 0.044. If this point (σv = 9 MPa) is
taken as the yield point, and assuming that the earlier yielding of this loose sample is due to fewer inter-particle contacts and (therefore) higher particle stresses, two suppositions follow: (1) the average particle stress, qave for the two denser samples will be lower at this applied stress; and (2)
the average particle stress, qave at yield for all three samples will be (approximately) the same, due to
the initial samples having identical mean strengths.
[image:7.595.164.429.175.404.2]However, analysis of the two other simulations reveals that at this macroscopic stress of 9 MPa, the medium and dense samples have average particle stresses of 7.16 and 7.92 MPa respectively, similar to the loose sample and showing no correlation with voids ratio (these points are also indicated in Figure 3). A further interesting observation is that during the corresponding load increment 9– 10 MPa, 5.2% (by mass) of the medium sample, and 16.7% of the dense sample fractures—in
comparison to 8.18% (see above) in the loose sample. However, it is the loose sample that undergoes the largest reduction in voids ratio (by a large margin), which gives the appearance of yield in Figure 3 (a reduction of 0.044, compared to 0.017 and 0.013 for the medium and dense samples respectively). These observations suggest that the apparent earlier yielding of loose samples is not solely related to the higher particle stresses, but also that due to the larger voids, a small (or given) amount of particle breakage facilitates a much larger amount of subsequent rearrangement and packing of fragments into the voids—leading to a greater decrease in volume, which is not necessarily the case for the denser samples. Equally, for denser materials, the initial voids are inherently smaller, so a greater degree of crushing must be required to produce fragments small enough to fit into the voids, requiring higher stresses.
3.2 Measuring particle breakage, stress and coordination number
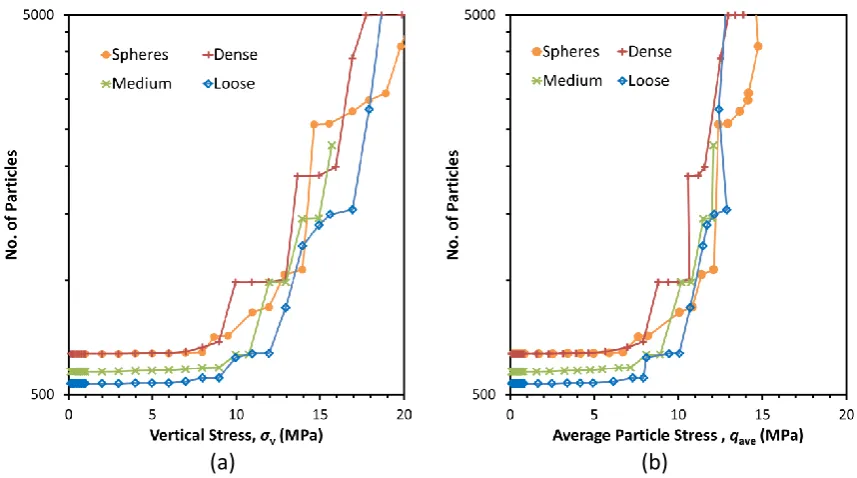
The total number of particles in each simulation is given as a function of applied stress in Figure 4(a). An interesting observation that can be made is that the first observable breakage in all simulations (including the spheres) occurs after an applied stress of 7 MPa, marked by the slight increase in the number of particles. This suggests that the macroscopic stress at which crushing begins appears independent of initial density. After a macroscopic stress of 9 MPa is reached, the number of particles increases rapidly in all simulations, at an apparently similar rate (although there are
fluctuations, due to the relatively small number of particles). Similarly, Figure 4(b) shows the number of particles, this time as a function of the average particle stress, qave. This figure shows how the
number of particles increase as the average particle stress increases, indicating that a value of 7– 8 MPa appears to be the critical value at which substantial particle crushing begins; thenceforth the number of particles increases rapidly in all simulations. This particular plot agrees with the notion that yield—or more explicitly the onset of crushing—is triggered by the same particle stresses in all simulations (regardless of the actual macroscopic yield stress), due to the particles having the same strengths.
[image:8.595.78.507.486.725.2](a)
(b)
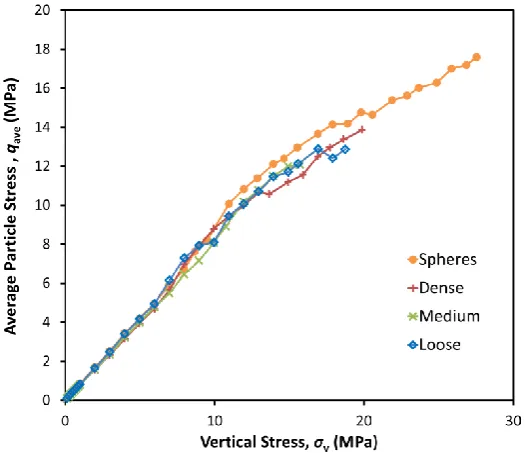
Figure 5 shows how the average particle stress, qave, increases with increasing vertical stress, and
that qave for all simulations is almost identical up to the commencement of particle crushing,
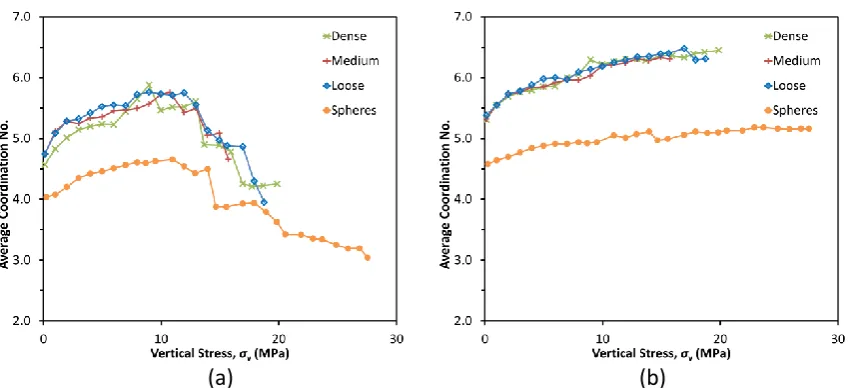
implying that the average particle stress is independent from the initial density, in agreement with the inference made from Figure 4(a). Although the similarity in Figure 5 for the three clump simulations may not seem greatly surprising, what is quite remarkable is that the average particle stress for the sphere simulation also coincides with that for the clumps, especially when considering Figure 6(a)—which shows the average coordination number (for all particles) for the four
simulations plotted as a function of vertical stress. This graph shows that the sphere simulation has a noticeably lower coordination number, yet the average particle stress appears identical to the clump simulations (which have higher average coordination numbers). Part (b) displays the average
coordination number excluding particles with no physical contacts, sometimes referred to as the ‘mechanical’ coordination number, and again the sphere simulation reveals the lowest value through the test. Particles with no contacts result from the simulations having no gravity—if gravity was invoked then one would expect ‘floating’ particles to assume 2–3 contacts, and transmit no forces other than its weight. For all simulations, the average coordination number (which takes into
account all particles) decreases substantially once significant crushing occurs and the overall number of particles grows exponentially. The mechanical coordination number (ignoring floating particles) on the other hand increases continuously with increasing stress, with the rate of increase decreasing at high stresses.
3.3 Fractal Crushing
The observations from Figure 4 that particle crushing begins at the same stage (i.e. the same σv and
qave) for all four simulations, and the fact that the normal compression lines converge suggest that at
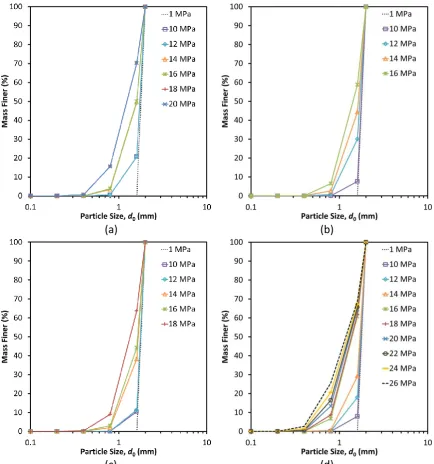
a given voids ratio, the materials should have equivalent particle size distributions (albeit with different quantities of particles, due to the initial difference). Figure 7 shows the progressive particle size distributions (PSDs) for all simulations, whereby it is apparent that at any given stress, the PSDs for all four simulations are approximately the same. The graphs also show how the range of particles sizes increase with increasing stress. Although the particle size distributions for the clump
simulations have not developed to an extent to reliably confirm a fractal character, the shapes of the evolving grading curves do indicate the emergence of fractal distributions. Furthermore, previous simulations with spheres (including the one presented in this work) have been shown to produce fractal distributions [1,4].
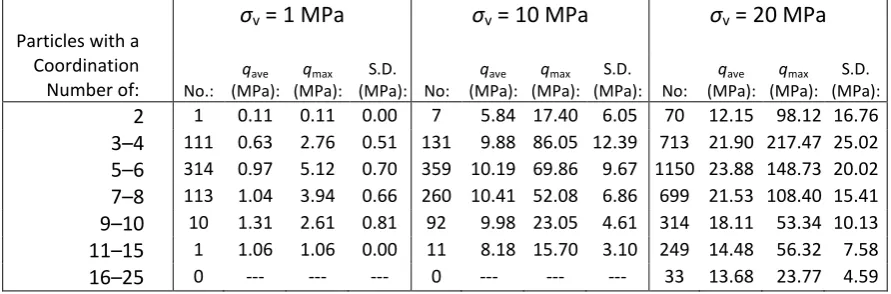
The assumption of emergent fractal particle size distributions during normal compression is the basis of the compression law given in Equation (1). Hence, the observations from Figures 4–6 that the coordination number is not significant seems incongruent, considering it is widely accepted that the coordination number is the dominating influence that controls the likelihood of whether a particle will break or not, and is key to understanding why fractal distributions emerge [e.g. 12]. Table 2 shows a breakdown according to coordination number for the dense clump simulation at three stages during compression. For each stage (σv = 1, 10, 20 MPa), the particles are categorised
depending on their coordination number, and for each category four measures are reported: the number of particles, the average particle octahedral shear stress (qave), the maximum particle stress
(qmax), and the standard deviation (S.D.).
[image:10.595.79.506.68.262.2](a)
(b)
Considering firstly just the average particles stresses, at an applied vertical stress of 1 MPa, the most common number of contacts for any particle is 5 or 6, and almost all clumps have between 3 and 8 contacts with neighbouring particles. The average octahedral shear stress for the particles, qave, is
slightly larger for those with 9–10 contacts (although there are only 10 such particles); and is the smallest for the one particle with just 2 contacts. However, there is not much variation in average stress between coordination numbers of 3–10 (just a single clump has 11 contacts); moreover the overall difference in average stress for all particles with any coordination number is approximately just 1 MPa, which is insignificant relative to the particle strengths.
(a)
(b)
[image:11.595.78.513.71.536.2](c)
(d)
At a stress of 10 MPa (approximately the stage at which major crushing commences), similarly there is no major variation in qave for particles with between 3–10 contacts; particles outside of this range
(with 2 or 11–12 contacts) exhibit lower average stress. However, the corresponding data at an applied stress of 20 MPa is far more revealing; with a much more measurable variation in qave across
the particles. For this case, particles with between 3–8 contacts suffer from the highest average stress of approximately 22 MPa, thereafter qave decreases noticeably with increasing coordination
number, showing clearly that particles with very high coordination numbers (which are necessarily large particles) have lower induced stresses.
The maximum particle stress (qmax) and standard deviation (S.D.)—also given in Table 2 for each
category of particle—will now be considered. At vertical stresses of 10 and 20 MPa, in both cases the particle experiencing the single largest shear stress has 3–4 contacts. Thereafter, the maximum value of particle stress, qmax decreases with increasing coordination number. Likewise, the particles
with the largest standard deviation in shear stress are those with 3–4 contacts, which decreases with increasing coordination number.
Comparing these values (qmax and S.D.) with the average particle shear stress qave offers a useful
insight to the variation of internal particle stresses. For example, at σv = 20 MPa, although clumps
[image:12.595.75.521.569.716.2]with either 3–4, 5–6 or 7–8 contacts are all subjected to a similar average stress of ≈ 22 MPa; the maximum stress experienced by a particle with 3–4 contacts is ≈ 217 MPa, significantly higher than that experienced by particles with 5–6 or 7–8 contacts (≈ 149 and 108 MPa respectively). Similarly, the standard deviation reduces from around 25 MPa for those particles with 3–4 contacts, to 20 and 15 MPa respectively for the particles with 5–6 and 7–8 contacts. So, even though all clumps with a coordination number between 3–8 experience similar average stresses, those with fewer contacts have a much more irregular distribution of octahedral shear stress; as such, some of these particles are subjected to exceptionally high stresses. Although not displayed here, the same trends in particle stresses can be observed at all levels of vertical stress (following the onset of crushing), as well as for the other three simulations, including the spheres.
Table 2. Breakdown of the average particle stress for the dense clump simulation; categorised according to the coordination number (not including stress-free particles/those with 0 contacts).
Particles with a Coordination Number of:
σ
v= 1 MPa
σ
v= 10 MPa
σ
v= 20 MPa
No.: qave (MPa): qmax (MPa): S.D. (MPa): No:
qave
(MPa):
qmax
(MPa): S.D. (MPa): No:
qave (MPa): qmax (MPa): S.D. (MPa):
2 1 0.11 0.11 0.00 7 5.84 17.40 6.05 70 12.15 98.12 16.76
3–4 111 0.63 2.76 0.51 131 9.88 86.05 12.39 713 21.90 217.47 25.02
5–6 314 0.97 5.12 0.70 359 10.19 69.86 9.67 1150 23.88 148.73 20.02
7–8 113 1.04 3.94 0.66 260 10.41 52.08 6.86 699 21.53 108.40 15.41
9–10 10 1.31 2.61 0.81 92 9.98 23.05 4.61 314 18.11 53.34 10.13
11–15 1 1.06 1.06 0.00 11 8.18 15.70 3.10 249 14.48 56.32 7.58
The data presented in Table 2 shows that the coordination number significantly reduces the average induced particle stress—and therefore the probability of fracture—if it is very high, in this case typically greater than 10. An increasing coordination number also clearly reduces the variability in particle stress. In these simulations, due to the initial mono-dispersity, such a disparity in
coordination numbers is only possible once crushing has commenced, and the materials have developed a range of particle sizes. Although it is slightly surprising that the highest average particle stress is not associated with the smallest number of contacts (i.e. 2), the findings presented here agree with the principle behind fractal crushing, i.e. that the coordination number is the key to the emergence of a fractal PSD—the largest particles become surrounded by an increasing number of smaller particles, which ‘protect’ the large particles, increase the coordination number, and reduce both the average stress and its variability. Meanwhile, the smaller particles with 3–4 contacts have practically the highest qave and the highest variation in shear stresses (hence the highest qmax)—and
therefore these are the particles that continue to break, filling the ever-shrinking voids and giving additional contacts to the largest particles. As demonstrated by comparing the values in Table 2 at stress of 10 and 20 MPa, this process appears continuous.
4. Conclusions
The normal compression of clumps with different relative densities have been compared to spheres; the onset of crushing appears to be a function of the average octahedral shear stress, qave in the
particles, which in turn appears to be a unique function of the applied vertical stress, σv (at least up
until yield). However, the ‘yield stress’ obtained visually from the compression plot of voids ratio versus applied stress appears different for each sample, and occurs at a lower value of σv for the
looser sample due to the larger voids being able to accommodate the fragments produced. The dense sample by comparison requires more crushing before apparent yielding so that the smaller voids can accommodate the smaller fragments. On the normal compression line, the largest particles have many more contacts and although the average particle stress, qave for these large particles may
be significant, the variation is small. For the smaller fragments, with 3-4 contacts, not only is the average shear stress higher but also the variability is high, and it is therefore these particles that continue to break—and this process continues across a range of decreasing scales as stress increases. This work therefore confirms both the dominance that the coordination number has on the likelihood of a particle breaking, and that it is key to the evolution of a fractal particle size distribution. Moreover, the work presented here is a step towards improving the realism of DEM-based soil models, incorporating both particle crushing and irregular shape.
Acknowledgements
The authors would like to thank the Engineering and Physical Sciences Research Council (EPSRC) for their financial support.
References
[1] G.R. McDowell, J.P. de Bono, On the micro mechanics of one-dimensional normal compression, Géotechnique. 63 (2013) 895–908. doi:10.1680/geot.12.P.041.
[2] J.M. Pestana, a. J. Whittle, Compression model for cohesionless soils, Géotechnique. 45 (1995) 611–631. doi:10.1680/geot.1995.45.4.611.
[4] G.R. McDowell, J.P. de Bono, P. Yue, H.-S. Yu, Micro mechanics of isotropic normal compression, Géotechnique Lett. 3 (2013) 166–172. doi:10.1680/geolett.13.00050. [5] Itasca, Particle Flow Code in 3 Dimensions, Itasca Consulting Group, Inc., Minneapolis,
Minnesota, 2005.
[6] G.R. McDowell, On the yielding and plastic compression of sand, Soils Found. 42 (2002) 139– 145.
[7] J.C. Jaeger, Failure of rocks under tensile conditions, Int. J. Rock Mech. Min. Sci. Geomech. Abstr. 4 (1967) 219–227. doi:10.1016/0148-9062(67)90046-0.
[8] G.R. McDowell, A. Amon, The application of weibull statistics to the fracture of soil particles, Soils Found. 40 (2000) 133–141.
[9] J.P. de Bono, G.R. McDowell, Discrete element modelling of one-dimensional compression of cemented sand, Granul. Matter. 16 (2014) 79–90. doi:10.1007/s10035-013-0466-0.
[10] Y. Nakata, Y. Kato, M. Hyodo, A.F. Hyde, H. Murata, One-dimensional compression behaviour of uniformly graded sand related to single particle crushing strength, Soils Found. 41 (2001) 39–51.
[11] M.R. Coop, The mechanics of uncemented carbonate sands, Géotechnique. 40 (1990) 607– 626. doi:10.1680/geot.1990.40.4.607.
[12] G.R. McDowell, M.D. Bolton, On the micromechanics of crushable aggregates, Géotechnique. 48 (1998) 667–679. doi:10.1680/geot.1998.48.5.667.
[13] M.M. Hagerty, D.R. Hite, C.R. Ullrich, D.J. Hagerty, One‐Dimensional High‐Pressure
Compression of Granular Media, J. Geotech. Eng. 119 (1993) 1–18. doi:10.1061/(ASCE)0733-9410(1993)119:1(1).
![Figure 1. Voids ratio as function of applied vertical stress, for DEM simulation of the normal compression of an initially monodisperse assembly of spheres; plotted on double logarithmic axes with the predicted slope shown [9]](https://thumb-us.123doks.com/thumbv2/123dok_us/8668885.376497/4.595.159.434.68.301/function-vertical-simulation-compression-initially-monodisperse-logarithmic-predicted.webp)