Shrinking Net Sown Area and Changing
Land Use Pattern in Bihar: An
Economic Analysis
Sinha, D.K. and Ahmad, Nasim and Singh, K.M.
Dr.Rajendra Prasad Central Agricultural University, Pusa
14 May 2017
Online at
https://mpra.ub.uni-muenchen.de/80268/
Shrinking Net Sown Area and Changing Land Use Pattern in Bihar: An Economic Analysis
D.K Sinha1, Nasim Ahmad2, and K.M. Singh3,
Abstract
Land is vital natural resource for any developmental activity. The judicious use of land is an earnest demand of time as the increasing demand for food and shelter is rapidly increasing with the burgeoning population. Bihar shares about 8.63% of the total population in the country while the share in total land area of India is only 2.86%. There are about 1.61 crore farm holdings of which 91% is marginal still about 68 percent of population earns their livelihood from agriculture and allied sector. Agriculture holds a vital role in food and nutrition security of the state in addition to overall development. Land is an important input for the agriculture sector. Hence, any change or changes in land use pattern has significant implication in food security for the state in particular and nation in general. This paper is based on secondary data published by Government of Bihar. An attempt has been made to investigate agro-climatic zone wise land use of the state and state as a whole. The study reveals that the net sown area has declined both on zonal level and also at state level. Decline in net sown area in agro-climatic zone-III is more pronounced than that of zone-I & zone-II. Being centre of the state, urbanization has taken place in faster way in the zone-III. The other reasons for changes undergoing in land use pattern may be increasing population, fragmentation of land holdings and declining water table in this region. Zone-I & zone-II come under flood prone area, farmers put their land as current fallow due to devastating flood threat causing damage to their crops. Land under trees and groves have also witnessed positive percentage change over the decade and also in growth rate, this may be the other reason for decline in net sown area in the state. Shrinking of net sown area is of great concern to feed the up warding growth of population. Motivating farmers to increase productivity to protect growing population and serving their demand for food and nutritional security, we have to make such kind of strategies which may lead to enhance the income of the cultivators as well as fulfill the food demand of growing population, keeping in mind the fast changing climatic conditions all over the world and protecting wasteful and careless use of natural resources for betterment of coming generation.
Key words: Land use pattern, Net sown area, Agro-climatic zone, nutritional security Compound Growth Rate (CGR)
1
Professor, (Agricultural Economics)
2
Technical Officer (Computer) and
3
Professor and Chairman, Department of Agricultural Economics,
Dr. Rajendra Pd. Central Agricultural University, Pusa, Samastipur (Bihar) - 848 125, Email (Corresponding Author): [email protected]
Shrinking Net Sown Area and Changing Land Use Pattern in Bihar: An Economic Analysis
Introduction
Land and water are considered as vital natural resources for sustaining human beings and for all developmental activities. Like any other resources land has two dimensions i.e. quality and quantity, and both the dimensions are under serious threat due to intensive and extensive use of land both for agricultural and non-agricultural uses (Ramasamy et. al 2002). Technological development in agricultural sector and intensification of agriculture for ever increasing demand of food for rapidly increasing population has put the pressure on land for increasing food production and shelter consequently uses of non-agricultural land is alleviating. Shrinking of agricultural land and increasing food demand are posing serious challenges to researchers and policy makers. Bihar shares about 8.63% of the total population in the country while the share in total land area of India is only 2.86%. There are about 1.61 crore farm holdings of which 91% is marginal still about 68 percent of population earns their livelihood from agriculture and allied sector.
Variation in soils, or soils and landforms, is often the main cause of differences between land mapping units within a local area: it is for this reason that soil surveys are sometimes the main basis for definition of land mapping units. However, the fitness of soils for land use cannot be assessed in isolation from other aspects of the environment, and hence it is land which is employed as the basis for suitability evaluation. Land is a scarce resource, whose supply is fixed for all practical purposes. At the same time, the demand for land for various competing purposes is continuously increasing with the increase in human population and economic growth. The types of use considered are limited to those which appear to be relevant under general physical, economic and social conditions prevailing in an area. These kinds of land use serve as the subject of land evaluation. They may consist of major kinds of land use or land utilization types (FAO).
under most of the crops, there will be atmost need to raise the productivity of crops. The agricultural land use refers to primary use of geographical area for different purposes and activities. Land use is the surface utilization of all developed and vacant land on specific point at given time and space (Mandal, 1982).
Agriculture plays a crucial role in food and nutrition security of the state/country in addition to overall development. Any change or changes in the land use pattern and diversification of area cropped has significant implication in food security of the state/country. No doubt, Bihar agriculture is regarded as land based activity, where water and land act as basic inputs for life support system and also vital resource for the economic life of majority of people in the state. Due to urbanization, increase in population and fragmentation of land holdings, land use pattern has been undergoing changes over the years (Ashrit, 2014).
The economy of Bihar is predominantly considered as an agrarian economy. Agriculture contributes nearly 22% of the state GDP. Bihar agriculture is still interwoven in the clutches of vicious circle of poverty that it follows the sequences like low investment, low productivity, low income, low saving and again low investment. Since inception of Green revolution, the income level of the farming community has obviously enhanced, however, it is many fold lower as compared to developed states like Punjab & Haryana, even lower than national average. Nowadays a debate is going on that eastern India may be the potential area for food basket of India in the present country, where abundant untapped natural resources are available for rational uses. This may further scale up agricultural production and productivity, lead to rise in income of the agrarian masses of the state, ultimately add to the national income/ exchanger.
development in Bihar. Data pertaining to the land use pattern in Bihar showed that the net sown area is declining and areas under current fallow and land under non- agricultural uses have increased over the last 10 years. An annual decline of about 15 thousand hectares in net area sown has been observed during last 10 years. (Singh, et al., 2014)
The present study is an attempt to understand the changes taking place in land use pattern in the Bihar, and its different agro-climatic zones to understand the dynamics and causes of changes after bifurcation of the state for decade 2003-2013, data for which was available.
Methodology
The study is based on secondary data collected from various published sources like various issues of Bihar through Figures, Statistical Handbook of Agriculture, Bihar Economic Survey and also various online resources like websites of Agriculture Department and Horticulture Mission of Government of Bihar for the period under reference i.e. 2003-2013.
Bihar has been divided into three agro-climatic zones such as Zone-I, Zone-II and Zone-III based on soil, land use, topography and other such natural parameters. Zone-I & Zone-II are located north of river Ganga and are named as North Western and North Eastern Alluvial Plains Zone respectively are characterized as flood prone compared to Zone-III, which falls under South of river Ganga and are called as South Bihar Alluvial Plains Zone. Tabular analysis and compound growth rate are carried out to examine the changes taken place in land use pattern of the state as whole and at zonal level.
Compound Growth Rate (CGR) was worked out using exponential equation Y=ABt
Log Y= log A+ t log B Let Log Y=y, logA =a and LogB=b
y= a+tb
r = (antilog ‘b’ -1) x 100
Where Y = different components of land use pattern (in ‘000 ha) a= Intercept
b = Regression coefficient
t = Time periods (t= 1,2,3,………10)
Results and Discussion
Changes in Land Use Pattern in Bihar
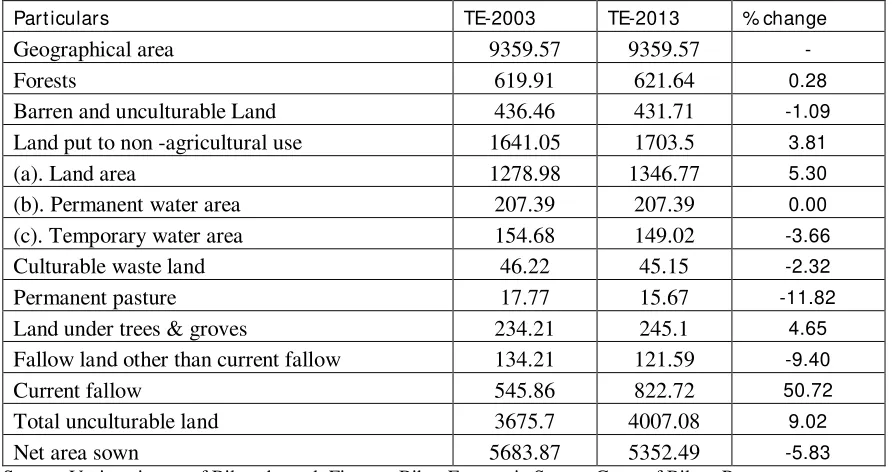
[image:6.595.85.531.486.722.2]Table 1 reveals the changes in land use pattern during the periods between TE-2003 and TE-2013, showing the changes in different activities over the periods. The higher the proportion of net sown area to the total geographical area higher the agricultural production (Malik, 2012). It is observed that the net sown area for the state as a whole has markedly reduced by 5.83% during TE-2003 to TE-2013 Rise in the area under non-agricultural uses, land under trees & groves as well as area under current fallow may also be the one of the reasons for decline in net sown area. The area put to non agricultural uses has recorded 3.81% increase in the decade under study. The reason for sharp increase in area under this activity may probably be attributed to settlement of rising human population, construction of recreation grounds, development of infrastructural facilities for public, set up of factories/companies etc. The land under trees & groves recorded 4.65% increase in the last 10 years. Thus, it is also noticed that the total unculturable land has also gone up by 9.02% during the period under study. Further, it was observed that the land under current fallow has risen to 50.72% during the study period. Swift rise in current fallow may probably be due to ongoing global climatic changes causing erratic rainfall, decline in water table, rising cost of production as well as leaving the soil fallow for maintaining soil fertility/ health.
Table 1: Land utilization pattern in Bihar (Area in ‘000 ha)
Part iculars TE-2003 TE-2013 % change
Geographical area 9359.57 9359.57 -
Forests 619.91 621.64 0.28
Barren and unculturable Land 436.46 431.71 -1.09
Land put to non -agricultural use 1641.05 1703.5 3.81
(a). Land area 1278.98 1346.77 5.30
(b). Permanent water area 207.39 207.39 0.00
(c). Temporary water area 154.68 149.02 -3.66
Culturable waste land 46.22 45.15 -2.32
Permanent pasture 17.77 15.67 -11.82
Land under trees & groves 234.21 245.1 4.65
Fallow land other than current fallow 134.21 121.59 -9.40
Current fallow 545.86 822.72 50.72
Total unculturable land 3675.7 4007.08 9.02
Net area sown 5683.87 5352.49 -5.83
Agro-Climatic Zone-wise land use pattern in Bihar.
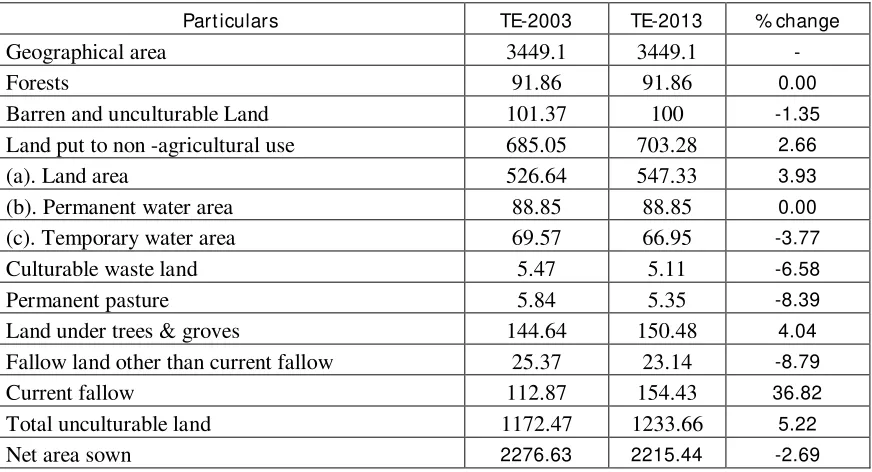
Land use pattern in agro-climatic Zone-I( Table 2) reveals that the net sown area has declined by 2.69% during the period TE-2003 & TE-2013, The area under another activity such as non-agricultural uses has been recorded an increase of 2.66%
[image:7.595.88.524.333.569.2]Further, the land under tree crops & groves has also gone up by 4.04%. The barren and unculturable land includes lands in mountains and hill slopes, desert, plateaus, rocky area and extremely degraded lands. These lands cannot be brought under cultivation unless at a very high input cost with possible low returns. So it is not beneficial to bring these lands under cultivation because it demands a very high input cost with possible low returns (Malik, 2012). It is observed that the area under barren and unculturable land have been reduced marginally (1.35%) over the period under study.
Table 2: Land use pattern in Agro-Climatic Zone-I of Bihar (Area in ‘000 ha)
Part iculars TE-2003 TE-2013 % change
Geographical area 3449.1 3449.1 -
Forests 91.86 91.86 0.00
Barren and unculturable Land 101.37 100 -1.35
Land put to non -agricultural use 685.05 703.28 2.66
(a). Land area 526.64 547.33 3.93
(b). Permanent water area 88.85 88.85 0.00
(c). Temporary water area 69.57 66.95 -3.77
Culturable waste land 5.47 5.11 -6.58
Permanent pasture 5.84 5.35 -8.39
Land under trees & groves 144.64 150.48 4.04
Fallow land other than current fallow 25.37 23.14 -8.79
Current fallow 112.87 154.43 36.82
Total unculturable land 1172.47 1233.66 5.22
Net area sown 2276.63 2215.44 -2.69
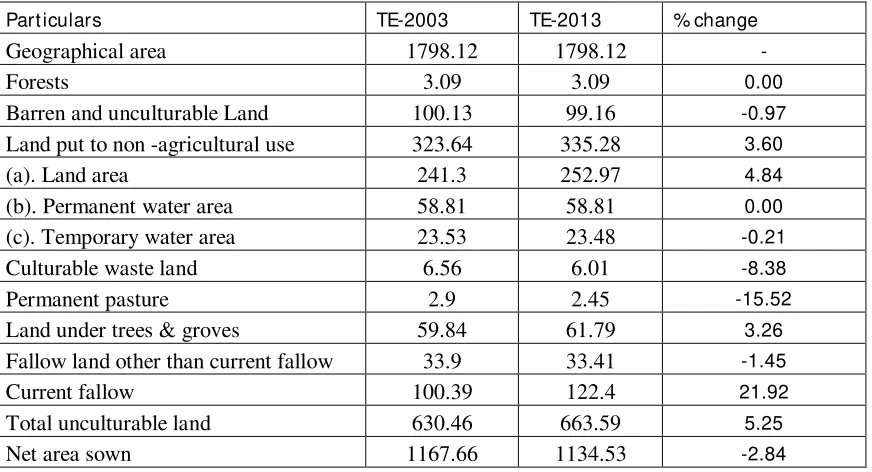
Land use pattern in agro-climatic Zone-II of the state has been presented in Table 3. A perusal of the figures presented in table indicates towards the fact that the net sown area has declined by 2.84% during the decade.
[image:8.595.90.526.361.597.2]Following the same trend as in zone-I, the area put to non-agricultural uses and the land under tree crops & groves went on rising as it was evidenced by percentage change over the period TE-2003-TE-2013 being 3.60% and 3.26%, respectively. The reasons for decline in the net sown area and rise in the land under tree crops and groves may probably be the same as has been explained earlier. The interesting point to note is that in Zone-II, area concerning fallow land other than current fallow has registered decreasing trend, revealing the percentage change of 1.45%. The growth in current fallow area was recorded positive change (21.92%) in zone-II. Since, this zone is more flood prone area, thus the current fallow lands in this zone may have increased due to the reasons that the farmers may have kept their land as fallow on account of recurring devastating flood.
Table 3: Land use Pattern in Agro-Climatic Zone-II of Bihar (Area in ‘000 ha)
Part iculars TE-2003 TE-2013 % change
Geographical area 1798.12 1798.12 -
Forests 3.09 3.09 0.00
Barren and unculturable Land 100.13 99.16 -0.97
Land put to non -agricultural use 323.64 335.28 3.60
(a). Land area 241.3 252.97 4.84
(b). Permanent water area 58.81 58.81 0.00
(c). Temporary water area 23.53 23.48 -0.21
Culturable waste land 6.56 6.01 -8.38
Permanent pasture 2.9 2.45 -15.52
Land under trees & groves 59.84 61.79 3.26
Fallow land other than current fallow 33.9 33.41 -1.45
Current fallow 100.39 122.4 21.92
Total unculturable land 630.46 663.59 5.25
Net area sown 1167.66 1134.53 -2.84
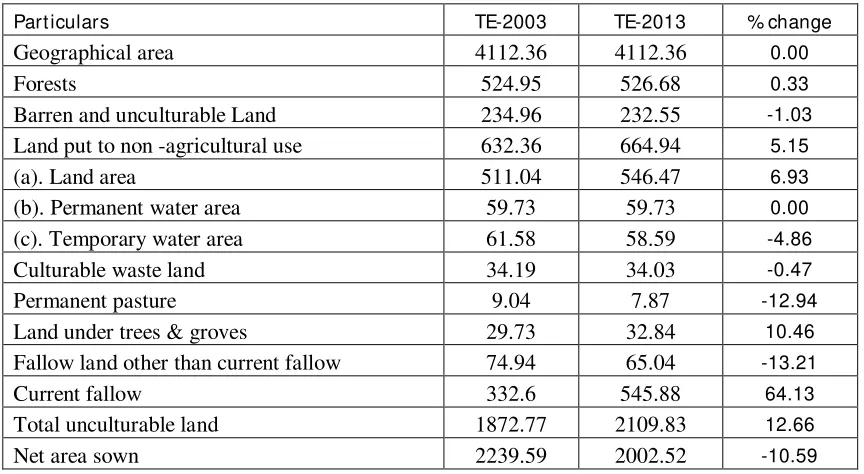
Table 4 consisting of land use pattern of agro-climatic zone-III of the state revealed the extent of changes accrued so far in different activities, included in the table over the period under study.
Table 4: Land use pattern in Agro-Climatic Zone-III of Bihar (Area in ‘000ha)
Part iculars TE-2003 TE-2013 % change
Geographical area 4112.36 4112.36 0.00
Forests 524.95 526.68 0.33
Barren and unculturable Land 234.96 232.55 -1.03
Land put to non -agricultural use 632.36 664.94 5.15
(a). Land area 511.04 546.47 6.93
(b). Permanent water area 59.73 59.73 0.00
(c). Temporary water area 61.58 58.59 -4.86
Culturable waste land 34.19 34.03 -0.47
Permanent pasture 9.04 7.87 -12.94
Land under trees & groves 29.73 32.84 10.46
Fallow land other than current fallow 74.94 65.04 -13.21
Current fallow 332.6 545.88 64.13
Total unculturable land 1872.77 2109.83 12.66
Net area sown 2239.59 2002.52 -10.59
So far as the net sown area is concerned, negative percentage change was estimated (-10.59%), indicating thereby decline in net sown area over the periods TE-2003 to TE-2013. There has been rapid increase in the area put to non-agricultural uses as it was recorded 5.15% increase over the decade comparatively Larger than other zones even that of state as whole. The growth in this category of land may be assigned to the fact that the pace of urbanization, zone being the centre/ capital of the state, was comparatively high in this zone.
The other reason may be concentration of industries, fast pace of expansion of infrastructures in this zone. The percentage change in land covered under trees & groves has also gone up by 10. 46%, because cultivators of this zone are leaving their lands under this category due to scarcity of irrigation water sharpened by declining water table in the area. On the other hand, the current fallow land has been gone up by 64.12%, this may probably be also on account of scarcity for irrigation water arising from declining water table in the zone, farmers are putting their land as current fallow.
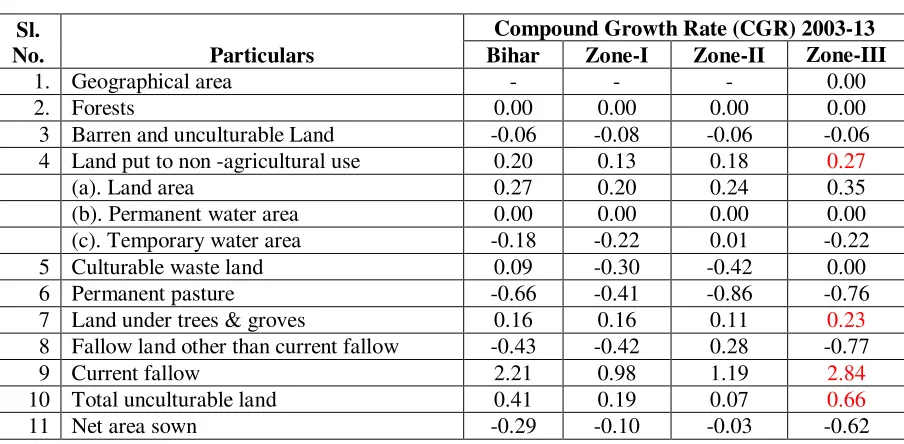
Compound Growth Rate
Compound growth rate for different categories of land use pattern were worked out for both at the zonal level and state as whole for the decade TE-2003 to TE-2013 to investigate the detail picture on spatial and temporal dimensions of the dynamics of land use pattern in three different agro-climatic zones and state as a whole. The Compound growth rates are presented in table 5.
Table 5: Compound Growth Rate for the decade TE-2003-13
Sl.
No. Particulars
Compound Growth Rate (CGR) 2003-13
Bihar Zone-I Zone-II Zone-III
1. Geographical area - - - 0.00
2. Forests 0.00 0.00 0.00 0.00
3 Barren and unculturable Land -0.06 -0.08 -0.06 -0.06
4 Land put to non -agricultural use 0.20 0.13 0.18 0.27
(a). Land area 0.27 0.20 0.24 0.35
(b). Permanent water area 0.00 0.00 0.00 0.00
(c). Temporary water area -0.18 -0.22 0.01 -0.22
5 Culturable waste land 0.09 -0.30 -0.42 0.00
6 Permanent pasture -0.66 -0.41 -0.86 -0.76
7 Land under trees & groves 0.16 0.16 0.11 0.23
8 Fallow land other than current fallow -0.43 -0.42 0.28 -0.77
9 Current fallow 2.21 0.98 1.19 2.84
10 Total unculturable land 0.41 0.19 0.07 0.66
11 Net area sown -0.29 -0.10 -0.03 -0.62
Perusal of the above table revealed that growth rate of land put to non agricultural uses has positive compound growth rate both for different zones and state as a whole. Maximum growth rate of non-agricultural use of land was found in zone-III i.e. 0.27 percent as compared to 0.13% in zone-I and 0.18% in zone-II and 0.20% in the state as whole. The reasons for this have already been described. An interesting point emerged in growth rate of fallow land other than current fallow. In zone-II growth rate was positive (0.28%) while in other zones and state it was found negative. This zone is flood affected hence the upland which was fallow may be used for cultivation or residential purposes hence, its growth has been found positive. Land under current fallow, trees and groves and total unculturable land have positive growth indicating people have put their land under trees and groves and current fallow due to erratic nature of rainfall or poor due to poor economic condition of the farmers. The growth rate of net area sown has also been found negative in zonal level as well as state as a whole as the land is shifting towards non-agricultural use due to infrastructural development and cultivators are leaving their land uncultivated to uncertainty of rainfall, irrigation through diesel pump sets is quite expensive. The Cultivators may have left their land fallow due to this reason also. But shrinking in net sown area is of critical concern for sustaining food security to ever increasing population.
Conclusions
following categories of land such as area under non-agricultural uses, area put to trees and groves and area under current fallow in the state. The pressure of rising population on land has led to shift of cropped land towards the categories of non-agricultural uses. The scarcity of irrigation water, labour etc may be the probable cause for shift of land to tree crops current fallows.
Other studies have also found that decline in net sown area is mainly due to unabated and massive conversion of agricultural land for building houses and construction of infrastructure. Similarly, increase in current fallows might be due to erratic rainfall, peak time scarcity of labour, unreliable and costly irrigation and tiny unviable farm holdings in Bihar. Policy makers are not realizing the challenge posed to agriculture due to decline in net area sown and increasing fallow land in the state which warrants their immediate attention (Singh et al. 2014).
On account of worldwide global warming, the water table is further going down throughout the state. Cost of irrigation is rising due to larger use of diesel pump sets as well as declining water table in the state. Now, the question is how to raise the productivity/income from per unit decreasing crop land. Contemplating the foregoing discussion, it may be suggested that timely supply of quality seeds, fertilizers larger use of electrical and solar devices for extraction of irrigation water, desiltation of canals and also linking different canals as well as proper marketing of agricultural produces will certainly encourage the farmers for not putting their land as current fallow and also help them in harvesting/garnering more income from per unit of land area.
References
1. Ashrit, Radha R. (2014). Temporal and Spatial variations of Land Usage Pattern in the Country. Agricultural Situation in India, February 2014. LXX (11)::5-12.
2. Department of Agriculture, Government of Bihar http://krishi.bih.nic.in/
3. Government of Bihar, Annual Report, Department of Agriculture, Government of Bihar (Various issues)
4. Government of Bihar, Economic Survey Department of Finance (various issues) 5. Govt. of Bihar, Statistical Handbook (Various issues)
6. http://www.fao.org/docrep/x5310e/x5310e03.htm
7. Malik, Jitender (2012). Changing land use pattern in Haryana. Int. Jr. of Computing and Corporate Res. Nov. 2012, 2 (6).
9. Pattern of Land Utilisation in India, Available at
http://www.yourarticlelibrary.com/essay/pattern-of-land-utilisation-in-india/33044/.
Accessed on 5.11.2016
10.Premakumara & Seema (2013). “Land Use Pattern in India and Karnataka: A Comparative Study” International Journal of Scientific Research. October 2013. 2
(10) :1-3.
11.Singh, R.K.P.; Singh, K.M. and Kumar, Abhay, 2014.Agricultural Development in Bihar: Some Empirical Evidences. Agricultural Situation in India,March 2014. LXX
(12):.5-14.