Macro Mars to Micro Mars:
Mapping Minerals and Magnetization
Thesis by
Jennifer Buz
In Partial Fulfillment of the Requirements for the degree of
Doctor of Philosophy
CALIFORNIA INSTITUTE OF TECHNOLOGY
Pasadena, California
Caltech GPS <3 Ge 136 4 LYFE
2018
2018
Jennifer Buz
iii
ACKNOWLEDGEMENTS
I would like to thank Bethany Ehlmann and Joe Kirschvink who have each been excellent mentors
in their own way. Bethany, my primary advisor, couldn’t have been a better role model. I am
appreciative of the patience she has shown me, the encouragement she has given me, and the
endless opportunities she has presented me with. Joe has been incredibly supportive, always
optimistic, and a fountain of interesting projects and ideas. I would also like to thank the rest of the
GPS faculty who have taught me so much in terms of book learning, creativity in pursuing projects,
and persistence. In particular, I would like to thank Woody Fischer and Mike Lamb who served on
my thesis advisory committee, John Grotzinger who I have had the privilege of collaborating with,
and George Rossman who has always been helpful and excited. Really, Bethany and Joe r awesome
I definitely could not have gone this far without my family being behind me every step of the way.
My parents have made countless sacrifices for our education and their enthusiasm and curiosity has
surely fueled our academic careers. I am also grateful to my brother who has bravely done
everything before me and shown me the way so casually as to imply it’s all so easy! My aunts,
uncles, cousins, and grandparents have always been my biggest cheerleaders and I have been so
lucky to have them nearby while I was at Caltech. I love my family so much!
My friends in and out of GPS have absolutely kept me sane. Whether it was getting a coffee, a
beer, or just hanging out, the friendly smiles and welcoming atmosphere all around has been an
excellent way to decompress. I’ve been lucky to have childhood friends and roommates to talk
about non-science things with. I was fortunate to have an entertaining and friendly pit, great
officemate in Natalia, and helpful and supportive lab mates both in the Ehlmann and Kirschvink
labs. I’m also grateful to my past class and lab mates at MIT who have kept in touch and offered
support as I embarked on later adventures. In particular I would like to thank Ben Weiss who has
always made himself available for scientific, life, or career advice.
The Caltech GPS department could not be such a productive and happy place if it were not for the
excellent administrative staff. I have always been greeted kindly even when the paperwork surely
seems insurmountable and I am extremely appreciative for that.
I will look back at my time as a PhD student at Caltech fondly and it is because of each person I
have interacted with during this time, whether I mentioned you explicitly or not, Thank You!
ABSTRACT
Combination of remote sensing data with in-situ measurements provides a fuller
understanding of Mars phenomena. This dissertation focuses on integrating macroscopic
and microscopic scales of measurement with regard to spectroscopy and magnetization. In
the first chapter high resolution orbital spectroscopy (~18 m/px) and imagery (~30 cm/px)
are used to identify potential sources for some of the sedimentary rocks investigated by the
Curiosity rover and expand the accessible stratigraphy. While we find mineralogies in
common outside and inside the crater as well as transport mechanisms, we conclude that
additional sedimentary sources and/or modification after transport are required to explain
chemical differences and that strata point to multiple episodes of a lake in Gale crater. In the
third chapter we conducted a laboratory photometric study on candidate calibration target
materials for the Mars-2020 rover. We characterized these target materials for proper
calibration and monitoring of the Mastcam-Z instrument to enable mineral identification
through reflectance spectroscopy. The fourth and fifth chapters focus on the microscopic
magnetizations found within Martian meteorite ALH84001. Chapter four reports on
paleomagnetic experiments conducted on isolated carbonate crystals that contain magnetite
previously reported to be biogenic. We compare paleomagnetic test results which distinguish
between biogenic and abiogenic origin hypotheses and find that the magnetization within the
carbonates is most consistent with a shock processes. In chapter five we analyzed the
distribution of dipoles within slices of ALH84001 and determined that they lie in a girdle
distribution that could be interpreted as resulting from a true polar wander event on Mars.
Looking at kilometer scale observations outside of Gale enlightened observations made
along the rover transverse path. A high-resolution laboratory analysis of calibration materials
will enable future multispectral mineralogical explorations. Microscopic analyses of
magnetization inform ancient surface processes on Mars and hint at large-scale global
change. In each of these chapters our results were only made possible or greatly enhanced
v
PUBLISHED CONTENT AND CONTRIBUTIONS
Buz, J., B. L. Ehlmann, L. Pan, and J. P. Grotzinger (2017), Mineralogy and stratigraphy of the Gale crater rim, wall, and floor units, J. Geophys. Res. Planets, 122, 1090–1118,
doi:10.1002/2016JE005163.
J.B. participated in the conception of the project and led the gathering of mineralogical data, mapping, interpretations, and the writing of the manuscript.
TABLE OF CONTENTS
Acknowledgements………... ... iii
Abstract ………iv
Published Content and Contributions………...v
Table of Contents………. vi
List of Acronyms...………..vii
Chapter 1: Introduction ... 1
Chapter 2: Mineralogy and stratigraphy of the Gale crater rim, wall, and floor units ... 8
Chapter 3: Photometric characterization of Lucideon and Avian Technologies color standards: Application for calibration of the MastCam-Z Instrument on the Mars-2020 rover ... 52
Chapter 4: Possible shock origin for magnetization in ALH84001 carbonates ... 78
Chapter 5: Potential true polar wander observed in ALH84001 ... 101
Chapter 6: Summary, Implication, and Future Directions ... 113
vii
LIST OF ACRONYMS
AF. Alternating Field
ASD. Analytical Spectral Devices
ARM. Anhysteretic Remanent Magnetization
BRDF. Bidirectional Reflectance Distribution Function
CAT. CRISM Analysis Tool
CDR. Calibrated data record
CRISM. Compact Reconnaissance Imaging Spectrometer for Mars
CRM. Chemical Remanent Magnetization
CTX. Context Camera
DCS. Decorrelation Stretch
DEM. Digital Elevation Model
DRM. Detrital Remanent Magnetization
GKS. Gale-Knobel-Sharp
HiRISE. High Resolution Imaging Science Experiment
I/F. Radiance Factor
IRM. Isothermal Remanent Magnetization
MCZ. Mastcam-Z
MOLA. Mars Orbiter Laser Altimeter
MRO. Mars Reconnaissance Orbiter
MSL. Mars Science Laboratory
PRM. Pressure Remanent Magnetization
REFF. Reflectance Factor
ROI. Region of Interest
SRM. Shock Remanent Magnetization
SWIR. Short-wave infrared
THEMIS. Thermal Emission Imaging System
TPW. True Polar Wander
TRM. Thermal Remanent Magnetization
1 C h a p t e r 1
INTRODUCTION
Initial telescopic observations of the surface of Mars showed us that the planet bears many similarities to Earth. Although the intelligently designed ‘canals’ that Percival Lowell identified [Lowell, 1906] did not prove true, the surface of Mars has many other familiar features such as volcanoes, ice caps, and erosionally modified landscapes. We now also know that ancient Mars was once even more Earth-like, hosting areas which were likely habitable [Grotzinger et al., 2014] and having a global magnetic field [Kirschvink et al., 1997; Acuna et al., 1999]. Given Mars’ neighborly position in our solar system and the clear comparisons that can be drawn between it and Earth, we look to Mars to learn about our own planet. However, because we are limited to observing Mars through telescopes, satellites, landers, and meteorite samples, it is often difficult to fully understand any given observation. It is necessary to combine data made through various methods in order to gain the fullest understanding.
Telescopic observations of Mars (both on Earth and in space) allow for measurements of phenomena that occur globally and over many years such as changes in the Martianatmosphere [e.g., Mumma et al., 2009]. Satellite observations allow imaging of Mars from the kilometer to sub-meter scale and the inclusion of more specialized instruments such as spectrometers, magnetometers, and cameras (e.g., [Acuna et al., 1998; Malin et al., 2007; Murchie et
al., 2007]). Through satellites we have been able to assess the distribution of materials on the
surface and have learned that Mars is a basaltic planet with many minerals in common with Earth [Bibring et al., 2005; Ehlmann and Edwards, 2014]. We have also been able to map out geological features and landscapes and construct a chronology for surface evolution (e.g., [Smith et al., 1999;
McEwen et al., 2007; Fassett and Head, 2008; Tanaka et al., 2014]). Variations in the magnetization
of the crust have enabled the discovery and characterization of a past core dynamo [Acuna et al., 1998; Acuna et al., 1999; Connerney et al., 1999; Stevenson, 2001]. In-situ investigations through the use of landers and rovers have allowed us to see beneath the surface of Mars by direct excavation [e.g., Arvidson et al., 2009], conduct micron scale chemical analyses of rocks and sediments [e.g.,
Anderson et al., 2015], and determine lithologies we could not have seen from orbit, such as the
presence of conglomerates [Williams et al., 2013]. Furthermore, combination of local atmospheric observations [Martínez et al., 2017] with global datasets [Mumma et al., 2009] have shed light on trace gas and aerosol variability and Mars climate models [Viscardy et al., 2016].
Mars sample return through planetary missions will come in the future, but for now we have a suite of Martian samples which has been delivered to us through impact processes: meteorites. Although these samples are not representative of the Martian crust and originate from unknown locations [Mcsween, 1994; Agee et al., 2013] we have learned much through the ability to interrogate the samples in state-of-the art facilities on Earth. Isotopic measurements, for example, have enabled the determination of past surface conditions, including chemistry and temperatures [e.g., Halevy et al., 2011]. We have also learned about the strength of a surface magnetic field, likely from a core dynamo [Kirschvink et al., 1997; Weiss et al., 2002].
are: (1) What further constraints can remote sensing observations place on in-situ observations (via a rover or hand sample)? (2) How do microscopic observations influence the interpretation of large-scale measurements? In this thesis I present a series of studies that combine information gained through satellite, in-situ, and hand sample measurements. The chapters are summarized below:
Chapter Summaries Chapter 2
The Mars Science Laboratory (MSL) rover team is studying a sedimentary sequence of rocks on Mt. Sharp, within Gale crater [Grotzinger et al., 2012]. Where these rocks and sediments came from is not fully understood from rover data alone. A major motivation for this study was the discovery of feldspathic and high-Si lithologies as float within Gale [Sautter et al., 2014; Morris
et al., 2016], which is unexpected given the abundance of mafic minerals within the region
[Ehlmann and Buz, 2015]. We used satellite data, both spectroscopy and high resolution imagery, in the greater Gale region to assess the mineralogical diversity and identify processes which may have delivered material to the vicinity of the rover. We found that the walls and rim of Gale crater host a similar mineralogy to that observed along some portions of the traverse, specifically we found a predominantly basaltic bedrock with variable Fe/Mg phyllosilicates. We also observe that though the general mineralogy of the phyllosilicates are the same in and out of Gale, there is the inclusion of Fe, Al phyllosilicates within some layers of Mt. Sharp [Milliken et al., 2010]. We conclude that there is evidence both for transport of material from the Gale rim and wall and also for modification of these materials later. We did not find evidence for felsic material outside of Gale or in its wall rock through our methods; however, we are limited in detection capabilities because the inclusion of mafic minerals such as olivine and pyroxene can overwhelm any felsic signatures in the visible-near infrared. Furthermore, the thermal infrared instrument which is more sensitive to high-Si lithologies has a much larger spatial resolution, perhaps larger than any felsic outcrops, if they exist in the region.
Looking at the stratigraphy of the region from orbit, we identified multiple geologic units which have characteristics of lake sediments (e.g. fracturing, presence of phyllosilicates, layering). By mapping these out we are able to extend the potential lake sediment stratigraphy >250 m below the MSL traverse. Although the contact between the various lacustrine-interpreted units is not always well exposed, this finding points to several episodes of lake Gale that predate the MSL sediments in line with the hypothesis from examination of the levels of multiple delta/fan deposits that Gale may have hosted many lakes [Palucis et al., 2016].
Chapter 3
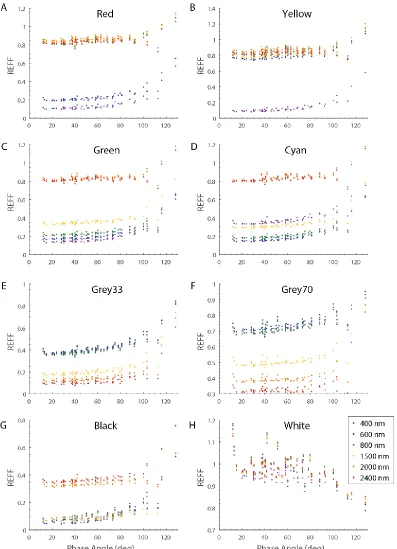
forward-3 scattering. The targets are increasingly isotropic at longer wavelengths. All have scattering properties that are characterizable and quantifiable. For the calibration purposes of the Mastcam-Z instrument for which they were designed, these calibration materials will be suitable standards for correction of Mars data. Furthermore, they may be of use to other imagers and spectrometers on board the rover.
Chapter 4
Martian meteorite ALH84001 has been well-studied because of the diversity it brought to the Martian meteorite suite through its novel mineralogy and ~4.1 Ga age. However, many of the studies of ALH84001 have focused on what has been interpreted by some as a Martian biosignature: magnetite crystals within carbonate globules which bear striking resemblance to those formed by magnetotactic bacteria on Earth [e.g., McKay et al., 1996; Thomas-Keprta et al., 2000]. The leading abiogenic hypothesis involves the formation of these magnetite crystals through chemical alteration (through heating or a shock process) of the carbonate which hosts them [Treiman and Essene, 2011]. These two contradictory formation scenarios can be classified as detrital (i.e., the magnetite formed biogenically and then was deposited or entrained) or chemical (i.e., the magnetite formed in-situ). Paleomagnetics can be used to distinguish between these scenarios in terrestrial samples. These tests could not be conducted on ALH84001 previously because of the microscopic size of the samples. Our study utilized a high-resolution scanning magnetic microscope to apply these tests.
Fuller’s test of Natural Remanent Magnetization [Fuller et al., 1988] measures the efficiency of a magnetization process. In a detrital scenario, where magnetic particles are subject to oscillations in an aqueous medium, the magnetization will be less efficient than in a chemical scenario where the particles are able to grow and align with an external magnetic field without external forcing. We found that the magnetization of the carbonates was consistent with a high-efficiency process. This test is calibrated for an Earth-strength field (which is consistent with previous estimates of Mars’ field strength [Kirschvink et al., 1997; Stevenson, 2001; Weiss et al., 2008]). The anhysteretic remanent magnetization acquisition test [Cisowski, 1981] probes the inter-particle interactions within a sample. In a detrital scenario, magnetic particles will be strongly interacting because they naturally clump together whereas in a chemical scenario the particles are formed evenly distributed throughout the protolith and therefore are less interacting. We find that the ALH84001 carbonates are highly interacting. However, to calibrate this test we also measured natural carbonate samples of various states of alteration and found that highly altered carbonates also demonstrate highly-interacting behavior. Lastly, we applied the Lowrie-Fuller Test [Newell, 2000] which both distinguishes between single-domain (consistent with biogenic origin) and multi-domain magnetite and allows for comparison between demagnetization of the original remanence with that of laboratory fields. We found that the magnetite within the ALH84001 carbonate is predominantly single-domain; however, we also found that the remanence in the ALH84001 carbonates is mostly carried by low coercivity grains, which is most similar to magnetization via a shock process.
The various tests applied to this sample give additional support for an abiogenic origin for the ALH84001 magnetite. A shock origin for the remanence in the ALH84001 carbonates is most consistent with the cumulative data. However, none of these tests have been able to rule out a biogenic origin. More complicated scenarios exist which may allow for a biogenic origin such as the magnetite may be formed biogenically, deposited, and then shocked.
Chapter 5
data from orbiting magnetometers [Acuna et al., 1998]. A later study using magnetic microscopy found that a heterogeneous magnetization exists within the sample and that magnetization is carried within multiple mineralogies [Weiss et al., 2008]. We were interested in the distribution of dipole directions found within ALH84001 and what these might mean for the ancient core dynamo on Mars. We find that the magnetization direction distribution throughout the bulk rock can be described with a girdle distribution. Given the thermal history of ALH84001, which includes multiple shock events and recrystallization, the rock may have preserved magnetization at several points in its past. One interpretation for this distribution of dipoles is that ALH84001 records true polar wander (TPW), i.e., that the Martian dynamo shifted with respect to the surface of Mars as the magnetization was recorded. Due to the nature of the measurements on the bulk sample, where individual dipoles can be difficult to isolate due to their proximity to other dipoles, the error associated with the dipole fitting is significant. Although a TPW scenario is a possible explanation of the data, this dataset does not conclusively prove TPW. Previous, geophysical studies have also concluded that TPW likely happened on Mars [e.g., Sprenke et al., 2005; Perron et al., 2007].
A key aspect of each of the studies was the necessity to expand the observation range. In the case of MSL, our identification of potential protolith material for the Gale floor phyllosilicates came from looking outside of Gale. We were also able to place constraints on the size of potential, yet-unseen, source regions for silica-rich sediments and K-feldspar-enriched sediments measured by the rover by our lack of their detection. Most importantly, the orbital scale permitted identification of older episodes of Gale lake than accessible to the MSL rover. For Mars-2020, our high resolution spectroscopic laboratory characterization of the calibration targets will be necessary for mineralogical and textural characterizations by the Mastcam-Z instrument on the rover. When studying the microscopic magnetization in ALH84001 carbonates and applying paleomagnetic tests that were calibrated for Earth’s magnetic field we needed to incorporate previous geophysical modeling on the field strength of Mars to interpret and validate our results. Similarly, a TPW origin for the magnetization in the bulk of ALH84001 is made more compelling by the geophysical modeling done using satellite data showing that TPW was likely to have occurred on Mars.
References
Acuna, M. H., et al. (1999), Global distribution of crustal magnetization discovered by the mars global surveyor MAG/ER experiment, Science, 284, 790-793, doi:10.1126/science.284.5415.790. Acuna, M. H., et al. (1998), Magnetic field and plasma observations at Mars: Initial results of the Mars global surveyor mission, Science, 279, 1676-1680, doi:10.1126/science.279.5357.1676. Agee, C. B., et al. (2013), Unique meteorite from early Amazonian Mars: water-rich basaltic breccia Northwest Africa 7034, Science, 339, 780-785, doi:10.1126/science.1228858.
Anderson, R., et al. (2015), ChemCam results from the Shaler outcrop in Gale crater, Mars,
Icarus, 249, 2-21, doi:10.1016/j.icarus.2014.07.025.
Arvidson, R. E., et al. (2009), Results from the Mars Phoenix Lander Robotic Arm experiment,
J Geophys Res-Planet, 114, doi:Artn E00e02
5 Bibring, J. P., et al. (2005), Mars surface diversity as revealed by the OMEGA/Mars Express observations, Science, 307, 1576-1581, doi:10.1126/science.1108806.
Cisowski, S. (1981), Interacting Vs Non-Interacting Single Domain Behavior in Natural and Synthetic Samples, Phys. Earth Planet. Inter., 26, 56-62, doi:10.1016/0031-9201(81)90097-2. Connerney, J. E., M. H. Acuna, P. J. Wasilewski, N. F. Ness, H. Reme, C. Mazelle, D. Vignes, R. P. Lin, D. L. Mitchell, and P. A. Cloutier (1999), Magnetic lineations in the ancient crust of mars, Science, 284, 794-798, doi:10.1126/science.284.5415.794.
Ehlmann, B. L., and J. Buz (2015), Mineralogy and fluvial history of the watersheds of Gale, Knobel, and Sharp craters: A regional context for the Mars Science Laboratory Curiosity's exploration, Geophys. Res. Lett., 42, 264-273, doi:10.1002/2014gl062553.
Ehlmann, B. L., and C. S. Edwards (2014), Mineralogy of the Martian Surface, Annu Rev Earth
Pl Sc, 42, 291-315, doi:10.1146/annurev-earth-060313-055024.
Fassett, C. I., and J. W. Head (2008), The timing of martian valley network activity: Constraints from buffered crater counting, Icarus, 195, 61-89, doi:10.1016/j.icarus.2007.12.009.
Fuller, M., S. Cisowski, M. Hart, R. Haston, E. Schmidtke, and R. Jarrard (1988), Nrm-Irm(S) Demagnetization Plots - an Aid to the Interpretation of Natural Remanent Magnetization,
Geophys. Res. Lett., 15, 518-521, doi:10.1029/GL015i005p00518.
Grotzinger, J. P., et al. (2012), Mars Science Laboratory Mission and Science Investigation, Space
Sci. Rev., 170, 5-56, doi:10.1007/s11214-012-9892-2.
Grotzinger, J. P., et al. (2014), A habitable fluvio-lacustrine environment at Yellowknife Bay, Gale crater, Mars, Science, 343, 1242777, doi:10.1126/science.1242777.
Halevy, I., W. W. Fischer, and J. M. Eiler (2011), Carbonates in the martian meteorite Allan Hills 84001 formed at 18±4 C in a near-surface aqueous environment, Proc. Natl. Acad. Sci, 108, 16895-16899.
Kirschvink, J. L., A. T. Maine, and H. Vali (1997), Paleomagnetic evidence of a low-temperature origin of carbonate in the Martian meteorite ALH84001, Science, 275, 1629-1633, doi:10.1126/science.275.5306.1629.
Lowell, P. (1906), Mars and its Canals, The Macmillan company; London: Macmillan & co., ltd. Malin, M. C., et al. (2007), Context Camera Investigation on board the Mars Reconnaissance Orbiter, J Geophys Res-Planet, 112, doi:Artn E05s04
Martínez, G. M., et al. (2017), The Modern Near-Surface Martian Climate: A Review of In-situ Meteorological Data from Viking to Curiosity, Space Sci. Rev., 212, 295-338, doi:10.1007/s11214-017-0360-x.
McEwen, A. S., et al. (2007), A closer look at water-related geologic activity on Mars, Science, 317, 1706-1709, doi:10.1126/science.1143987.
McKay, D. S., E. K. Gibson, Jr., K. L. Thomas-Keprta, H. Vali, C. S. Romanek, S. J. Clemett, X. D. Chillier, C. R. Maechling, and R. N. Zare (1996), Search for past life on Mars: possible relic biogenic activity in martian meteorite ALH84001, Science, 273, 924-930, doi:10.1126/science.273.5277.924.
Mcsween, H. Y. (1994), What We Have Learned About Mars from Snc Meteorites, Meteoritics,
29, 757-779, doi:10.1111/j.1945-5100.1994.tb01092.x.
Milliken, R. E., J. P. Grotzinger, and B. J. Thomson (2010), Paleoclimate of Mars as captured by the stratigraphic record in Gale Crater, Geophys. Res. Lett., 37, doi:Artn L04201
10.1029/2009gl041870.
Morris, R. V., et al. (2016), Silicic volcanism on Mars evidenced by tridymite in high-SiO<sub>2</sub> sedimentary rock at Gale crater, Proc. Natl. Acad. Sci, 113, 7071-7076, doi:10.1073/pnas.1607098113.
Mumma, M. J., G. L. Villanueva, R. E. Novak, T. Hewagama, B. P. Bonev, M. A. Disanti, A. M. Mandell, and M. D. Smith (2009), Strong release of methane on Mars in northern summer 2003,
Science, 323, 1041-1045, doi:10.1126/science.1165243.
Murchie, S., et al. (2007), Compact reconnaissance Imaging Spectrometer for Mars (CRISM) on Mars Reconnaissance Orbiter (MRO), J Geophys Res-Planet, 112, E05S03, doi:Artn E05s03 10.1029/2006je002682.
Newell, A. J. (2000), The Lowrie–Fuller test: single-domain and micromagnetic theory, Earth
Planet. Sci. Lett., 183, 335-346.
Palucis, M. C., W. E. Dietrich, R. M. E. Williams, A. G. Hayes, T. Parker, D. Y. Sumner, N. Mangold, K. Lewis, and H. Newsom (2016), Sequence and relative timing of large lakes in Gale crater (Mars) after the formation of Mount Sharp, J Geophys Res-Planet, 121, 472-496, doi:10.1002/2015je004905.
Perron, J. T., J. X. Mitrovica, M. Manga, I. Matsuyama, and M. A. Richards (2007), Evidence for an ancient martian ocean in the topography of deformed shorelines, Nature, 447, 840-843, doi:10.1038/nature05873.
7 Smith, D. E., et al. (1999), The global topography of Mars and implications for surface evolution, Science, 284, 1495-1503, doi:10.1126/science.284.5419.1495.
Sprenke, K. F., L. L. Baker, and A. F. Williams (2005), Polar wander on Mars: Evidence in the geoid, Icarus, 174, 486-489, doi:10.1016/j.icarus.2004.11.009.
Stevenson, D. J. (2001), Mars' core and magnetism, Nature, 412, 214-219, doi:10.1038/35084155. Tanaka, K. L., S. J. Robbins, C. M. Fortezzo, J. A. Skinner, and T. M. Hare (2014), The digital global geologic map of Mars: Chronostratigraphic ages, topographic and crater morphologic characteristics, and updated resurfacing history, Planetary and Space Science, 95, 11-24, doi:10.1016/j.pss.2013.03.006.
Thomas-Keprta, K. L., D. A. Bazylinski, J. L. Kirschvink, S. J. Clemett, D. S. McKay, S. J. Wentworth, H. Vali, E. K. Gibson, Jr., and C. S. Romanek (2000), Elongated prismatic magnetite crystals in ALH84001 carbonate globules: potential Martian magnetofossils, Geochim Cosmochim
Acta, 64, 4049-4081.
Treiman, A. H., and E. J. Essene (2011), Chemical composition of magnetite in Martian meteorite ALH 84001: Revised appraisal from thermochemistry of phases in Fe-Mg-C-O,
Geochim. Cosmochim. Acta, 75, 5324-5335, doi:10.1016/j.gca.2011.06.038.
Viscardy, S., F. Daerden, and L. Neary (2016), Formation of layers of methane in the atmosphere of Mars after surface release, Geophys. Res. Lett., 43, 1868-1875, doi:10.1002/2015gl067443. Weiss, B. P., L. E. Fong, H. Vali, E. A. Lima, and F. J. Baudenbacher (2008), Paleointensity of the ancient Martian magnetic field, Geophys. Res. Lett., 35, doi:Artn L23207
10.1029/2008gl035585.
Weiss, B. P., D. L. Shuster, and S. T. Stewart (2002), Temperatures on Mars from 40Ar/39Ar thermochronology of ALH84001, Earth Planet. Sci. Lett., 201, 465-472, doi:10.1016/s0012-821x(02)00729-x.
C h a p t e r 2
MINERALOGY AND STRATIGRAPHY OF THE GALE CRATER RIM,
WALL, AND FLOOR UNITS
Buz, J., B. L. Ehlmann, L. Pan, and J. P. Grotzinger (2017), Mineralogy and stratigraphy of the Gale crater rim, wall, and floor units, J. Geophys. Res. Planets, 122, 1090–1118, doi:10.1002/2016JE005163.
Abstract
9 1.0 Introduction
The Mars Science Laboratory (MSL) was sent to Gale crater with a goal of assessing past habitability in the region. Gale crater was selected primarily because of a large interior central mound, Aeolis Mons, informally known as Mt. Sharp, made of roughly flat-lying strata which may preserve evidence for sequential changes in the Martian environment [Grotzinger et al., 2012]. Previous remote sensing studies of Gale crater have focused on the formation of Mt. Sharp by exploring its geomorphology, thermophysical properties, and mineralogy [Malin and Edgett, 2000;
Pelkey and Jakosky, 2002; Pelkey et al., 2004; Rogers and Bandfield, 2009; Anderson and Bell, 2010; Milliken et al., 2010; Thomson et al., 2011; Grotzinger et al., 2012; Fraeman et al., 2013; Kite et al., 2013a; Kite et al., 2013b; Le Deit et al., 2013; Wray, 2013; Milliken et al., 2014; Fraeman et al., 2016]. In these
works, a wide range of hypotheses have been proposed to explain the Mt. Sharp sedimentary rocks, including formation by deposition in a lacustrine environment, aeolian deposition, fluvial deposition, ice-mediated air fall deposition, ash fall, or some combination of these processes. Curiosity rover data so far support only fluvial, deltaic, lacustrine, and aeolian modes of deposition for basal Mt. Sharp strata of the Bradbury group, interfingering Murray formation, and unconformably overlying Stimson formation [Grotzinger et al., 2014; Grotzinger et al., 2015;
Banham et al., 2016]. During the first four years of its mission, Curiosity traversed the northern
Gale floor deposits of the Bradbury group and subsequently began its ascent through strata of the underlying Mt. Sharp group [Grotzinger et al., 2014; Grotzinger et al., 2015]. Measurements taken by MSL have thus far shown that the float rocks and strata present on the floor of Gale crater host an unexpectedly wide range of lithologic compositions, including clasts of alkaline basalt and felsic igneous float rocks in strata of the Bradbury group, basaltic mudstones with Fe/Mg phyllosilicates at Yellowknife Bay, and K-feldspar-enriched sandstone at the Kimberley [Bish et
al., 2013; Blake et al., 2013; Stolper et al., 2013; McLennan et al., 2014; Sautter et al., 2014; Schmidt et al., 2014; Vaniman et al., 2014; Treiman et al., 2016]. A key question centers around the source of
this lithologic diversity: is it related to the bedrock of the Gale crater walls and surrounding watershed? A product of sediment sorting and chemical alteration within the crater? Or sourced from ash fall or another unknown regionally widespread geologic process?
This study builds on previous work within and around Gale crater, focusing on the wall, rim, and floor units of Gale crater. The goal is to elucidate the relationships between the bedrock materials of the wall, rim, and floor with sedimentary units traversed over and analyzed by the MSL Curiosity rover. We seek to determine the provenance for some of the unique mineralogical detections made by MSL, the relative order in which materials were deposited in Gale crater, and how they might have been altered since or during transport, as recorded in the sedimentary rocks on the floor as seen from orbit. We first provide some background on the geology, mineralogy, and chemistry of the study region. We then describe previously and newly reported detections of minerals within the Gale rim, wall, and floor rock; report the results of geologic mapping of floor units extending from the rim to the Murray formation; and summarize the observed stratigraphy of sedimentary fill in Gale crater with a focus on how the observed mineralogy and morphology of units results from changes in the paleoenvironment. Finally, we describe the implications for the source rocks and how they might have changed during transport, deposition, and as part of a changing environment within Gale, as told by the mineralogy.
2.0 Geologic context
Le Deit et al., 2013]. Reconstruction of the bedrock stratigraphy and dating by crater counting
places the formation age of Mt. Sharp soon after formation of the crater [Thomson et al., 2011;
Grant et al., 2014; Palucis et al., 2016]. High resolution imagery and spectroscopic data in the last
decade have allowed further characterization of the Mt. Sharp group, which comprise the lowermost exposed units of Mt. Sharp [Grotzinger et al., 2015]. Orbital observations of this interval of strata reveal iron smectite clays, iron oxides, silica, and strong hydration signatures with distinctive strata bearing mono- and polyhydrated sulfates [Pelkey et al., 2004; Milliken et al., 2010; Thomson et al., 2011; Fraeman et al., 2013; Le Deit et al., 2013; Fraeman et al., 2016]. Additionally, numerous valleys and canyons have been identified that incise the Mt. Sharp group strata [e.g., Anderson and Bell, 2010; Milliken et al., 2014; Palucis et al., 2016]. The presence of hydrated minerals decreases while dust cover increases with elevation on the mound [Pelkey et
al., 2004; Le Deit et al., 2013]. Nevertheless, boxwork structures indicating subsurface fluid flow
and diagenesis are found at higher elevations [Siebach and Grotzinger, 2014], just beneath the unconformity that marks the top of the Mt. Sharp group [Grotzinger et al., 2015].
Measurements taken by MSL thus far have revealed diverse chemistry and mineralogy of float rocks and exposed bedrock in the Bradbury group, the stratigraphically oldest unit explored by Curiosity [Bish et al., 2013; Blake et al., 2013; Stolper et al., 2013; Sautter et al., 2014;
Schmidt et al., 2014; Thompson et al., 2015; Treiman et al., 2016]. The Bradbury group includes alluvial
fan facies and inferred sediment transport directions that indicate derivation from the northern crater wall and rim [Williams et al., 2013; Grotzinger et al., 2014; Grotzinger et al., 2015; Szabo et al., 2015]. Some of float rocks and conglomerate clasts have high alkalinity and/or abundant feldspars [Stolper et al., 2013; Sautter et al., 2014], which have not been observed from orbit. Additionally, there is high chemical variability locally within the Bradbury, such as between the Sheepbed mudstone and the Gillespie sandstone members of the Yellowknife Bay formation, which both also differ from the Bradbury rise rocks, just ~400 m away [McLennan et al., 2014;
Vaniman et al., 2014]. The Sheepbed and Gillespie bulk chemistry is subalkaline basaltic, and they
did not have the high feldspar composition of some Bradbury rise rocks [McLennan et al., 2014]. The Kimberley formation, which represents the middle part of the Bradbury group, is highly potassic, containing approximately 21% alkali feldspar by volume [Treiman et al., 2016]. It is hypothesized that the Kimberley formation results from the transport and mixing of sediments from two or three distinct igneous sources, perhaps from the northern Gale rim [Treiman et al., 2016; Siebach et al., 2017]. The overall diversity within the Bradbury group and the inferred diversity of its source rocks was surprising, given that orbital data of units near Gale crater showed broadly similar basaltic compositions to those near the Gusev landing site in thermal infrared and gamma ray spectrometer data [Rogers and Christensen, 2007; Taylor et al., 2010].
The regional mineralogy and chronology have been studied for the greater Gale watershed. Gale crater is at the northeast terminal extent of the Gale-Knobel-Sharp (GKS) watershed system which initiates north of Herschel crater [Ehlmann and Buz, 2015]. Large scale fluvial activity last occurred in the late Noachian/early Hesperian [Irwin et al., 2005; Fassett and
Head, 2008], and subsequently became increasingly more localized in the late Hesperian/early
11 salts found by the rover in Gale crater [Vaniman et al., 2014; Ehlmann and Buz, 2015]. Fe/Mg phyllosilicates, kaolin-family minerals, hydrated silica, and other hydrated/hydroxylated phases were detected regionally in a variety of locations including fluvial valley walls and crater rims and floors [Wray, 2013; Carter et al., 2015; Ehlmann and Buz, 2015]. What is not clear is whether some of the materials that may have contributed to the accumulation of Mt. Sharp strata were derived from long-distances in the GKS watershed vs. locally within the immediate surroundings of Gale crater, including from the northern rim, the presumed source for much of the Bradbury group. We thus use remote sensing data to examine in greater detail the Gale crater basement rocks and northwestern floor rocks near the MSL landing site.
3.0 Methods 3.1 Mineralogy
Because we are interested in the basement bedrock and overlying floor deposits of Gale, we focused our data analysis on scenes along the Gale rim, wall, and floor, including scenes where erosion or small craters have exposed the stratigraphy of floor units. We did not analyze data over Mt. Sharp as prior works have described its mineralogy [e.g., Milliken et al., 2010; Fraeman et al., 2016]. Full and half resolution targeted images from the Compact Reconnaissance Imaging Spectrometer for Mars (CRISM) onboard the Mars Reconnaissance Orbiter (MRO) were examined. CRISM is a push-broom imaging spectrometer which acquires data between 0.36-3.92 µm sampled at ~6.55 nm/channel [Murchie et al., 2007]. At highest spatial resolution CRISM is capable of resolving 15-19 m/pixel. The wavelength range and spectral resolution of CRISM allow for detection of many minerals via diagnostic absorptions including those related to electronic transitions in iron and vibrations associated with H2O, CO3, and
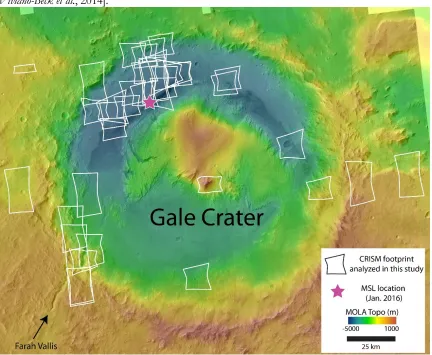
metal-OH bonds [e.g., Clark et al. [1990]]. In total, 34 targeted images along the rim, wall, and floor of Gale crater were analyzed in this study (Figure 1). Reduced spatial and spectral resolution “mapping” products are also available from CRISM. These were used in regions where targeted CRISM scenes were not available; however, due to their lower spectral and spatial resolution and the relatively small exposures of non-dusted-covered bedrock, no additional mineral identifications were found using the mapping products.
acquired, absorption positions were determined using the calibrated data record (CDR) wavelengths of the center pixel of each region of interest so as to properly account for the spectral smile of the CRISM instrument [Murchie et al., 2009]. Many unit identifications were also made through the aid of standard spectral parameter maps [Pelkey et al., 2007; Wiseman et al., 2010;
Viviano-Beck et al., 2014].
Figure 1: CRISM images analyzed in this study on a CTX mosaic with MOLA topography overlain. There is continuous CRISM coverage over the MSL landing site and traverse regions, but CRISM coverage over the remainder of Gale crater is sparser. Our study focused on all full- and half-resolution, long-wavelength CRISM scenes acquired over the walls, floor, central peak, and smaller craters within Gale (white outlines), which have the potential to reveal mineralogy of the bedrock and floor units. Those where discrete minerals were identified, enhanced above the basaltic background, are shown in Figure 2.
Data from the Thermal Emission Imaging System (THEMIS) instrument on the Mars Odyssey orbiter were also used to examine the composition of the Gale rim. THEMIS contains eight detectors within the 6.8 to 13.6 µm region and captures images at a spatial resolution of approximately 100 m/pixel [Christensen et al., 2004]. CRISM is not capable of distinguishing iron-free high-Si silicates because the characteristic vibrations from the SiO2 molecule occur at longer
[image:20.612.110.542.146.501.2]13 regions with different silicate compositions, which may be particularly mafic or felsic, we computed decorrelation stretches (DCS) using THEMIS data following Christensen [2005]. DCS enhances color separation and helps identify specific geologic units which appear as different colors correlated with different surface properties in the DCS product. A DCS stretch with THEMIS Bands 8, 7, and 5 (R, G, B, respectively) aids in discrimination of Thermal Emission Spectrometer Type 1 and 2 surfaces [Bandfield et al., 2000] and has been used to identify mafic materials which appear pink/magenta [e.g., Rogers et al., 2005; Rogers and Fergason, 2011] and chloride-bearing materials which appear blue [e.g., Osterloo et al., 2010]. DCS stretch 6/4/2 can highlight regions containing high bulk silica [Bandfield et al., 2013] in magenta colors and can also indicate differences in surface roughness and gray body emissivity [Bandfield, 2009].
3.2 Stratigraphy and geologic mapping
Following the identification of mineralogical/compositional units, we examined the morphology of exposures and mapped the distinct compositions identified to surface morphology, delineated using high resolution image data. For mapping and stratigraphic studies we used imagery from the Context Camera (CTX) [Malin et al., 2007] and High Resolution Imaging Science Experiment (HiRISE) [McEwen et al., 2007] instruments, both on MRO. We constructed a full coverage CTX mosaic over the Gale region, using images acquired in greyscale visible at a resolution of ~6 m/pixel and in swaths ~30-km wide. At select locations, HiRISE data were available with a resolution ~30 cm/pixel in ~6-km wide long swaths. We also incorporated topographic data from the Mars Orbiter Laser Altimeter (MOLA) instrument and CTX and HiRISE stereo pairs, including red-blue anaglyphs and processed digital elevation models (DEMs), either made as part of this study (using the Ames stereo pipeline) or available as HiRISE team products. We traced unit boundaries where differences in color, albedo, morphology, and texture were apparent. For example, dark, cliff forming units with high crater retention were separated from light-toned hummocky units with few craters. We were sometimes also able to distinguish geologic units based on differences in mineralogy seen with CRISM observations, e.g., phyllosilicate-bearing units versus spectrally bland units.
4.0 Results
In the subsequent section, we describe the minerals detected on the rim, wall and floor of Gale with CRISM and THEMIS (Section 4.1). Section 4.2 gives the context for each detection including the location and material type for each unit (e.g., crater ejecta, bedrock, valley wall). Section 4.3 details the results of geologic mapping, describing the discrete units on the NW crater floor (near the MSL rover) and the stratigraphy determined from topographic data and via direct observations of layering observed in a crater on the Gale floor.
4.1 Mineral detections
4.1.1 CRISM
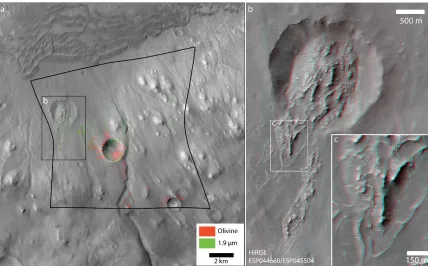
Figure 2: Mafic and hydrated/hydroxylated minerals discovered on the walls and floor of Gale crater. Regions where absorption features are detected in CRISM images are outlined atop the CTX mosaic. Although CRISM coverage of Gale is extensive (Figure 1), the outlined scenes are the only scenes in which mineral absorptions were found above background. Olivine is indicated by an absorption centered near 1 µm. Other minerals range in hydration state, some only exhibiting an H2O- absorption at 1.9 µm (hydrated, green), others exhibiting metal-OH vibrational features at 2.3 and/or 1.4 µm (hydroxylated, blue), and some showing all three absorptions. Hydrated materials with a 2.48 µm absorption were found east of Gale (yellow). Some of the layers within Mt. Sharp also contain hydrated minerals; one example is the units within CRISM scene 58A3.
We observed broad 1-µm absorptions in several locations in the rim and wall rocks, with band centers and widths indicative of the presence of olivine (Figure 3). The broad 1-µm absorption of olivine is the result of three overlapping electronic transition absorptions, which change systematically in position and/or strength with iron content and grain size [Sunshine and
Pieters, 1998]. Olivine is detected in the rim bedrock in a small knob in C95A on the western wall
15 absorptions, associated with the southern rim of Gale [Anderson and Bell, 2010], the broad 2-µm feature characteristic of pyroxenes is absent or weak in both ratioed and unratioed CRISM scenes of the Gale rim. This is consistent with work in the greater Gale region where olivine is the dominant mafic signature with pyroxene accompanying it in some but not all CRISM scenes [Ehlmann and Buz, 2015]. An exception to the lack of pyroxene is within sand dunes on the Gale crater floor, where pyroxene absorptions are variably strong, consistent with previous studies [Lane and Christensen, 2013; Seelos et al., 2014; Lapotre et al., 2017]; however, we do not focus on the dunes in this study.
[image:23.612.109.537.183.591.2]Absorption features associated with hydrated and hydroxylated minerals are relatively widespread, detected in nine localities (Figures 2, 4). The phase detected is most commonly Fe/Mg phyllosilicate, though not all OH/H2O-bearing minerals detected are Fe/Mg
phyllosilicates. Some locations examined exhibit absorptions from both hydration and hydroxylation, consistent with Fe/Mg smectite clays. Other locations only exhibit absorptions associated with metal-OH vibrations (near ~2.3 µm and ~1.4 µm); still other locations only exhibit 1.9-µm vibrational absorptions due to the H2O molecule in the mineral structure (Figure
4). In the 1.4 µm range both H2O and metal-OH absorptions can co-occur. The exact
wavelengths of the absorptions are determined by the metal octahedral cations present in the mineral, which can be detected and discriminated in Martian spectra of Fe/Mg phyllosilicate-bearing terrains [Bishop et al., 2002; Bishop et al., 2008; Ehlmann et al., 2009; Michalski et al., 2015], including within the Gale region. CRISM spectra examined show that most Fe/Mg phyllosilicates identified by the ~2.3-µm absorption and detected on the rim, wall, and floor of Gale are spectrally distinct from the stratigraphic layer containing nontronite in Mt. Sharp identified by Milliken et al. [2014], as previously reported for a few select locales [Ehlmann and
Buz, 2015]. The Mt. Sharp spectra are most similar to Al-substituted nontronite due to the
absorption shoulder at ~2.24 µm, an Al,Fe-OH vibration [Milliken et al., 2010]. None of the wall, rim, or floor detections have such a pronounced shoulder, although some may have a subtle signature at this wavelength such as scenes 2456A and 21D9C (Figure 4). Many of the detections with metal-OH absorptions present have a 2.3-µm absorption which lies intermediate to the band centers observed for Fe and Mg smectites (Figure 4c; see also section 5.1).
On the eastern rim of Gale crater and nearby bedrock exposures, two CRISM scenes reveal a new discovery: H2O-bearing materials with strong 1.9-µm absorptions and which
sometimes possess a broad absorption at ~2.48 µm (Figure 5). The strength of the 2.48-µm feature typically decreases when the strength of the 1.9-µm feature increases. The relative strengths of the 2.48 µm and 1.9 µm features vary within the scenes. The 2.48-µm absorption is not characteristic of one mineral in particular but may be due to H2O in a mineral structure [e.g.,
[Clark et al., 1990]]. We compared the CRISM spectra to a number of sulfate, zeolite, and akaganeite spectra because these minerals all have absorptions in this wavelength range. Akaganeite has been detected in nearby Sharp crater to the west [Carter et al., 2015] while mono- and poly-hydrated sulfates have been detected in Gale crater sedimentary rocks visited by Curiosity (though in low bulk abundance, e.g., Vaniman et al. [2014]) and within the Mt. Sharp group from orbit [Milliken et al., 2010; Fraeman et al., 2016].The wavelength position observed is most similar to bassanite, CaSO4·0.5H2O, though the band centers in the 1.9 µm and 2.4 µm
17
Figure 4: A) CRISM mineral detections compared to library spectra from Clark et al. [2007]. Some noise-removal code processed spectra of hydrated/hydroxylated materials only exhibit the H2O absorption at 1.9 µm (red), while others exhibit only hydroxylation absorptions at 1.4
[image:25.612.116.538.90.633.2]CRISM spectra are extracted from ancillary data so as to account for the detector dependent spectral smile. B and C) The CRISM spectra are compared to library spectra of phyllosilicate minerals after applying a linear continuum removal over the absorption. The 1.4 and 2.3 µm band positions vary according to the metal ions present in the mineral. Interestingly, absorptions in materials from the wall and rim rocks are typically at longer wavelengths than Mt. Sharp nontronite spectra or library nontronite spectra. Additionally, the 58A3 spectrum from Mt. Sharp also shows a shoulder near 2.24 µm characteristic of Fe,Al-OH which is not present in most spectra from other locations within Gale.
[image:26.612.110.534.207.575.2]19 µm region shows the absorption is not uniquely characteristic of one single mineral when compared to library spectra.
The characteristic 2.2 µm feature of hydrated silica or Al-phyllosilicates has been found elsewhere on the Gale crater floor [Seelos et al., 2014], in the Murray formation [Milliken et al., 2010; Fraeman et al., 2016], and in the watershed [Ehlmann and Buz, 2015]. Its presence in the analyzed scenes in this study is rare to absent; some scenes (2456A and 1791F) may show it subtly at about the level of noise in the data (Figure 4).
Overall, the Gale rim, wall, and floor has mineralogy similar to what has been detected in the greater Gale region [Ehlmann and Buz, 2015]. It appears predominantly mafic with the presence of Fe/Mg phyllosilicates. The phyllosilicate absorptions detections are similar between the walls and floor but distinct from Mt. Sharp [Milliken et al., 2010]. Hydrated minerals, possibly similar to sulfates detected within Mt. Sharp [Fraeman et al., 2016], may also be present on the eastern Gale rim. No other hydrated/hydroxylated phases were identified, and iron-bearing feldspar is not found in the CRISM data.
4.1.2 THEMIS
The THEMIS DCS technique did not highlight large regions of distinctive silicate
composition on the Gale rim or wall (Figure 6), e.g., from lithologies significantly enriched in feldspars. The most pronounced units in the DCS mosaics are of the active sand dunes, which in both stretch combinations show their enhancement in mafic phases, an expected result based on prior study (e.g., Lane & Christensen [2013]). “Ghosting”, an effect caused by band-dependent contributions from stray light in the detector combined with small-scale surface temperature differences, was also present in the scenes, in particular along the Gale rim [Bandfield
et al., 2004]. Ghosting appears as color variation within the DCS, down-track from features with
temperature variability. The 8/7/5 DCS did, however, reveal small pink regions on the Gale rim and floor with potential olivine (Figure 6). Some of these regions corresponded to regions previously identified to have broad 1 µm absorptions through low resolution CRISM mapping products but are not yet covered by CRISM targeted images.
4.2 Geologic settings of mineral detections
Here we describe the morphologic characteristics of areas in which the spectroscopic detections are made, as seen in HiRISE and CTX data in order to determine the setting of each detection and describe their occurrence/extent.
4.2.1 Southern Gale wall
21 Figure 6: THEMIS DCS mosaics over the study area. A) Mosaic of DCS 6/4/2 (R/G/B) which highlights the sand dunes at the base of Mt. Sharp in cyan. The majority of the scene is red/pink and the rim and wall do not demonstrate significant heterogeneity aside from ghosting artifacts. B) Mosaic of DCS 8/7/5. Magenta/pink hues on part of the crater floor may indicate mafic mineralogies. The basaltic sand dunes are highlighted most prominently (indicated by arrows). Subtle pink regions (circled) in the rim correspond to a broad 1 µm absorption in CRISM mapping products.
Figure 7: A) CRISM scene B5A3 images the southern wall of Gale crater. This wall is gently sloping, compared to the northern wall, which could mean that the Gale basement rocks in the crater rim are mantled by newer material. Olivine signatures are present in much of the scene; areas with the strongest absorptions highlighted in red. Additional absorptions due to H2O in minerals are present in the vicinity of the central small crater in this scene as well as within a landslide deposit. These hydrated materials are not associated with the channel dissecting the scene. B) A landslide enters and partially fills a small crater in the northwest of this scene. C) Zoom in of the landslide’s sharp ridges which are well correlated with 1.9-µm, H2O absorptions in CRISM data.
4.2.2 Southwestern rim-incised valley (Farah Vallis)
A >40-km long valley incises the southwestern Gale rim and is known as Farah Vallis. Two CRISM scenes at the lower terminus, 2456A and 21D9C, exhibit abundant olivine and Fe/Mg phyllosilicate signatures (Figure 8). HiRISE imagery in this area shows that the margins of the valley are dark, rough-textured, and have signs of active modification such as boulder trails. Olivine-related, 1-µm absorptions are strongest along the steep valley rim in light-toned material (Figure 8b), while Fe/Mg phyllosilicates are found immediately below in dark, more recessive material. A ~1-km crater has impacted along the slopes of Farah Vallis (Figure 8c). This crater, has particularly strong absorptions due to Fe/Mg phyllosilicate in the rim and walls. A portion of the rim of this small crater appears to have slumped downhill (Figure 8c). Spectra shown in Figure 4 indicate the possible presence also of an Al-OH absorption near ~2.2 µm, characteristic of Al-phyllosilicates like kaolinite and montmorillonite that are either spatially or intimately mixed within the CRISM pixels over the Fe/Mg phyllosilicate; the Al-OH absorption is very subtle, at about the level of the noise, if indeed present.
4.2.3 Western Gale wall
CRISM half resolution image 9D8A was acquired over the lower portion of the western Gale wall (see Figure 9; Figure 1 for MOLA topography). The northeastern corner of the scene includes olivine-bearing sand dunes. Small detections (several pixels) of altered olivine and phyllosilicate material are made along the tops of small knobs along the lower wall (Figure 9b). HiRISE scene PSP007211 shows that these detections occur on the roughest material, exposed where occasional ~1m boulders are present (Figure 9c).
4.2.4 Northwestern Gale wall and floor
A ~5 km crater has impacted the approximate boundary between the Gale wall and floor. The majority of this crater and its ejecta blanket are captured in CRISM scene 1791F (Figure 10). There is heterogeneous exposure of olivine and Fe/Mg phyllosilicate-bearing materials in the crater ejecta and in its walls. The relative strengths of the H2O and metal-OH bands are
variable within the scene (two spectra, Figure 4). Although olivine is patchily found throughout the ejecta blanket, one particular southeast-extending streamer has an especially pronounced spectral signature.
Half resolution CRISM scene 28B4 captures part of the northwestern Gale floor and samples crater ejecta, sand dunes, inverted channels, and several stratigraphic units. The small exposure of ejecta is the distal extent of the crater ejecta in 1791F and does not display any spectral features in this CRISM scene. The inverted channels are inferred from their long, and branching nature seen in HiRISE/CTX and terminate in similar long and branching depressions. These channels are also spectrally bland. The sand dunes are enriched in olivine and pyroxene but are not further studied.
Figure 8: A) Farah Vallis dissects Gale crater from the southwest. Fe/Mg phyllosilicates are found in the plateaus around the valley as well as in a small nearby crater. A distinct, bearing unit overlies the phyllosilicates. Although in some regions of the channel, the olivine-bearing material is found coming down the channel walls, it appears to be stratigraphically above the phyllosilicates. A landslide is found to the east of the small phyllosilicate bearing crater. B) The channel walls are freshly exposed as evidenced by the rough textures observed, their low albedo, and boulder trails. C) A HiRISE anaglyph (must be viewed in N-up orientation) of the small phyllosilicate-bearing crater shows that part of the crater wall appears to have slumped downhill and that the impacted material may be susceptible to mass wasting events.
[image:32.612.109.540.217.587.2]25
[image:33.612.108.541.81.566.2]2014]. B) High resolution imagery is available of the crater ejecta. Phyllosilicates and olivine are detected patchily in the crater wall and in ridges of ejecta. C) The strongest mafic signatures appear to be correlated with dark, rough patches of material in the crater ejecta.
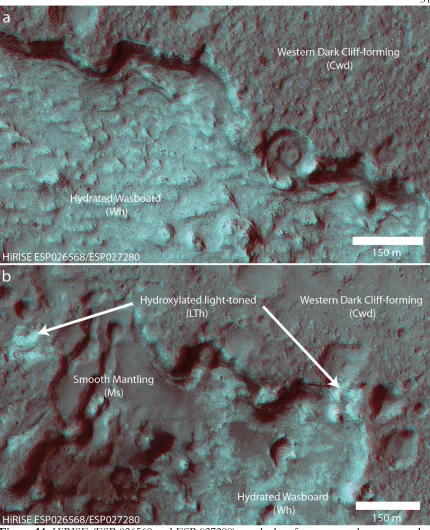
correlation with CRISM indicates that although the hummocky topography extends further, the hydroxylation is limited to a region which also bears polygonal fractures. The light toned material is exposed to the west of the dark cliff-forming material and appears recessive and has limited exposure: it is only visible within depressions and as a layer between more competent units. The CRISM hydroxylation associated with it is similarly limited to a small area: multiple patches of several pixels each. The texture and morphology of these hydroxylated units are further discussed and imaged in Section 4.3.2. The two hydroxylated units have absorption band positions at a similar wavelength in the 2.3 µm region, but the absorption positions vary slightly in the 1.4 µm region; the 1.9-µm H2O absorption is weak to absent in both (Figure 4, ‘28B4
(west)’ from the light-toned material and ‘28B4 (east)’ from the polygonally fractured material). These units also have absorptions in similar position to the phyllosilicates in scenes 2456A and 9D8A (described in Section 4.2.2-3) though are missing the water absorption at 1.9-µm. The ridged material, more extensively covered in scene 24077, was previously studied by Milliken et al. [2014] and found to be of possible aeolian origin, inferred based on the “washboard” appearance of regularly spaced ridges, which may record large-scale cross-stratification. The ridged material also contains Fe/Mg phyllosilicates, perhaps formed by diagenesis [Milliken et al., 2014], is spectrally distinct from the two hydroxylated units, and has polygonal fracturing on the meter-scale.
4.2.5 Eastern Gale
A channel which originates from farther east breaches the eastern Gale rim (Figure 11). The north facing walls of this channel and of other nearby knobs host the hydrated material with a broad 2.48-µm absorption. These materials are not found in the debris or channel floors. HiRISE imagery indicates that some of the material is associated with boulders but otherwise the host units are not clearly defined.
4.3 Geologic mapping and stratigraphy of NW Gale crater floor
Geologic mapping of the floor of the northwestern part of Gale crater using mineralogy and morphology reveals several orbitally-defined units, which we relate to stratigraphic units that have been identified by the Curiosity rover team (Figure 12), and units identified on the walls and rim of Gale. Some of the northwest Gale floor has not been mapped due to it being dusty, debris-covered, and/or spectrally bland. Collectively, the surfaces and units mapped, excluding the crater-exposed stratigraphy and mass wasting surfaces, span a ~150 m elevation range observed in MOLA data (Figure 13). The mapped areas are categorized as either geomorphic surfaces or geologic units. Surfaces, described in section 4.3.1, refer to regions which have distinct boundaries (can be traced) but which do not have any stratigraphic/paleoenvironmental information (e.g., crater ejecta). Geologic units, described in section 4.3.2, refer to regions with distinct composition (from CRISM) or appearance, which may be the result of a different formation environment when compared with their surroundings (e.g., hydrated thinly layered deposits vs. spectrally bland massive exposures).
27 layers observed in the crater walls and attempt to correlate it with some of the mapped floor units in section 4.3.3.
Figure 11 A) The H2O and 2.48-µm absorption features in AB3A and BFF1 are present along
Figure 12 Geologic Map of the NW Gale floor (Top) Using imagery and mineralogical detections, we constructed a geologic map in NW Gale mapping surface landforms and geologic units. The compositional differences seen in CRISM correspond to morphological differences seen in CTX and HiRISE. The boundary for mapping done in Grotzinger [Grotzinger et al., 2014;
Grotzinger et al., 2015] is indicated by the dashed line. By extending the geologic units drawn in
29
Figure 13: A) A topographic profile crossing many of the floor units near Mt. Sharp. B and C) Topographic profiles of the rim-to-crater floor transition show the generally flat nature of the Gale floor which may indicate significant sediment fill. The crater profiled in C demonstrates that the ejecta from this crater likely excavates both wall and floor materials.
4.3.1 Surfaces and landforms
competent material seen in CRISM scene 28B4 (section 4.2.4), mapped as Western Dark Cliff-forming unit (Cwd, further described later). A series of inverted channels (Chi) can be traced from near the base of the Northern Gale rim. These channels are oriented approximately in a north-south direction. The inverted channels terminate in broader channel depressions (Chd) within Cwd.
4.3.2 Geologic units
Over a dozen distinct sedimentary rock units were identified on the northwestern Gale floor. The mapping of the “washboard” unit (Wh) follows that of Milliken et al. [2010] (Figure 14). Mapping of the Murray formation follows that of Fraeman et al. [2016] and Grotzinger et al. [2015]. The remaining units are newly delineated in this work.
Multiple spectrally bland, competent, heavily cratered, resistant bedrock units were identified with distinctive morphologies that distinguish them from one another. These units are named after their cliff-forming attribute: Western Dark forming (Cwd), Pock-marked Cliff-forming (Cpm), and Eastern Dark Cliff-Cliff-forming (Ced). The cliff-Cliff-forming units mapped, Cpm and Ced, correspond well with previous mapping done by the MSL team of the “Rugged Terrain” and “Cratered Surface” units, respectively [Grotzinger et al., 2014]. While the Cpm pock-marked unit is somewhat localized, the Ced eastern dark unit is more extensively exposed and extends south and eastward toward the lower Mt. Sharp units being explored by Curiosity, including the Murray formation. The Cwd western dark unit is particularly well-defined due to its low albedo in comparison with the surrounding units (Figure 14). The thickness of this unit is approximately 20 m at its southwestern extent, based on the height of the cliff as computed from a HiRISE DEM and assuming horizontal emplacement. Two smaller cliff-forming units, characterized by their smooth appearance and light and medium albedos (Csl and Csm, respectively), are found in the south of the mapping area and are characterized by appearing similarly competent and spectrally bland. The majority of these two units, however, are covered in sand dunes.
A hummocky terrain unit is identifiable between the eastern and western cliff-forming units. Within this terrain there are three subregions, discriminated by texture: Smoother Hummocky (Hs), Rougher Hummocky (Hr) and Polygonally-fractured hydroxylated Hummocky (Hph). The polygonally-fractured unit (Hph) is characterized by a distinct, smaller scale texture of polygonal fractures, each approximately a few meters wide (Figure 15). The polygonal fracturing is coincident with spectral signatures of hydroxylation in CRISM data (scene 28B4, Section 4.2.4). The rougher and smoother hummocky units are distinguished based on the size and the frequency of the hills found within them. The differences between the subregions of this hummocky terrain may represent lateral variations within the unit or post-depositional changes segregated to different elevations.
Two small light-toned units were mapped: the Northern Light Toned (LTn) and the Hydroxylated Light Toned (LTh), the latter exposed in Figure 14. In common between these units is their high albedo and thin, recessive, nature. The hydroxylated light-toned (LTh) unit is so named because the CRISM coverage over it indicates a distinctive signature of hydroxylated minerals discussed in section 4.2.4. Although nearby and at a similar elevation to the polygonally fractured hummocky unit, it is texturally distinct. CRISM coverage over the northern light-toned (LTn) unit does not reveal any distinguishable mineralogy, but this may be due to dust cover.
31
33 showing Hph emerging from below Cwd at a topographic high. D) HiRISE anaglyph showing a type section of Hph with several-meter scale polygonal fractures.
washboard (Wh) unit also has metal-OH absorptions at similar wavelengths, but also includes the 1.9-µm water absorption. Interestingly, these spectra have absorptions at similar wavelengths to the phyllosilicates detected in Farah Vallis and on the western Gale wall (CRISM scenes 2456A and 9D8A, respectively).
A mysterious dark depression approximately 3 km across (Figure 16) is almost completely surrounded by the hummocky terrain. Within the depression is a smooth material with a comparatively lower albedo, mapped as Smooth Depression (Ds). At the center of this smooth depression the material is highly polygonally fractured with raised ridges (Figure 16 inset). Additionally, large preserved linear ridges (Lrp) are present within the depression in close proximity to the fractures. These linear ridges are distinct from the polygonal ridges as they are in sets of parallel clusters (i.e., do not intersect). The stratigraphic relationship between this depression, the linear ridges and the hummocky terrain is not clear from the data available, i.e., whether the ridges only exist within the depression or whether they are in an underlying unit that crops out only in the depression.
Figure 16 HiRISE anaglyph of the bottom of a smooth depression (Ds) on the Gale floor. Along the edges of the depression raised polygonal (inset) ridges and preserved linear ridges (Lrp) are present.
4.3.3 Exposed stratigraphy
Many of the stratigraphic relationships are hard to determine from orbit due to limits in the image and topographic resolution or because the contacts are obscured by dust, sand, or other units. However, a combination of image datasets and topography have allowed us to determine some of the stratigraphic relationships.


![Figure 4: A) CRISM mineral detections compared to library spectra from Clark et al. [2007]](https://thumb-us.123doks.com/thumbv2/123dok_us/952110.608396/25.612.116.538.90.633/figure-crism-mineral-detections-compared-library-spectra-clark.webp)