Abstract—Developing computational methods to construct gene networks from time series profiles can help biologists generating and testing hypotheses to investigate the dynamics of complex regulatory systems. To tackle the problem of scalability, we develop a hybrid method by integrating data and knowledge sources for network construction. Our approach includes a dimension reduction procedure to derive data features to calculate data similarity, and a knowledge mapping procedure to measure the semantic similarity between any two genes. A fuzzy gene clustering procedure is then performed. Experiments are conducted to evaluate the presented approach. The results show that our approach can produce meaningful clusters leading to better network construction performance.
Index Terms—fuzzy clustering, time series data, gene network modeling, knowledge ontology
I. INTRODUCTION
he post-genome era sees a trend of adopting a reverse engineering procedure to automatically construct gene networks that can meet the biologists’ need to describe the complex phenomena of gene regulations. However, Inferring gene network from expression data is an under-determined problem. Using time series data alone to derive parameter values of a computational model still cannot provide detailed guidance regarding a biological system. This is mainly because the information of genetic processes contained within the time series is implicit and insufficient to comprehend the complexity of the GRNs [1]. Therefore, researchers advocate using additional structural knowledge to find solutions with biological meaning. It is to collect prior knowledge datasets as precisely as possible, regarding the gene functions, the causal links, and the partial topology of the biological systems (e.g., KEGG [2], CellNetOptimizer [3]). These databases may contain different degrees of data inconsistency due to various experimental settings; nevertheless, they serve as useful resources for providing the structural relationships as a practical guideline in network inference. Therefore, applying qualitative behavior obtained from prior knowledge datasets to network modeling has been considered a complementary strategy to construct the genetic dynamics.
To tackle the scalability problem, researchers have presented several methods that can be classified into two categories. The first category means to develop more comprehensive computational techniques for network
C.-H. Lin, Y.-T. Hsiao and W.-P. Lee are with Department of Information Management, National Sun Yat-sen University, Kaohsiung 80424, Taiwan (e-mail: wplee@ mail.nsysu.edu.tw).
modeling [4]. For example, the inference of a tightly coupled S-system is a large-scale parameter optimization problem. Global optimization methods with enhanced techniques (such as population-based algorithms with stochastic strategies) are better choices in estimating parameters to seek the global optimum for biological systems. However, they are computationally expensive. Meanwhile, some studies proposed to integrate knowledge (extracted from the literature) and computational methods for network inference. It can be performed by defining a set of constraints for the prior domain knowledge to restrict the parameter search, using a combined objective function to take both factors or adopting the prior knowledge to sketch the network structure [5].
The second suite of approaches takes another perspective to infer large-size networks. It involves a decomposition procedure to group genes. Clustering is a practical technique useful for grouping genes. Each gene cluster can be considered a sub-network and inferred separately. Then the inferred sub-networks are assembled. In the studies of gene networks, protein-protein interactions (PPIs) are considered important in tuning and regulating biological processes at the molecular level [6]. Many experiments have been performed to show that proteins from the genes belonging to the same clusters are more likely to interact with each other than proteins from the genes belonging to different clusters. In this regard, it can be expected to cluster genes with high PPIs among them to infer biologically plausible networks.
Considering gene clustering, different types of clustering algorithms can be applied. In performing a gene clustering procedure, the first important step is to define a function to measure the similarity (or dissimilarity) between any two genes. The similarity is often measured from two perspectives: data and knowledge. The way to perform a data- driven measurement is often to extract and select features. Among others, the principal component analysis (PCA) method is a widely used technique to analyze multivariate data to extract important features for dimension reduction. It is a coordinate transformation in which each row in the data matrix is written as a linear sum over basis vectors called principal components (PCs). Only more important PCs are retained to reduce the dimensionality of the data.
The other way to measure gene distance is to equip a domain knowledge mindset and to consider the gene semantic similarity through the biological information contained in genes [7]. Domain knowledge is useful to preserve biological or regulatory functions in gene clusters. Biological knowledge can be obtained from scientific literature or public databases, among which gene ontology (GO) is a most popular and prominent biological knowledge
Identifying High PPI Clusters by Integrating Data
and Knowledge Sources
Chung-Hsun Lin Yu-Ting Hsiao Wei-Po Lee
source. Though GO is a useful method to derive biological similarity between genes, it is notable that appropriate use of functional similarity measures depends on the applications. A given measure can yield good performance for one application but performs poorly for another.
After a large gene set is grouped into several small-size subsets, a modeling procedure can then be applied to reconstruct the network. Many existing methods have provided great insights for gene network modeling. However, present studies have not often used the known gene pathways to infer a network with an adequate gene group size from a large number of genes. Extensive research works have built and reinforced the content of databases regarding the gene functions, causal links, and gene topology over the past decade, for example BioGRID [8], a database stored gene interactions, chemical associations, and post-translational modifications from biomedical publications.
Regarding the data-enriched web databases, this work is inspired by the idea that if a large network can be constructed with an appropriate set of gene-gene interactions via integrating time series data, gene ontology, and the known gene interactions from literature [8], we can adopt the results from an inferred sub-network without further examining the connectivity validity. In detail, to investigate the effect of using gene clustering to assist the construction of large networks, we present a hybrid gene clustering approach that adopts the PCA-based method to calculate data similarity, and the GO-based method to measure the semantic similarity. To verify the presented approach, a series of experiments have been conducted. Most importantly, examples of subnetworks are analyzed and discussed to inspect the quantitative experimental results. The results show that the presented approach can produce clusters with high gene interactions leading to better network construction performance.
II. INTEGRATION OF DATA AND KNOWLEDGE In this study, we present a clustering-based approach with hybrid similarity measurement for inferring large-size networks. Our approach employs a divide-and-conquer strategy. It divides the entire gene set into small strongly correlated subsets of the original data; and then a knowledge base containing currently known interactions and pathways is used to connect the genes within the same cluster to form a sub-network. This approach is extended from our previous work [9], but here we turn to focus on the performance verifications and qualitative analyses of the clustering results.
Our clustering-based method for gene grouping is based on analysis and interpretation of the genes involved. Two methods are adopted: the PCA method to extract data features from the expression profiles; and a knowledge mapping method to derive knowledge features from gene ontology. Euclidean distance measuring method is used to calculate the two types of similarities between gene pairs. The two types of gene similarity are aggregated in the way of weighted summation. Then, a network modeling procedure can be performed on the gene clusters obtained. The following sub- sections briefly describe the major steps.
A. Using Time Expressions to Measure Gene Correlation The first important factor we consider in the procedure of clustering genes is to measure the gene-gene correlations from the time series data. The reason is that in a microarray experiment, gene products with similar genomic expressions may be functionally related and the correlations between genes indirectly correspond to the protein interactions. Microarray data are typically high dimensional and the gene expression could be complicatedly correlated. PCA is an exploratory multivariate statistical technique for simplifying complex data sets; therefore, we adopt this technique to tackle the difficulties associated with the time series data.
In our work, each dataset is considered a data matrix including n gene variables (rows) with m observations (columns). The goal is to reduce the dimensionality of the data matrix by finding r new variables, where r is much less than n. The PCA method constructs linear combinations of gene expressions (i.e., PCs, corresponding to the r variables) that can effectively represent effects of the original measurements. Mathematically, this is equivalent to finding the best low rank approximation of the data via the singular value decomposition where coherent patterns can be detected more clearly. In this way, correlated genes can be projected to the same direction because the data dimension reduction is based solely on gene expression.
The PCA-based dimension reduction approach picks up the dimensions with the largest variances. In the case of reducing dimension for gene expression data, the PCs are linear combinations of thousands of genes. Because PCs are constructed to explain variations, they are difficult to interpret. Consequently, we use the common rule for choosing how many PCs to retain. That is, we keep enough PCs so that the cumulative variance explained by the PCs is larger than a pre-specified threshold. With these PCs retained, the original expression data can be reduced to a lower dimensional subspace. Thus, each data record can be represented as a new feature vector with a smaller data dimension. The Euclidean distance measure is then applied to gene-to-gene similarity calculations.
B. Using Knowledge Ontology to Measure Semantic Similarity
The first method is an information content-based method adopted from Resnik’s algorithm, which has been shown to provide consistently high correlation with sequence similarity and gene co-expression. Resnik’s algorithm is based on information theoretic similarity measures [11]. It investigates how to measure the similarity of two concepts in GO from the information they share, where the shared information is specified by a highly specific concept in the taxonomy that subsumes the two concepts. According to the information theory, in this method the information content of a concept c is defined as -log p(c), where p(c) is the probability of encountering an instance of concept c in GO.
This quantitative characterization of information provides a straight and practical way to measure the semantic similarities of two genes. The similarity measure of two GO terms relies on the information content of the minimum subsume; that is, their lowest common ancestor in the GO hierarchy.
The second method is a topology-based method that mainly concerns with the intrinsic topology of the GO directed acyclic graph [12]. In such an approach, each biological term in the ontology is expected to have a fixed semantic value used for genome annotation, and the semantic value is defined as the biological content of a given term. Wang et al. proposed a graph-based strategy to compute semantic similarity using the topology of the GO graph [12], in which the different semantic contributions of the distinct relations are all taken into account. In Wang’s approach, the gene-gene similarity is computed based on the GO term similarities that annotate the target genes. According to the results shown in [12], this measure performs significantly better than Resnik’s measure on yeast protein functional similarities. However, Wang’s measure ignores both the topological distances among the lowest common ancestors and the statistics of gene annotations, while these factors have been considered in other studies (e.g., [13]).
In this study, the above two GO-based similarity measure methods are both adopted to determine the data distance in the feature space. This measurement is implemented by GOSemSim [14]. It is to evaluate the GO semantic distance between two genes using the gene open reading frame (ORF) ID and to return a value between 0.0-1.0. Though there are some enhanced techniques proposed for GO mapping, we choose to use the original algorithm because our goal is to demonstrate the effectiveness of our integrative approach, rather than to compare the performance of relevant variants.
The above GO semantic similarity measure is mainly to derive protein semantic (or functional) similarity between proteins based on their GO annotations. Because each gene may be annotated by multiple GO terms, it is possible to obtain different similarity values for a pair of genes and here the average value is taken. Moreover, because none of the existing measures account for all aspects of GO, it is hypothesized that integrating multiple measures can improve the performance. Therefore, the semantic measures obtained by the two methods described above are averaged to be the final semantic similarity for each gene pair.
C. Fuzzy Clustering
With the above two types of similarity measures, the
clustering algorithm can be performed in grouping of genes. We adopt and revise the fuzzy c-means algorithm for cluster genes. The operating steps are described below.
Step 1: Randomly choose a number of c genes as the initial cluster centers.
Step 2: For each gene element gj (1≦i≦n), generate µij to be the membership level of belonging to cluster j (1≦j≦c) by the following equation:
c
k
m
k i
j i ij
c g
c g
1
) 1 /( 2
1
In this equation, the parameter m is a fuzzifier that determines the fuzziness of the clusters. The membership level µij, is inversely related to the distance between gene element gi and the cluster center.
Step 3: Calculate the centers of the c clusters by the following equation:
n
i ij n
i i ij
j
g c
1 1
Step 4: Temporarily assign each gene to the closest cluster center. Calculate the PPI rate for each cluster cj obtained by the following equation:
100%
) pairs gene (all of num
) pairs gene ng (interacti of
num
j j
j c
c PPI
As a validation information resource, a knowledge database with all known PPIs is used to measure the number of interacting gene pairs. Taking the average across all c clusters, one may also define the global measure assessing the quality (biological significance) of the whole partition. This step is skipped if no knowledge base is applied. Step 5: Return to Step 2, unless the termination criterion is met (e.g. no improvement is observed or a specified number of iteration has been performed).
In the above procedure, the distance measure is based on the gene-gene similarity. In our hybrid approach, the similarity between any two gene elements is calculated by the combination of gene expression based and gene ontology based measures with two weighting factors.
The performance of gene clustering here is evaluated by PPI rate of the clusters obtained. Here, the PPI rate is defined as the fraction of interacting pairs found among all gene pairs that end up in the same cluster. In this work, the genomic database BioGRID (The Biological General Repository for Interaction Datasets, [8]) aiming to catalogue all known PPIs is used. Here, adopting a knowledge base (Step 4) is an attempt to guide the clustering procedure to derive a set of clusters with high PPIs (though the knowledge base may be inconsistent with the hybrid effect of expression data and GO). It is a direct extension of integrating knowledge in clustering. This step can be ignored if no knowledge is applicable.
D. Building Networks with a Knowledge Resource
Many modeling methods have been developed, in which a network model is first selected and then the corresponding computational techniques are used to infer the model that fits the most to the gene expression profiles. Our main focuses here are on verifying the effectiveness of the presented hybrid measurement and on reconstructing a network with correct topology, rather than on evaluating different inference methods. Therefore, we choose a succinct graph theoretic model in which genes are represented as vertices and the gene interactions as arcs between gene pairs. To reconstruct large networks, we utilize the online database BioGRID to find interactions connecting genes in the clusters. BioGRID is a public database that archives and disseminates gene and protein interaction data for major model organisms and humans. This database is established to help capturing biological interaction data from the primary biomedical literature. BioGRID currently holds over 830,000 interactions derived from over 55,000 publications in the primary literature. It thus provides an important resource for biomedical researchers who study the functions of individual genes and pathways, and for computational biologists who analyze the properties of large biological networks. Here, we retrieve the interactions from BioGRID for the genes in the same clusters and construct the networks accordingly.
III. EXPERIMENTS AND RESULTS A. Datasets
In this experimental study, a real dataset was used to assess the presented approach. As our approach involves semantic mapping of GO terms, the gene nodes included in the dataset are required to be transferred by available tools to retrieve the relevant information. In addition, to validate the networks constructed, there is the need to know the connection information among the nodes. Considering these preconditions, the dataset collected from [15] was used. It described the yeast S. cerevisiae regulatory network with 12 time points and contained 6,601 genes in total. Note that about 10% of the genes could not match the GO terms so we dropped them off in the experimental procedure.
Due to the limits of the publicly available packages on data processing, we randomly sampled four subsets (namely D1~D4, each included 400 genes) from the original dataset, in
which the four 400-gene networks contained 2,645, 3,275, 4,765, 4,055 gene pairs. All the gene-gene interactions were retrieved from the BioGRID database (98,082 directed gene pairs in total).
B. Effects of Data and Knowledge in Clustering and Network Modeling
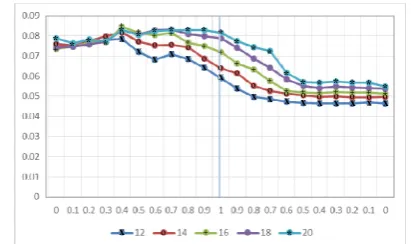
To evaluate the performance of the presented hybrid approach in gene clustering and network modeling, we describe the experimental trials conducted and analyze the results. In the first phase, we investigated the effect of using time series data and domain knowledge for distance measurement in clustering genes. As described in section II.B, the PCA procedure was performed on the time series data contained in the datasets for feature extraction, and then a set of PCs covering 70-90% of original information content (the proportion of variance) was selected. For the four datasets D1-D4, the first two PCs represented over 95% of the
[image:4.595.332.522.110.297.2]variation (the cumulative proportions of variance for the first two PCs are 95.74%, 95.30%, 95.51%, and 95.17%, respectively), and the two PCs truncated 12 time-point features to two variables (as illustrated in Fig. 1).
Fig. 1. The PCA results for different datasets.
In the experiments, the semantic (knowledge) similarity between genes was calculated by GOSemSim. This tool measures the GO semantic distance between two genes using the ORF ID and it returns a value between 0 and 1. The two types of similarities were first obtained, and then combined and used for clustering genes. To investigate the effects of expression data and biological knowledge, we examined different weight combinations in this series of experiments.
As mentioned above, many studies have confirmed that PPIs are important in regulating biological processes, and that the gene co-expression and protein interaction are correlated. In this regard, it is thus expected that clustering genes with high PPIs among them can lead to biologically plausible networks. Therefore, the PPI measurement was taken to evaluate the results. We calculated PPI values for the obtained clusters to evaluate the performance and the results show that the values were relatively high, in contrast to those reported in relevant studies [15]. However, it is notable that the PPI values are tightly related to the gene-gene interactions. Therefore, the PPI values here were calculated to examine the effects of data and knowledge in gene clustering. It is not directly comparable for the results derived from different datasets used in different studies.
In the experiments, 100 trials were conducted for each weight combination, and the PPI values of the trials were averaged over the trials. In addition, the effect of the number of clusters specified in the experimental trials was examined. The results are presented in Fig. 2 (due to the space limitation, only the results for D1 are shown as representative). In this
certain combinations of weights can lead to the best performance.
[image:5.595.64.270.319.441.2]Following the above experiments, we took a different perspective to conduct another set of experiments for contrasting several clustering methods, including our fuzzy clustering algorithm (FC) and three popular methods: the k-means, the hierarchical clustering (HC), and the self-organized map (SOM). In the experiments, the above methods were performed on the dataset, and the online database BioGRID was used as the knowledge resource to guide the clustering process. This strategy meant to generate a selective (or fitting) pressure (by BioGRID) to maximize the computational power of the clustering methods, so that more objective results can be obtained. All four methods had the same input format. In this way, one can observe the efficacy of the PPI values, which provide more gene connections for constituting a cluster. Table 1 depicts the best, the average, and the standard deviation of PPI values among 100 runs for each dataset. The results suggest that KFGC can derive the highest gene interaction pair rate among the four methods.
Fig. 2. PPI values of different weight combinations in clustering.
TABLE 1. Comparisons of the PPI values. The median cluster sizes derived from the fuzzy clustering are 23, 18, 22, 31 in D1-D4.
Method PPI value D1 D2 D3 D4
FC
Best 0.9091 0.9231 0.9429 0.9211
Avg 0.8433 0.8585 0.8050 0.8458
SD 0.0824 0.0540 0.0727 0.0990
k-means
Best 0.5292 0.5498 0.4930 0.4130
Avg 0.2263 0.1884 0.2064 0.2264
SD 0.1143 0.0940 0.1286 0.1189
HC
Best 0.4330 0.5130 0.4830 0.4530
Avg 0.1624 0.1764 0.2254 0.2434
SD 0.1163 0.1246 0.1407 0.1316
SOM
Best 0.4840 0.5698 0.5198 0.4612
Avg 0.2325 0.1794 0.1649 0.1643
SD 0.1727 0.1232 0.1316 0.1030
C. Case Studies and Analyses
In addition to the quantitative experimental results, to verify the results in detail, further examinations and analyses have been made. Fig. 3 presents the gene-gene interactions obtained from the clusters with high PPI values. Since the interactions here are derived from the literature (i.e., BioGRID), the connected relationships in a sub-network are thus useful for researchers to understand the regulatory mechanism. By looking into the graph structure, one can find the hub gene of each cluster in a straight way. For example,
the DSN1 in Fig. 3 (up) (with GO term: chromosome segregation, a step in cell reproduction or division) is an essential component of the multi-protein kinetochore sub-complex, and its protein (DSN1p) promotes the interaction between inner and outer kinetochore regions [16].
[image:5.595.59.277.496.642.2]The illustrated example above indicates that one promising way to study those sub-networks is to focus on the hubs in the clusters and to investigate the related gene connections of interest. On the other hand, we can also scrutinize a set of multi-gene interactions (i.e., a gene pathway) from a cluster. For instance, both gene pairs KAR3-CLB4 and CLB4-TSR3 in Fig. 3 (down) are recorded on the web database. The KAR3-CLB4 gene pair would result in synthetic lethality when combined in the same cell under a certain condition (e.g., one of them mutated) [8], while the LB4-TSR3 pair would severe fitness defect or lethality under a given environment [8]. It is worthwhile to make a case study of in vivo experiments for the pathway KAR3-CLB4-TSR3.
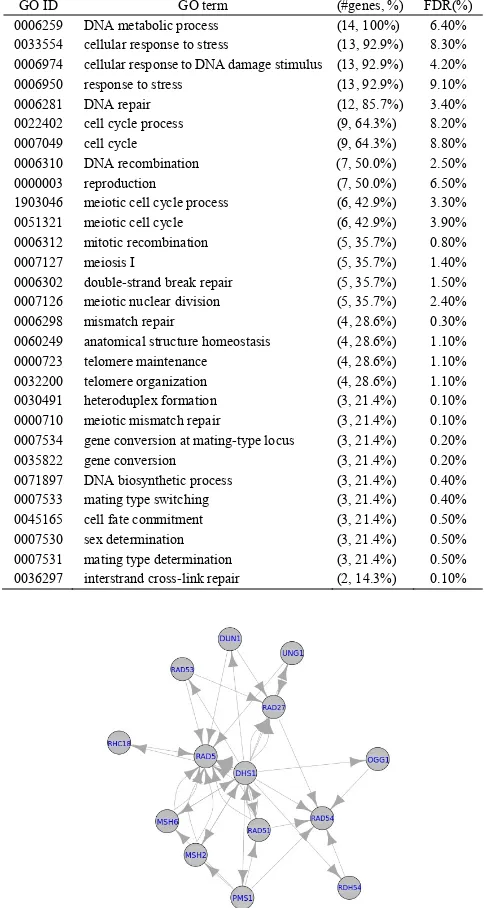
Fig. 3. The interactions derived from the high PPI clusters. Moreover, we take one of the sub-clusters as an example to perform semantic verification. The selected sub-cluster (named yeast-14 herein) consists of 14 genes (RDH54, DUN1, MSH6, RAD51, RAD54, RAD27, RAD5, RHC18, UNG1, OGG1, PMS1, MSH2, DHS1, and RAD53) and the inferred topology is depicted in Fig. 4. The hub of this network is RAD5, which has the most linkages compared to its related genes, followed by RAD27, DHS1, and RAD54. Meanwhile, these genes control over half of the interactions. To investigate the mechanism of yeast-14, we accessed the Saccharomyces Genome database (SGD, http://www.yeast genome.org/) to evaluate the biological meaning (i.e., the correctness of the clustering and reconstruction) of yeast-14. Table 2 shows the result that includes the recognized 30 GO terms among genes. False discovery rate (FDR) for each GO term with corresponding classified genes are also provided. The FDR was calculated by running 50 simulations with random genes, and counting the average number of times for the case with a p-value as good as or better than the case with
x o + *
x x
x x x x x
x x
x x x x x x x x * *
* * *
* *
* * *
* * * * * * *
* * *
* +
+ + +
+ +
+ + +
+
+ + + + + + + +
o o
o o
o o o o o o
a p-value generated from the real data. The closer the p-value (or the corresponding FDR) is to zero, the more significant the particular GO term associated with the group of genes is. As seen, all the FDR values are less than 10%. This shows that a promising cluster group has been built.
TABLE 2. Results evaluated by the Genome database.
GO ID GO term (#genes, %) FDR(%)
0006259 DNA metabolic process (14, 100%) 6.40%
0033554 cellular response to stress (13, 92.9%) 8.30% 0006974 cellular response to DNA damage stimulus (13, 92.9%) 4.20%
0006950 response to stress (13, 92.9%) 9.10%
0006281 DNA repair (12, 85.7%) 3.40%
0022402 cell cycle process (9, 64.3%) 8.20%
0007049 cell cycle (9, 64.3%) 8.80%
0006310 DNA recombination (7, 50.0%) 2.50%
0000003 reproduction (7, 50.0%) 6.50%
1903046 meiotic cell cycle process (6, 42.9%) 3.30%
0051321 meiotic cell cycle (6, 42.9%) 3.90%
0006312 mitotic recombination (5, 35.7%) 0.80%
0007127 meiosis I (5, 35.7%) 1.40%
0006302 double-strand break repair (5, 35.7%) 1.50%
0007126 meiotic nuclear division (5, 35.7%) 2.40%
0006298 mismatch repair (4, 28.6%) 0.30%
0060249 anatomical structure homeostasis (4, 28.6%) 1.10%
0000723 telomere maintenance (4, 28.6%) 1.10%
0032200 telomere organization (4, 28.6%) 1.10%
0030491 heteroduplex formation (3, 21.4%) 0.10%
0000710 meiotic mismatch repair (3, 21.4%) 0.10%
0007534 gene conversion at mating-type locus (3, 21.4%) 0.20%
0035822 gene conversion (3, 21.4%) 0.20%
0071897 DNA biosynthetic process (3, 21.4%) 0.40%
0007533 mating type switching (3, 21.4%) 0.40%
0045165 cell fate commitment (3, 21.4%) 0.50%
0007530 sex determination (3, 21.4%) 0.50%
0007531 mating type determination (3, 21.4%) 0.50%
[image:6.595.47.290.134.588.2]0036297 interstrand cross-link repair (2, 14.3%) 0.10%
Fig. 4. Interactions of the sub-cluster extracted from the dataset.
All of the 14 genes belong to DNA metabolic process. On the one hand, for a widely definition in this cluster, 13 and 12 (see the third column in Table 2) out of the 14 genes are identified as cellular response to DNA damage stimulus and DNA repair, respectively. The analyses and interpretations on this sub-network show that yeast-14 can be regarded as functioning the DNA damage stimulus and DNA repair processes. Looking into the gene interactions (i.e., Fig. 4) and each gene’s corresponding GO terms, we can not only observe the gene relationships in a sub-network, but also refer interactions to several gene functions as well. The approach of integrating data-driven measurement (i.e. time series data) and knowledge-driven measurement (i.e. gene ontology) to construct biological networks is thus confirmed.
IV. CONCLUSIONS AND FUTURE WORK
It has been shown that integrating structural knowledge into expression data can find networks with biological meaning and correct topology. Regarding the data-enriched web databases, this work attempts to reconstruct a large network with an appropriate set of gene-gene interactions via integrating time series data, gene ontology, and the known gene interactions from literature. To tackle the problem of scalability, we have adopted and revised a gene clustering method extended from our previous work, but here we focused on the performance verifications and qualitative analyses of the clustering results. In addition to the quantitative evaluations, examples of subnetworks are analyzed with the available knowledge resources. Moreover, the gene annotation of the subnetwork is examined and the corresponding semantics is evaluated. The results show that incorporating biological knowledge can produce clusters with high gene interactions to structure a biologically meaningful subspace. It means this method can lead to the extraction of useful gene pathways and has the potential for better performance of network reconstruction.
REFERENCES
[1] E. O. Voit, “Biochemical systems theory: A review,” ISRN Biomathematics, 2013, 897658.
[2] H. Ogata, S. Goto, K. Sato, et al., “KEGG: Kyoto encyclopedia of genes and genomes,” Nucleic Acids Research, 27, 29-34, 1999. [3] C. Terfve, T. Cokelaer, D. Henriques, et al., “CellNOptR: A flexible
toolkit to train protein signaling networks to data using multiple logic formalisms,” BMC Systems Biology, 6: 133, 2012.
[4] D. R. Penas, P. González, J. A. Egea, et al., “Parameter estimation in large-scale systems biology models: A parallel and self-adaptive cooperative strategy,” BMC Bioinformatics, 18: 52, 2017.
[5] T. Saithong, S. Bumee, C. Liamwirat, et al., “Analysis and practical guideline of constraint-based Boolean method in genetic network inference,” PLoS One, 7: e30232, 2012.
[6] A. Metz, E. Ciglia, H. Gohlke, “Modulating protein-protein interactions: From structural determinants of binding to druggability prediction to application,” Current Pharmaceutical Design, 18: 4630-4647, 2012.
[7] J. Peng, S. Uygun, T. Kim, et al., “Measuring semantic similarities by combining gene ontology annotations and gene co-function networks,”
BMC Bioinformatics, 16: 44, 2015.
[8] A. Chatr-aryamontri, B. J. Breitkreutz, R. Oughtred, et al., “The BioGRID interaction database: 2015 update,” Nucleic Acids Research, 43, Database issue: D470-D478, 2015.
[9] W.-P. Lee, C.-H. Lin, “Combining expression data and knowledge ontology for gene clustering and network reconstruction,” Cognitive Computation, 8, 217-227, 2016.
[10] M. Batet, D. Sanchez, A. Valls, “An ontology-based measure to compute semantic similarity in biomedicine,” Journal of Biomedical Informatics, 44, 118-125, 2011.
[11] P. Resnik, “Using information content to evaluate semantic similarity in a taxonomy,” in: Proceedings of International Joint Conference on Artificial Intelligence, 1995.
[12] J. Z. Wang, Z. Du, R. Payattakool, et al., “A new method to measure the semantic similarity of GO terms,” Bioinformatics, 23, 1274-1281, 2007.
[13] G. K. Mazandu, N. J. Mulder, “A topology-based metric for measuring term similarity in the gene ontology,” Advances in Bioinformatics, e975783, 2012.
[14] G. Yu, F. Li, Y. Qin, et al., “GOSemSim: an R package for measuring semantic similarity among GO terms and gene products,”
Bioinformatics, 26, 976-978, 2010.
[15] R. Kustra, A. Zagdanski, “Data-fusion in clustering microarray data: Balancing discovery and interpretability,” IEEE/ACM Trans. on Computational Biology and Bioinformatics, 7, 50-63, 2010.
[image:6.595.54.283.134.589.2]