Abstract—This paper introduces a radiation hardness evaluation method for complex system based on the combination of simulation and test data. The method consists of three major steps including pre-QMU analysis, initial QMU analysis and refined QMU analysis, which is an extension of classical quantification of margins and uncertainties. The rigorous performance evaluation results can be obtained through model calibration, uncertainty propagation, and the combination of simulation and test data based on CoM inequality. Compared with the pure model-based quantitative evaluation and the qualitative engineering evaluation, the method ensures a 100% confidence of the certification when the system performance is certified. To verify the effectiveness, the method is applied to the radiation hardness evaluation of a satellite power system. The test data is collected through a small amount of in-orbit data, and the engineering model is used as the simulation model. The result shows that the method for system performance evaluation is valuable in engineering. Finally, the paper looks forward to some issues needing further research.
Index Terms—radiation hardness, performance evaluation, quantification of margins and uncertainties, satellite power system
I. INTRODUCTION
HE QMU method is a system certification method derived from deterministic models proposed in recent years [1][2]. It is proposed to comprehensively utilize various possible data and information, including test data, numerical simulation information and so on. Its purpose is to reveal the failure mode and make a reasonable evaluation and certification of the comprehensive performance of the system with a simple information structure. Recently, QMU method has been applied at home and abroad. For example, the U.S. Energy Agency used QMU to evaluate the repository and waste packaging design of the Yucca Mountain disposal system [3], the Sandia National Laboratory of the United States used QMU to evaluate the performance of reinforced electronic products in the QASPR project [4], the Northwest Nuclear Technology Research Institute evaluated the gamma-dose radiation hardness of power supply system[9] and the gamma total-dose resistance of electronic system[10].
Manuscript received March 12, 2019; revised April 5, 2019.
This research was supported by the National Natural Science Foundation of China nuder Grant Nos.71371183 and 71071158.
You Yang is with the Academy of Military Sciences and she is a Ph.D. student at the National University of Defense Technology.China (phone: 008618519147881; e-mail: [email protected]).
Jin Guang is with the National University of Defense Technology.China (e-mail: [email protected]).
Numerical simulation is the main source of information for applying the QMU method [3][4][9][10][11], and the premise is to establish a model that describes the physical image of the evaluation object as accurately as possible. However, it is not always feasible to obtain the accurate model due to the shortage of knowledge, cost and time. Moreover, for some evaluation objects such as satellite systems, it is not necessary (and sometimes difficult) to establish a high-confidence model. For complex systems, it is often possible to obtain some test data or operational data at the component, subsystem or system level. Such data is valuable for evaluating system performance. Making full use of the test data is important to ensure the credibility of the evaluation.
This paper proposes an evaluation method for radiation hardness of complex system based on the QMU method and the combination of simulation and test data. Using the evaluation framework, rigorous results of radiation hardness of complex system could be obtained through model calibration, uncertainty propagation based on the calibrated model, the combination of simulation and test data based on the CoM inequality. Furthermore, the confidence coefficient of the certification is 100% if the system performance is certified. The effectiveness of the method is verified by the radiation hardness evaluation of a satellite power system.
II. EVALUATIONFRAMEWORK FORRADIATIONHARDNESS
OFCOMPLEXSYSTEM
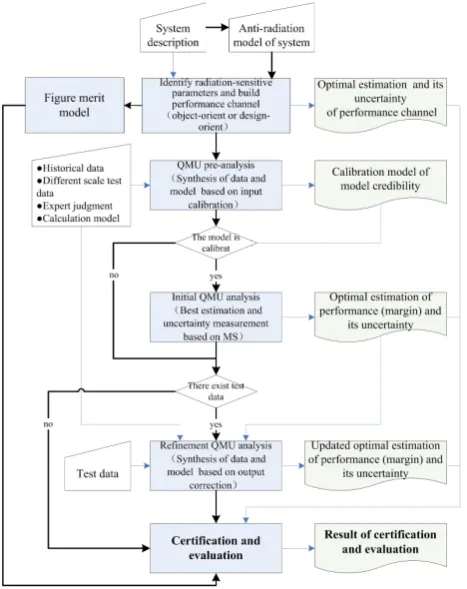
The key to the evaluation of radiation hardness of complex system based on QMU is to comprehensively utilize various information, especially test data and numerical simulation information, to obtain the best estimate of margins and uncertainties of the system radiation hardness. The method for evaluating the system radiation hardness proposed in this paper is shown in Figure 1. Based on the existing numerical simulation level and test data, it obtains indicators for evaluating the system radiation hardness, such as the figure of merit and the probability that the performance meets the requirements. The method divides the process into five sequential execution stages. The purpose of Phase 1 is to detail system performance thresholds and quantify the uncertainty of performance requirements. Stages 2 to 4 detail the performance margins (the extent to which performance index exceeds threshold), and quantify the uncertainty of margins. In stage 5, based on the information obtained in the previous stages, the QMU indexes are obtained to evaluate the system performance. Due to space limitations, a detailed description of the program can be found in the literature [12].
Evaluation of Radiation Hardness for Complex
System Combining Simulation and Test Data
YOU Yang, JIN Guang
Fig. 1. System anti-radiation evaluation implementation plan based on QMU
The QMU establishes a comprehensive, refined, and reasonable observing list (set of radiation-sensitive parameter) to characterize the system's ability to perform specified functions under specified conditions. These parameters are required to be measured by test or calculated by modeling and simulation. Radiation-sensitive parameters can be determined by performance channel analytical method or potential failure mode analytical method [15]. The performance channel is the range of values allowed for radiation-sensitive parameters. There are two different ways to determine the performance channel based on QMU, which is called object-orient QMU and design-orient QMU. The former determines system-level performance requirements through design documentation and evaluates system-level margin, uncertainty, and quantification based on uncertainty input of system. The latter calculates the allowable range of input values according to system-level performance requirements, and evaluates the margin, uncertainty and quantification based on test or simulation.
Take the evaluation of radiation hardness of a satellite power supply system, for instance. Assume that the system-level performance requirement is Y (as shown in TableⅠ), obtain the margin and uncertainty of Y based on target-oriented QMU, and verify whether the performance of system meets the following two requirements:
(C1) YLYYU, where YLis the lower limit of Y and YUis
the upper limit of Y;
(C2) P{YYU or YYL},(0,1) is the given real
number, called the failure tolerance.
To obtain the design parameter X by design-oriented QMU, such as the margin and uncertainty of solar cell open circuit voltage, short circuit current, maximum power, voltage at the maximum power point, current at the maximum power point. To verify whether it meets performance requirements. The
allowable range of X, that is, the performance channel, is determined by inverse operation according to the requirement of Y. By verifying that X fall into the performance channel, to guarantee the system meet the design requirements. Here, the determination of performance channel is generally a very complex optimization problem.
III. RADIATIONHARDNESSMODEL OFSATELLITEPOWER
SUPPLYSYSTEM
A satellite power supply system is consist of three parts: solar array, battery and power controller. The power controller includes main error amplifier, shunt regulator, discharge regulator, charging regulator and other modules. To improve system reliability by using hot backup, cold backup, multi-level circuit design, and so on. The radiation hardness model of the power supply system needs to describe the effects of radiation-sensitive components, radiation environment, shielding structure, and radiation hardness design. Since the radiation damage of the device has individual differences and time uncertainty, and its model is affected by the data measurement error, the degradation model is established by the degradation-based modeling method. Many different models can be built due to the radiation hardness of the system is affected by environmental factor, shielding structure factor and system design factor. Therefore, the multi-model strategy is used to establish the system-level radiation hardness model.
A. System-level Radiation Hardness Model
The integrated model of system-level radiation resistance is shown in Figure 2. The submodels include the radiation environment model (C1), the radiation shielding model (C2), the solar array degradation model (C3), the power degradation model of MOS device (C4), and the principle model of power supply system (C5). The connection between submodels is described by the shared variable technology of the developed modeling tool. Each model is described below. C1 is the space radiation environment satellite experienced during a mission. The input variables include: the orbital elements, the on-orbit runtime, the standard space radiation environment model. The output is the flux of various types of space radiation particles satellite experienced during the lifetime.
C2 is the radiation shielding model which describes the radiation dose sustained by the specified point inside the structure under the given radiation environment and shielding structure. The inputs are: the flux of various types of space radiation particles satellite experienced during the lifetime (from C1), the total surface area of the shielding structure, the shielding thickness in all directions, the depth curve. The output is the radiation dose to which the specified point is exposed.
C3 is the solar array degradation model which describes the degradation of the output power of the solar array with cumulative radiation dose. The input variables include: the degradation rate of a single solar cell, the flux of various types of space radiation particles satellite experienced during the lifetime (from C1), and the output are the open circuit voltage, short circuit current, and maximum power after radiation.
input is a cumulative dose (from C1) and the output is electrical parameter after radiation.
MOS devices act as power switches in multiple modules or components of a power supply system. Only the reduction about shunts due to degradation of its threshold voltage is considered currently.
C5 is the performance simulation model of the power supply system, which describe the performance of the power supply system under a specific solar array configuration, battery configuration, and power controller configuration. The solar array characteristic and the shunt regulator state are derived from the solar array degradation model and the degradation model of MOS device. Other parameters are the model's own input.
Fig. 2. Schematic diagram of the multi-model of radiation hardness of satellite power supply system
B. Uncertainty Analysis of Cognition
Uncertainty of cognition in the evaluation of radiation hardness of a power supply system, including the uncertainty of performance requirements and the uncertainty of radiation hardness model.
[image:3.595.310.549.157.375.2](1) Uncertainty of system performance requirements According to the telemetry parameters and on-orbit diagnostic knowledge of a series of satellite, the system-level performance parameters and requirements are determined as shown in Table Ⅰ . Due to the different performance requirements of different satellites, the upper or lower limit of the performance parameters may take multiple values. That is, the system performance requirements are uncertain.
Table I
On-orbit telemetry parameters and the upper or lower limit of the power supply system of a satellite
System-level performance parameters Lower limit Upper limit
bus voltage 27.5 29.5
square current 0 {36,40,45}
recharging current 0 {20,21}
BDR Module 1 output current 0 {15,20}
BDR Module 2 output current 0 {15,20}
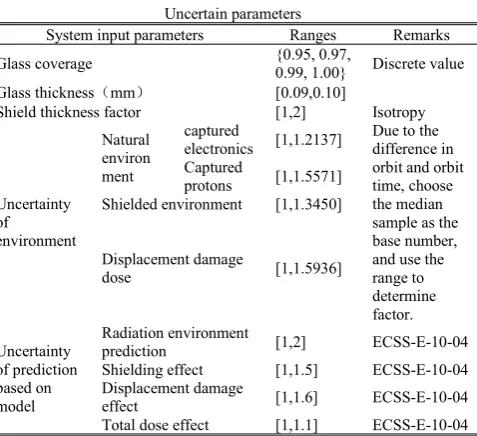
(2) Uncertainty of system radiation hardness model The uncertain cognition of system radiation hardness model, corresponding to the Uncertain cognition of the model parameters, including the number of satellite orbits, the radiation shielding thickness, and the coverage of the glass. Differences in orbit parameters and in-orbit time will lead to differences in radiation environment satellite experience. Using the OMERE software to predict the differential and integral data electron of the captured electronics and protons
under different orbital conditions, and to obtained the uncertainty of the radiation environment. Due to the uncertain cognition of the radiation shield, mechanism of radiation, and so on, therefore, prediction based on model is also uncertainty. Refer to the relevant data to determine the uncertainty of prediction based on model. TableⅡdescribes the uncertain parameters.
TableⅡ
Uncertain parameters
System input parameters Ranges Remarks
Glass coverage {0.95, 0.97,0.99, 1.00} Discrete value
Glass thickness(mm) [0.09,0.10]
Shield thickness factor [1,2] Isotropy
Uncertainty of
environment
Natural environ ment
captured
electronics [1,1.2137] Due to thedifference in orbit and orbit time, choose the median sample as the base number, and use the range to determine factor. Captured
protons [1,1.5571] Shielded environment [1,1.3450]
Displacement damage
dose [1,1.5936]
Uncertainty of prediction based on model
Radiation environment
prediction [1,2] ECSS-E-10-04
Shielding effect [1,1.5] ECSS-E-10-04
Displacement damage
effect [1,1.6] ECSS-E-10-04
Total dose effect [1,1.1] ECSS-E-10-04
IV. QMU PRE-ANALYSIS
Applying QMU should ensure that the model is reliable and that the model should be improved through V&V. Model refinement and model calibration are the two main strategies for improving the model. The former strategy utilizes different physical principles or other method to build a more complex model. The latter one modifies the model parameters to match the predictions of the model with the physical observations using mathematical method. Model refinement can fundamentally improve the ability of model prediction, but it is limited by the limited knowledge and computing resources. Model calibration is more convenient and effective if it is implemented correctly. Based on the test data , degradation model of radiation hardness of solar cell, MOS device and any other radiation sensitive device are established using reliability technology of performance degradation. These models are extensions and revisions to the engineering empirical model.
Using the radiation hardness test data of the GaAs solar cell, to convert the actual radiation dose into a non-ionizing dose, and to obtain non-ionizing dose and normalized electrical parameter, including maximum power, open circuit voltage, short circuit current, and so on. The degradation model of radiation hardness of solar cell is established, as follows [6][7]:
0
1 log 1
x
P C D
P D
(1)
P is the normalized electrical parameter of the solar cell when the radiation is D, P0is the initial value, and C and DX
[image:3.595.47.291.232.376.2]fitting model. It can be seen that the degradation model can be used to describe the degradation process of electrical parameters of solar cell, as well as the uncertainty of individual differences and measurement errors.
Fig. 3. The fitting model of maximal power degradation paths
Using the radiation hardness test data of a N-MOSFET device shown in Fig. 4(a), a non-stationary Gamma process model of performance degradation of the N-MOSFET is established. After the goodness of fit test [14], the shape
function is determined as:
)
1
(
)
(
D
a
e
Db
(2)D is the cumulative radiation dose. The prediction about the relationship between failure probability of the MOS device and D is based on the degradation model. The failure probability curve is shown in Figure 4(b)
(a) Test data
(b) Failure probability curve
Fig. 4. Radiation test data of a N-MOSFET device and estimation of failure probability
V. QMU INITIALANALYSIS
QMU initial analysis is based on the calibration model, and the radiation hardness of the system is evaluated by the simulation data.
For example, the QMU method described in [11] is used to evaluate whether the radiation hardness of a satellite power supply system meets the requirement. According to the upper and lower bounded channel of a satellite power supply system, define:
0 1
0 1
0 1
, , , ,
, : min
, , , .
mn M b
M
mx M b
Q t t t Q
Q t t t t
Q Q t t t
a e a e
a e (3) Using the sample mean and the median as the estimation of the performance margin, the difference between performance margin and sample quantile is taken as the uncertainty of the margin, and two different confidence factors can be defined as:
1 1
1 ,
m
m m q
Q M
CF
U Q Q
(4)
,0.5 2
2
2 ,0.5 ,
m
m m q
Q M
CF
U Q Q
(5)
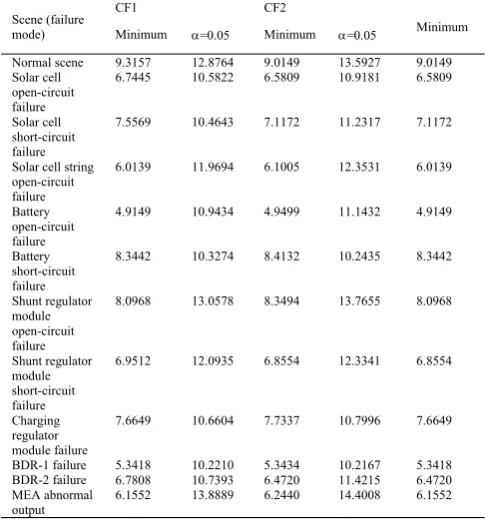
Using the simulation data, performance evaluations of different failure modes and different life stages are obtained, as shown in tableⅢand Figure 5.
TableⅢ
QMU evaluations in different failure modes at the beginning of life Scene (failure
mode)
CF1 CF2
Minimum Minimum =0.05 Minimum =0.05
Normal scene 9.3157 12.8764 9.0149 13.5927 9.0149 Solar cell
open-circuit failure
6.7445 10.5822 6.5809 10.9181 6.5809
Solar cell short-circuit failure
7.5569 10.4643 7.1172 11.2317 7.1172
Solar cell string open-circuit failure
6.0139 11.9694 6.1005 12.3531 6.0139
Battery open-circuit failure
4.9149 10.9434 4.9499 11.1432 4.9149
Battery short-circuit failure
8.3442 10.3274 8.4132 10.2435 8.3442
Shunt regulator module open-circuit failure
8.0968 13.0578 8.3494 13.7655 8.0968
Shunt regulator module short-circuit failure
6.9512 12.0935 6.8554 12.3341 6.8554
Charging regulator module failure
7.6649 10.6604 7.7337 10.7996 7.6649
BDR-1 failure
BDR-2 failure 5.34186.7808 10.221010.7393 5.34346.4720 10.216711.4215 5.34186.4720 MEA abnormal
[image:4.595.305.550.395.655.2]Fig. 5. Relationship between the figure of merit of bus voltage and the years in orbit
VI. QMU REFINEDANALYSIS
The data of complex systems is usually lacking compared to needs, so it is necessary to combine data from multiple sources when evaluating. The purpose of the QMU refined analysis is to update and refine the system performance margin and uncertainty obtained by the pre-analysis. An important aspect of it is the integration of data with different accuracy, such as simulation data and test data.
COM inequality is used here to synthesize simulation and test data. Assuming that the actual system performance is Y=(Y1,Y2,…,YN), described by the function
Y=G(X,Z)=(G1(X,Z),…,GN(X,Z)), the function is unknown.
The input variables include random variable X and unknown
variable Z. The simulation model is
Y=F(X)=(F1(X),…,FN(X)), the input vector
X=(X1,X2,…,XM), and the range of values for each parameter
is Xii. The confidence factor is defined as:
i i i
i i
F G F
M
CF
D
D
(6)where
D
Fi is the uncertainty of the model Fi,D
G Fi i isthe difference between the model Fi and the real system
Gi(X,Z). For a given function H(X), its uncertainty is defined
as[8]:
Mk x x x x A B
H
k K K M k k M k k
D
1( , , , ) ( , )
2
2 1
1 1 1 1 1
sup
sup
2 1
1
,
,
,
)
(
,
,
,
)
(
x
A
Kx
MH
x
B
kx
MH
(7) Define the discriminant C(m,) of C2 as a function of the number of simulations (m) and the failure tolerance parameters of the performance requirements (), as follows:
2
1
1
( , ) log exp 2 log
2
N
i i
C m
CF
(8)C(m,)>0 indicates that the system performance can be verified to meet the requirements.
The discriminant C(m, ) of Figure 6 shows the requirements for the sample size m of the performance verification. Since the uncertainty of the difference between the simulation model and the actual system is too large, it is impossible to verify the system performance with a small
[image:5.595.318.541.66.228.2]sample of test data.
Fig 6 Discriminant C(m,)
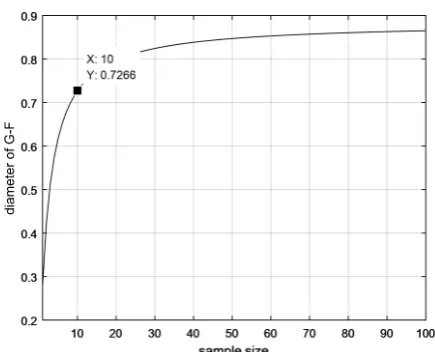
Given the failure tolerance=0.05, as is shown in Figure 7, when the diameter of G-F is less than 0.7266, the system performance requirements can be verified by less than 10 tests. This equates to an approximate error about 0.7266/29.5/71/20.93% between the model and the actual system. This is, the performance requirements are verified with the relative error of the model is less than 0.93%.
Fig. 7. Relationship between diameter of model error and sample size m,
=0.05
As can be seen from the above discussion, through the comprehensive evaluation of the model and the data, it can not only verify whether the radiation hardness of the system meets the requirements (C2), but also obtain the following results:
(1) The number of tests required, given the accuracy of the simulation model;
(2) The accuracy that the model should achieve, given the number of tests.
VII. SUMMARY
Choosing a satellite power system as the object, the evaluation of radiation hardness of complex systems is systematically researched based on QMU method. For further use in engineering, more researches are needed in the following areas:
[image:5.595.316.534.356.532.2]input or output, the performance margins and uncertainties of the evaluation object are strictly quantified to ensure the reliability of the assessment.
(2) The resources of the evaluation should be optimized. Reasonable allocation of evaluation resources such as cost and time should be taken to maximize the accuracy and reliability of the evaluation, involving the quantification of evaluation contribution of data and model, the combination of data and model, and the optimal allocation of evaluation resources.
(3) Confidence of test data and field data should be assessed. Rigorous data analysis and modeling research should be conducted. Standardized acquisition procedures of expert knowledge should be developed. The confidence of various data should be reasonably evaluated. Establish reliable system models to obtain reliability evaluation results.
REFERENCES
[1] M A Zhi-bo , YING Yang-jun , ZH U Jian-shi. QMU certifying method and its implementation. Chinese Journal of N uclear Science and Engineering. Vol. 29, No. 1, 2009:1-9.
[2] B. T. Goodwin, R. J. Juzaitis. National certification methodology for the nuclear weapon stockpile. UCRL-TR-223486; 2003: 1-10. [3] Peter N. Swift, Clifford W. Hansen, Jon C. Helton, Robert L. Howard,
M. Kathryn Knowles, Robert J. MacKinnon a, Jerry A. McNeish, S. David Sevougian. Summary discussion of the 2008 performance assessment for the proposed high-level radioactive waste repository at Yucca Mountain, Nevada. Reliability Engineering and System Safety. 2013.
[4] Michael S. Eldred, Laura P. Swiler. Efficient algorithms for mixed aleatory-epistemic uncertainty quantification with application to radiation-hardened electronics, Part I: Algorithms and Benchmark Results. SAND2009-5805, 2009.
[5] Alyson G. Wilson, Christine M. Anderson-Cook, Aparna V. Huzurbazar. A case study for quantifying system reliability and uncertainty. Reliability Engineering and System Safety, 96(2011): 1076-1084.
[6] B. E. Anspaugh. GaAs solar cell radiation handbook.JPL Publication,
1996: 96-99.
[7] S. Makhamn, G.C. Sun, J.C. Bourgoin. Modelling of solar cell degradation in space. Solar Energy Materials & Solar Cells 94(2010): 971-978.
[8] Leonard J. Lucas. Uncertainty Quantification Using
Concentration-of-Measure Inequalities. PhD Thesis. California Institute of Technology, Pasadena, California. 2009.
[9] FanRu-yu, HanFeng, GuoHong-xi . Assessment method of gamma-dose radiation hardness of power supply system . HIGH POWERLASER AND PARTICLEBEAMS . Vol. 23, No. 2. Feb. 2011.
[10] HanFeng,FanRuyu. Method for estimating total radiation hardness ability of electronic systems based on system state prediction. Anti-nuclear and reinforcement. Vol. 31, No.2. June 2014.
[11] Jon C. Helton. Conceptual and Computational Basis for the Quantification of Margins and Uncertainty. SAND2009-3055. June 2009.