Optimization of a Smoke Producer Composition by
Experiment Design
M. Vaullerin*, P. Morand, and A. Espagnacq
Giat Industries, DSAM=DT=PYRO, 7 route de Guerry, F-18023 Bourges Cedex (France)
Summary
This paper deals with the work carried out to define new formula-tions used to increase the infrared effectiveness of a reference smoke producer composition. This pyrotechnic mixture is constituted by a combination of oxidizing agents and fuels generating mainly carbon but also chlorinated metallic salts which are essential for camouflage by combustion. First, for several compositions, the 3–5mm and 8–12mm extinction coefficients are correlated to the proportions of Magnesium and (MgþMgCl), respectively (determined by thermo-chemical computations with the Bagheera code). Then, to widen the investigations on smoke producing compositions, this correlation was studied by associating two experiment designs, an equiradial matrix and a Scheffe mixing matrix. We would point out that using this experimental strategy makes both possible, the minimization of the number of experiments – and therefore the cost factor – and the modelling of the results which allows to gain the properties of potential formulations on the whole experimental field.
1. Introduction
In the military field, some tactical operations need obscur-ant materials to protect sites, vehicles and troop movements against enemy observations.
Until the end of the 70s, the aim of these screening materials was only the camouflage in the visible window. Nowadays, they must also be effective against observation means operating in the infrared window. Generally, these materials are fogs (droplet clouds), smokes (particle clouds) or solid particles dispersed as aerosols by explosion.
Their effectiveness depends on several criteria:
Type and concentration of the screening material
Application process
Usage concept
These three aspects are interdependent and directly asso-ciated with scenarios (definition of the tactical operation, type of threat), but also with the local atmospheric condi-tions. Today, on the international market there is a smoke generator dispersion system developed by the companies Giat Industries and Lacroix which has the capability of dispersing visual and IR screening materials. The objective of the study was to demonstrate if it is possible to increase the effectiveness of this munition in the infrared range.
2. Definition of the Parameters
We have to define new formulations able to increase the IR effectiveness of the reference smoke producer composi-tion(3). This mixture is constituted by a combination of an oxidizing and a reducing agent generating mainly carbon but also chlorinated metallic salts which are essential for camou-flage by combustion.
To widen the range of the new compositions, we studied the influence of:
The magnesium ratio
The carbon generator by the addition of a new carbon generator up to 50% and
The binder up to the complete replacement of the refer-ence composition’s binder
3. Experimental Field of Interest
Ultimate values of each component ratio were defined (Table 1):
Magnesium was studied between 15% and 30%, the binder between 5% and 10% and the carbon generator between 60% and 80%.
In addition, we studied how the effectiveness is affected by the:
Addition of a new carbon generator up to 50%, and the
Use of a new binder up to the complete replacement of the present one.
4. Matrices of Experiments
To take into account this experimental domain of interest we used a design methodology specially built to treat five parameters, the concentration of magnesium, two binders and two carbon generators. In fact, these five parameters are the formulation components and the appropriate experimen-tal methodology could make use of a Scheffe matrix.
However, we prefered a two-stage approach because we had also to take into account the relative ratios of carbon generators and binders. First, relative ratios of binders and carbon generators were optimized by using an equiradial matrix(2,4). Then, the component ratios of the composition
*Corresponding author; e-mail: [email protected]
were optimized by using a specific Scheffe matrix(2,5)taking into account the definition of the experimental domain.
4.1 Equiradial Matrix
The equiradial matrix (Figure 1) chosen to optimize the relative proportions of the binder and the carbon generator makes it possible to study the ratios of these components on several levels (5 for the binder ratios and 4 for the carbon generator ratio). It requires six experiments including one in the center of the experimental domain.
4.2 Mixing Matrix
The Scheffe matrix (Figure 2) makes it possible to take into account all variations of the components. It requires five experiments.
4.3 Resulting Matrix
The resulting matrix is obtained by the application of the Scheffe matrix to every point of the equiradial matrix. So we
need 65¼30 experiments. A grey parallelogram showing the continuous variation field of the Scheffe matrix is combined with every experimental point of the equiradial matrix. These 30 experiments are represented by white points in Figure 3.
4.4 Postulated Mathematical Models
The postulated model for the equiradial matrix is described by the following quadratic Eq. (1).
Yi¼bi0þbi1Xi1þbi2 X2
i þbi11 X2i1þbi22 X2i2
þbi12 ðXi1Xi2Þ ð1Þ
where:
Xi1¼GeC1=GeC2 ratio between the two carbon generators
Xi2¼Binder 1=Binder ratio between the binders
The mathematical model chosen with the mixing matrix is a special polynomial equation. It is represented by the following Eq. (2):
Yj¼bj1Xj1þbj2Xj2þbj3Xj3þbj123ðXj1 Xj2Xj3Þ
ð2Þ
where:
Xj1: Magnesium ratio
Xj2: binder ratio
Xj3: carbon generator ratio
5. Experiment Design
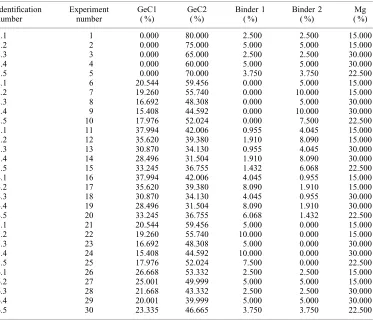
[image:2.595.305.545.49.238.2]Details of the experiment design as a result of the product of the equiradial matrix with the Scheffe matrix are given in Table 2. To make things easier, identification numbers are used. The first digit is the experiment’s number in the equiradial matrix and the second one the experiment’s number in the mixing matrix.
Table 1. Parameters Studied and Experimental Field
Experimental field
Minimum Maximum
Magnesium 15% 30%
Binder (Binder 1þBinder 2) 5% 10%
Carbon generator (GeC1þGeC2) 60% 80%
GeC1=GeC2 0 1
[image:2.595.48.291.64.153.2]Binder1=Binder 0 1
Figure 1. Diagram of the equiradial matrix.
Figure 2. Diagram of the Scheffe mixing matrix.
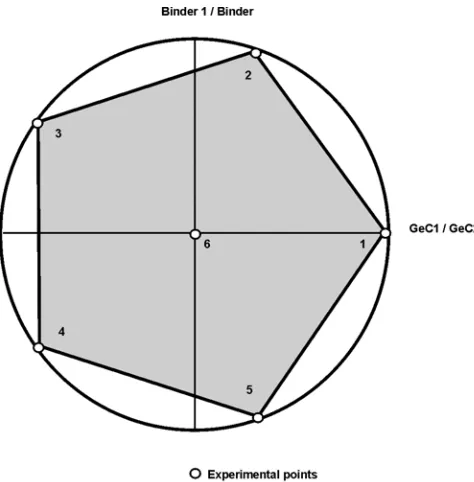
[image:2.595.50.287.480.721.2]Figure 3. Representation of the experimental points (Equiradial matrix and Scheffe matrices).
Table 2. Experiment Design (Equiradial Matrix and Mixing Matrices)
Identification number
Experiment number
GeC1 ( %)
GeC2 ( %)
Binder 1 ( %)
Binder 2 ( %)
Mg ( %)
1.1 1 0.000 80.000 2.500 2.500 15.000
1.2 2 0.000 75.000 5.000 5.000 15.000
1.3 3 0.000 65.000 2.500 2.500 30.000
1.4 4 0.000 60.000 5.000 5.000 30.000
1.5 5 0.000 70.000 3.750 3.750 22.500
2.1 6 20.544 59.456 0.000 5.000 15.000
2.2 7 19.260 55.740 0.000 10.000 15.000
2.3 8 16.692 48.308 0.000 5.000 30.000
2.4 9 15.408 44.592 0.000 10.000 30.000
2.5 10 17.976 52.024 0.000 7.500 22.500
3.1 11 37.994 42.006 0.955 4.045 15.000
3.2 12 35.620 39.380 1.910 8.090 15.000
3.3 13 30.870 34.130 0.955 4.045 30.000
3.4 14 28.496 31.504 1.910 8.090 30.000
3.5 15 33.245 36.755 1.432 6.068 22.500
4.1 16 37.994 42.006 4.045 0.955 15.000
4.2 17 35.620 39.380 8.090 1.910 15.000
4.3 18 30.870 34.130 4.045 0.955 30.000
4.4 19 28.496 31.504 8.090 1.910 30.000
4.5 20 33.245 36.755 6.068 1.432 22.500
5.1 21 20.544 59.456 5.000 0.000 15.000
5.2 22 19.260 55.740 10.000 0.000 15.000
5.3 23 16.692 48.308 5.000 0.000 30.000
5.4 24 15.408 44.592 10.000 0.000 30.000
5.5 25 17.976 52.024 7.500 0.000 22.500
6.1 26 26.668 53.332 2.500 2.500 15.000
6.2 27 25.001 49.999 5.000 5.000 15.000
6.3 28 21.668 43.332 2.500 2.500 30.000
6.4 29 20.001 39.999 5.000 5.000 30.000
[image:3.595.113.486.419.740.2]6. Results and Analysis
The Bagheera computations(1) and the relationship between the ratio of the combustion products and the mass extinction coefficients of some mixtures already tested enabled to define the correlation to the mass extinction coefficients measured by experiment.
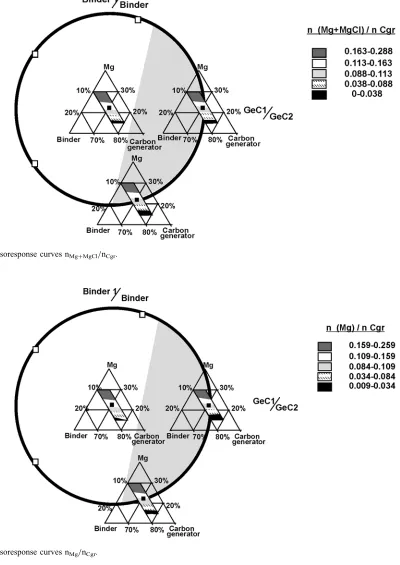
A comparison between the two diagrams in Figures 2 and 3 shows that the mole numbers of Mg and MgCl in relation to the mole numbers of carbon (Bagheera computations) are correlated with the 3–5mm range extinction coefficient: in fact, the lower these ratios (that is, a maximum carbon product), the better the extinction coefficient.
We have a similar analysis for the correlation of the 8– 12mm extinction coefficient with the mole numbers of Mg in relation to the mole numbers of carbon (Figures 4 and 5).
Results of the experiment design (Table 3) presented in Figures 6 and 7 show that it is possible to improve the effectiveness of the smoke producer compositions in the 8–12mm and 3–5mm infrared window with formulations defined at the points 1 and 5 on the equiradial (the lowest [Mg=Cgr] and [(MgþMgCl)=Cgr] ratios, Cgr¼carbon generator). We would point out that the [Mg=Cgr] ratio correlates with the 8–12mm range extinction coefficient.
[image:4.595.307.543.54.193.2]Black areas on graphs of Figures 8 and 9 show that the most interesting points (Table 4) to maximize the extinction coefficients in 8–12mm and 3–5mm are placed at the bottom of the experimental domain on the Scheffe matrix, when the magnesium ratio is 15%.
Figure 4. Extinction coefficients of the reference compositions in 3–5
and 8–12mm.
Figure 5. Correlation of the 3–5 and 8–12mm extinction coefficients
[image:4.595.50.286.439.590.2]with the (MgþMgCl)=Cgr and Mg=Cgr ratios.
Table 3. Experimental Results for the Equiradial Matrix
Identification number
Experiment number
GeC1 ( %)
GeC2 ( %)
Binder 1 ( %)
Binder 2 ( %)
Mg ( %)
nMg=nCgr nMgþMgCl=nCgr
1.5 5 0.000 70.000 3.750 3.750 22.500 0.0903 0.1002
2.5 10 17.976 52.024 0.000 7.500 22.500 0.1129 0.1160
3.5 15 33.245 36.755 1.432 6.068 22.500 0.1235 0.1243
4.5 20 33.245 36.755 6.068 1.432 22.500 0.1191 0.1211
5.5 25 17.976 52.024 7.500 0.000 22.500 0.1051 0.1096
6.5 30 23.335 46.665 3.750 3.750 22.500 0.1142 0.1166
Figure 6. Isoresponse curves nMgþMgCl=nCgrfor the equiradial matrix.
Figure 7. Isoresponse curves nMg=nCgrfor the equiradial matrix.
[image:4.595.300.541.443.595.2] [image:4.595.50.550.646.738.2]Therefore, as far as the proportions of Mg and (MgþMgCl) relative to the carbon ratio are concerned, we note that the influence of the addition of the new carbon generator is very significant in relation to the influence of the nature of the binder (Figures 6 and 7). Certainly, when the portion of the binder in the mixture increases (Figures 8 and 9) these effects are highly lowered but are negligible when compared to the effect of the different carbon generators.
7. Conclusion
The application of an experimental methodology coupled with Bagheera thermochemical computations enabled to optimize a reference screening formulation. The result is a better compromise between the ratios of Mg=Cgr and (MgþMgCl)=Cgr. An experimental validation confirmed the predicted results. In fact, the most promising
[image:5.595.90.490.55.620.2]composi-Figure 8. Isoresponse curves nMgþMgCl=nCgr.
[image:5.595.104.374.346.592.2]tions have been produced and the extinction coefficients measured in the 3–5mm and 8–12mm infrared range. They were essentially higher than those of the reference composi-tion. The improvement of the screening effectiveness in the 8–12mm range goes up to 23%.
8. References
(1) STANAG 4400, NATO, ‘‘Derivation of Thermochemical Values for Internal Ballistics Computations’’ 1st ed., June 3, 1993. (2) NEMROD software version 3.0, LPRAI, Marseille—Le Merlan,
13311 Marseille Cedex 14, France.
(3) M. Vaullerin, ‘‘Optimisation ofthe FIR 784 Smoke Producer Composition’’, GIATIndustries Confidential Technical Memo,
PYRO-2=DSAM=DT=PYRO=EM=NTn 65=98, CBO=SP n 06=98=CGI (1998), Bourges, France.
(4) R. Phan-Tan-Luu, D. Mathieu, and D. Feneuille, ‘‘Methodology ofExperimental Research, Study ofResponse Surfaces’’, Report (Jan. 1983), LPRAI, Aix-en-Provence, France.
(5) R. Phan-Tan-Luu, D. Mathieu, and D. Feneuille, ‘‘Methodology ofExperimental Research, Experiment Matrices Applied to Mixtures’’, Report (Jan. 1983), LPRAI, Aix-en-Provence, France.
Acknowledgement
The study was carried out with the financial support of the DGA (DSA=SPARTContract no. 95.02.167).
[image:6.595.50.546.62.239.2](Received April 2, 2001; Ms 2001=031)
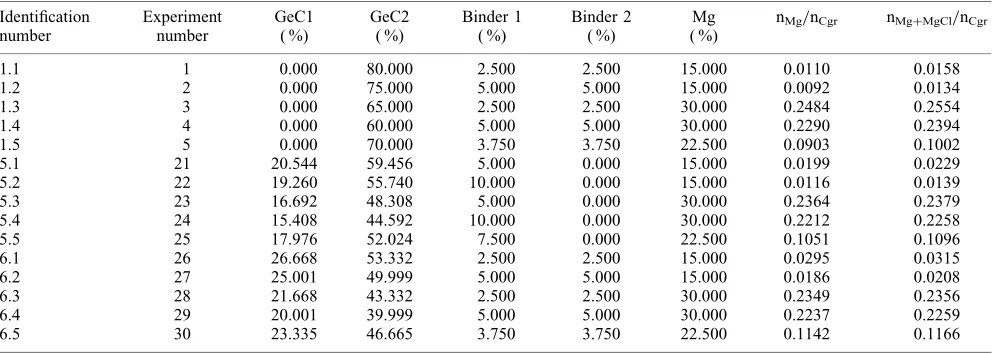
Table 4. Experimental Results for the Scheffe Matrices at Points 1, 5 and 6 of the Equiradial Matrix
Identification number
Experiment number
GeC1 ( %)
GeC2 ( %)
Binder 1 ( %)
Binder 2 ( %)
Mg ( %)
nMg=nCgr nMgþMgCl=nCgr
1.1 1 0.000 80.000 2.500 2.500 15.000 0.0110 0.0158
1.2 2 0.000 75.000 5.000 5.000 15.000 0.0092 0.0134
1.3 3 0.000 65.000 2.500 2.500 30.000 0.2484 0.2554
1.4 4 0.000 60.000 5.000 5.000 30.000 0.2290 0.2394
1.5 5 0.000 70.000 3.750 3.750 22.500 0.0903 0.1002
5.1 21 20.544 59.456 5.000 0.000 15.000 0.0199 0.0229
5.2 22 19.260 55.740 10.000 0.000 15.000 0.0116 0.0139
5.3 23 16.692 48.308 5.000 0.000 30.000 0.2364 0.2379
5.4 24 15.408 44.592 10.000 0.000 30.000 0.2212 0.2258
5.5 25 17.976 52.024 7.500 0.000 22.500 0.1051 0.1096
6.1 26 26.668 53.332 2.500 2.500 15.000 0.0295 0.0315
6.2 27 25.001 49.999 5.000 5.000 15.000 0.0186 0.0208
6.3 28 21.668 43.332 2.500 2.500 30.000 0.2349 0.2356
6.4 29 20.001 39.999 5.000 5.000 30.000 0.2237 0.2259
6.5 30 23.335 46.665 3.750 3.750 22.500 0.1142 0.1166