Capturing Interest Through Inference and Visualization: Ontological User Profiling in Recommender Systems
8
0
0
Full text
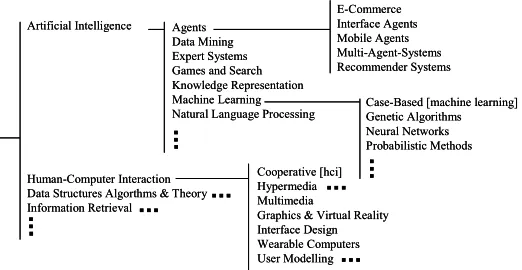
(2) both ontological inference and bootstrapping apply to the Foxtrot system.. 2.. Bootstrapping profiles using an external ontology to reduce the cold-start problem.. A web proxy is used to monitor each user’s web browsing unobtrusively, adding new research papers to the central database as users discover them. The database of research papers is classified using a research paper topic ontology and a set of training examples for each topic. The research paper database thus acts as a pool of shared knowledge, available to all users via search and recommendation.. 3.. Use of direct profile feedback, elicited from a visualization of the user profile, to enhance accuracy.. World-Wide World-Wide Web Web. Interfaces Web Rec’s. Web Proxy. Profilier. Foxtrot uses a research paper topic ontology to represent the research interests of its users. A class is defined for each research topic and is-a relationships defined where appropriate. Our ontology is based on the CORA [8] digital library, since it classifies computers science topics and has example papers for each class. Figure 2 shows some of the classes within the ontology. Artificial Intelligence. Profile Visualization. Recommender. Email Rec’s. Ontology Ontology. Classifier. Agents Data Mining Expert Systems Games and Search Knowledge Representation Machine Learning Natural Language Processing. Research Paper Database. Figure 1. Foxtrot overview Recorded web browsing and relevance feedback elicited from users is used to compute daily profiles of users’ research interests. Interest profiles are represented in ontological terms, allowing other interests to be inferred that go beyond those just seen from directly observed behaviour. These interest profiles are visualized to allow direct profile feedback to be acquired, thus providing an additional source of information from which profiles can be computed. Recommendations are compiled daily and suggested to users via a web page or email. Collaborative filtering is used to compute the recommendations, using only the current topics of interests in each users content-based profile. Ontological user profiling and the visualization of profiles to elicit feedback are novel approaches to recommender systems.. Empirical evaluation An empirical evaluation of the Foxtrot system has been conducted with over 200 computer science staff and students of the University of Southampton, over the period of an academic year. The aim of this evaluation was to assess the benefits of using direct profile visualization and feedback and to assess the overall effectiveness of the recommender system.. Contribution In the context of recommender systems: 1.. ONTOLOGICAL INFERENCE Research paper topic ontology. Novel ontological profile representation, allowing ontological inference in the user-profiling algorithm.. Human-Computer Interaction Data Structures Algorthms & Theory Information Retrieval. E-Commerce Interface Agents Mobile Agents Multi-Agent-Systems Recommender Systems Case-Based [machine learning] Genetic Algorithms Neural Networks Probabilistic Methods. Cooperative [hci] Hypermedia Multimedia Graphics & Virtual Reality Interface Design Wearable Computers User Modelling. Figure 2. Section from research paper topic ontology Approximately 5-10 labelled examples of research papers were added manually to the classifier training set. There were a total of 97 classes and 714 training examples. The ontology remained fixed throughout the Foxtrot trial, but could be updated as time goes on to reflect changes in the research domain. For every new ontology class a new set of 5-10 example papers would be required. Since the vector space used by the classifier is re-built every day, adding new examples mid-trial would not cause a problem to the system. The Quickstep trial allowed users to provide their own examples of each class.. Research paper representation Research papers are represented as term vectors, with term frequency / total number of terms used for a terms weight; terms represent single words in a paper’s text. Since many words are either too common or too rare to have useful discriminating power for the classifier, we use dimensionality reduction techniques to reduce the number of vector dimensions. Porter stemming [12] is used to remove term suffixes and the SMART [14] stop list is used to remove very common words. Term frequencies below 2 are removed and for each topic class only the top 50 terms, ranked by document frequency, are added to the vector. Dimensionality reduction is common in information system; [13] provides a good discussion of the issues. Foxtrot supports papers in HTML, PS, PDF formats and various compressed versions of these formats. Heuristics.
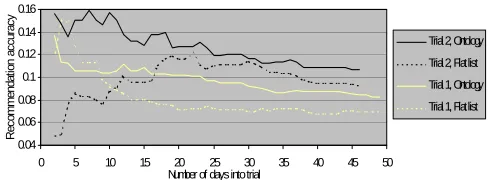
(3) Classification Research papers in the central database are classified by an IBk [1] classifier, which is boosted by the AdaBoostM1 [5] algorithm. The IBk classifier is a k-Nearest Neighbour type classifier that uses example documents, called a training set, added to a term-vector space. Figure 3 shows the basic kNearest Neighbour algorithm. The closeness of an unclassified vector to its neighbours within the term-vector space determines its classification. We used a k of 5, which performed well during informal empirical tests. k. f(dnew) =. 1 ________ new,d i). Σ w(d i=1. ____________. w(da,db) =. √Σ. (tja – tjb)2. j = 1..T. w(da,db) da,db T tja f(dnew). kNN distance between document a and b document vectors number of terms in document set weight of term j document a k nearest neighbours distance from dnew. Figure 3. k-Nearest Neighbour algorithm Classifiers like k-Nearest Neighbour allow more training examples to be added to their term-vector space, without the need to re-build the entire classifier, and they degrade well, returning classes in the right “neighbourhood” and hence at least partially relevant. This makes k-Nearest Neighbour a robust choice of algorithm. Boosting works by repeatedly running a weak learning algorithm on various distributions of the training set, and then combining the classifiers produced by the weak learner into a single composite classifier. The “weak” learning algorithm here is the IBk classifier. Figure 4 shows the AdaBoostM1 algorithm. Initialise all values of D to 1/N Do for t=1..T call weak_learn(Dt) calculate error et calculate β t = et/(1-et) calculate Dt+1 1 log __ βt t = all iterations with result class c. classifier = argmax c∈C. Σ. Dt N T weak_learn(Dt) et βt classifier C. class weight distribution on iteration t number of classes number of iterations weak learner algorithm with distribution Dt weak_learn error on iteration t error adjustment value on iteration t final boosted classifier all classes. Figure 4. AdaBoostM1 boosting algorithm AdaBoostM1 has been shown to improve [5] the performance of weak learner algorithms, particularly for the stronger learning algorithms like k-Nearest Neighbour. It is thus a sensible choice to boost our IBk classifier. Other types of classifier were considered, including the naïve Bayes classifier and the C4.5 decision tree, and informal tests run to evaluate their performance. The boosted IBk classifier was found to give superior performance for this domain.. Use of inference in user profiling Interest profiles are computed daily by correlating previously browsed research papers with their classifications. User profiles thus hold a set of topics and associated interest values for each day of the trial. Relevance feedback also adjusts the interest of topics within the profile, and a time decay function weights recently seen papers as being more important than older ones. Ontological relationships between topics of interest are also used to infer topics of interest, which might not have been browsed explicitly. An instance of an interest value for a specific class adds 50% of its value to the super-class, and this algorithms works recursively up the is-a taxonomy defined by the ontology. Figure 5 shows the profiling algorithm. Only is-a relationships are explored during these experiments, but other types of relationships could easily be utilized. n. Topic interest =. ∑. Interest value(n) / days old(n). Event interest values. Paper browsed = 1 Recommendation followed = 2 Topic rated interesting = 10 Topic rated not interesting = -10. 1..no of instances. Each user For each topic Compute topic interest Add topic interest value to user’s profile. Interest value for = 50% of sub-class super-class per instance. Figure 5. Profiling algorithm Event interest values were chosen to favour explicit feedback over implicit, and the 50% value used to represent the reduction in confidence you get the further from the direct observation you go.. Evaluation of ontological inference Two user trials were conducted on the Quickstep system to evaluate the performance benefits that would be obtained by using both an ontological profile representation and inference of profile interests. Around 20 subjects participated in both trials with half of the subjects using an extendable flat list of topics and half using the research paper ontology. A comparison of both groups is shown in figure 6, with the recommendation accuracy metric defined later in figure 11; full details of these trials are available in [10]. 0.16. Recommendation accuracy. are used to determine if the research papers are converted to text correctly and look like a typical research paper with terms such as ‘abstract’ and ‘references’. In the Foxtrot trial, term-vectors for papers had, after dimensionality reduction, around 1000 dimensions.. 0.14. Trial 2, Ontology. 0.12. Trial 2, Flat list. 0.1. Trial 1, Ontology. 0.08. Trial 1, Flat list. 0.06 0.04 0. 5. 10. 15. 20 25 30 Number of days into trial. 35. 40. 45. 50. Figure 6. Benefits of using an ontological profile representation and profile inference An individual recommendation accuracy of 10% means, because sets of 10 individual recommendations are presented in one go, that on average there was a download from every set of recommendations offered to subjects. In.
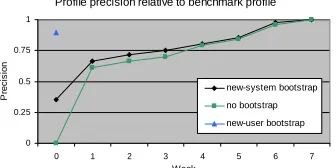
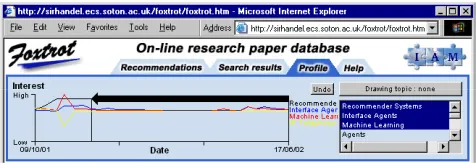
(4) both trials ontological inference boosted the recommendation accuracy of individual recommendations.. ONTOLOGICAL BOOTSTRAPPING An external ontology can be effectively used to bootstrap recommender systems, and hence overcome the cold-start problem. The cold-start problem is where recommendations are required for new items or users for whom little or no information has yet been acquired. Poor performance resulting from a cold-start can deter user uptake of a recommender system. This effect is thus self-destructive, since the recommender never achieves good performance since users never use it for long enough. In a previous experiment [9], using the Quickstep recommender system, we evaluated two bootstrapping algorithms to explore how much a recommender system’s cold-start could be reduced. In this experiment we integrated the Southampton AKT ontology, which contains academic publication and personnel data, and a communities of practice tool. This allowed us to explore the utility of static knowledge about publications and more dynamic, communities of practice, knowledge about groups of people who have some similarity to you.. they can be shared; this limits the number of training examples per user. To gather a sufficiently large training set the users either have to be monitored for a significant duration or volunteer numerous examples of interest, which tends to deter user uptake of the tool. Foxtrot represents user interests in terms of a research topic ontology. Since all users share this topic ontology, training examples can be shared too. A multi-class classifier is used to classify research papers in terms of the classes within this research paper topic ontology. Having represented interests in ontological terms we can then use the relationships between classes to infer more interests than are available from direct observation only. This representation also allows us to visualize interest profiles using terms understood by the users, and hence elicit feedback on profiles directly.. Interface and profile visualization Users primarily interact with Foxtrot via a web page. The basic interface is shown in figure 8. A web search engine interface was used, familiar to most computer scientists, allowing users to enter search queries via edit boxes and a search button used to initiate a search.. The results of this experiment are shown in Figure 7. There is a clear benefit from both types of bootstrapping algorithm, made possible because the profiles are represented using ontological terms and hence profile interests can be mapped to the external bootstrapping ontology. Profile precision relative to benchmark profile 1. Precision. 0.75. 0.5. new-system bootstrap. no bootstrap. 0.25. new-user bootstrap 0 0. 1. 2. 3. 4. 5. 6. 7. Week. Figure 7. Profile precision of bootstrapping algorithms. PROFILE VISUALIZATION Foxtrot allows users to enter both an explicit search query for a specific paper, and use the regular recommendations to keep up-to-date on their areas of research interest. The interface agent manages all interaction with users, providing a search and recommendation interface via a web page and by weekly emails. Relevance and profile feedback volunteered by users is recorded and sent to the profiler. The web proxy records web browsing in an unobtrusive manner, storing time-stamped URLs for each user. Recommender systems traditionally use a binary class approach to user profiling, holding examples of positive and negative interest for each user and classifying new papers based on how well they match these two training sets. One problem with this approach is that the training sets are personal to each user, so there is no easy basis on which. Figure 8. Recommendation and search interface Search results are returned in the area below the edit boxes, showing the details of each research paper found. Two sets of radio buttons appear below each search result to elicit relevance and quality feedback. When users first go to the Foxtrot web page their daily recommendations are automatically presented in the search result area. Users who are in the profile group can visualize their interest profiles by clicking on a profile tab. Figure 9 shows the profile interface. Profiles are displayed as a time/interest graph, showing what the system thinks their top few interests are over the period of the trial. Direct profile feedback can be draw onto this graph by using the controls to the side. A drawing package metaphor is used here, and users can draw coloured horizontal bars to represent a level of interest in a topic over a period of time. In this way a user can draw their own profile. In addition to the Foxtrot web page, a weekly email notification feature was added 3 months from the end of the trial. This provided a weekly email stating the top 3 recommendations from the current set of 9.
(5) recommendations. Users could then jump to these papers or load the Foxtrot web page and review all 9 recommendations.. Figure 9. Profile visualization interface. Profile feedback assists the profiler Profile feedback, elicited from the users interactions with the profile visualization, details a level of interest in a topic over a period of time. The profiling algorithm, shown in figure 10, adds error adjustment values for every day under the feedback interest bar to constrain interest values to those given in the profile feedback. In this way the users profile will closely match the stated interest in each topic. For topics where no feedback has been provided the normal profiling algorithm applies, using relevance feedback and ontological inference as previously described. day. error adjustments[] =. ∑. desired interest - current interest(start + day). 1..duration of interest. start = start date of profile feedback entry duration of interest = duration of profile feedback entry desired interest = interest level specified in profile feedback entry current interest(day) = current profile interest level for a particular day error adjustments[] = daily error adjustments over duration of profile feedback entry. Figure 10. Direct profile feedback algorithm. Collaborative recommendation Daily recommendations are formulated by a hybrid recommendation approach. A list of similar people to a specific user is compiled, using a Pearson-r correlation on the content-based user profiles. Recommendations for a user are then taken from those papers on the current topics of interest, which have also been read by similar people to that user. Figure 11 shows the recommendation algorithm. _. t. _. Σ (I (t) – I ) * (I (t) – I ) a. a. b. topics. Pearson r coefficientab =. √Σ t. _ (Ia(t) – Ia)2 *. topics. b. t. _. Σ (I (t) – I ). topics. b. b. 2. _Ia(t) = User a’s interest in topic t = User a’s mean interest value over all topics Ia Pearson r coefficientab = similarity of user a’s profile to user b’s profile Recommended papers = papers on user’s current interests ∩ papers read by similar user’s 3 papers recommended on the 3 most interesting topics, totalling 9 papers per day If more than 3 papers meet above criteria, papers ranked by quality rating. Figure 11. Recommendation algorithm During the Foxtrot trial 3 papers were recommended each day on the 3 most interesting topics, making a total of 9 recommended papers. Previously read papers were not recommended twice and if more than three papers were available for a topic they were ranked by quality rating.. EXPERIMENTAL EVALUATION An experiment was carried out over the period of a single academic year to access the performance of the Foxtrot recommender system. Test subjects were taken from both the staff and students of the computer science department at the University of Southampton. The test subjects used Foxtrot to assist in their everyday research. The overall recommendation and user profiling performance was measured, in addition to measuring the relative performance of those who used the profile visualization option.. Details of the experiment The user trial took place over the academic year 2002, starting in November and ending in July. Of the 260 subjects registered to use the system, 103 used the web page, and of these 37 subjects used the system 3 or more times making an uptake rate of 14%. All 260 subjects used the web proxy and hence their browsing was recorded and daily profiles built. 58 subjects joined the trial as it progressed, hearing about the system from advertising posters and word of mouth. At the start of the trial about 6,000 documents were loaded into the central database by a web crawler. By the end of the trial this database had grown to 15,792 documents as a result of subject web browsing. Subjects were randomly divided into two groups. The first ‘profile feedback’ group had full access to the system and its profile visualization and profile feedback options; the second ‘relevance feedback’ group were denied access to the profile interface. The objective was to measure what difference, if any, visualizing profiles and providing profile feedback makes to the performance of the recommender system. It was found that many in the ‘profile feedback’ group did not provide any profile feedback at all, so in the later analysis these subjects are moved into the ‘relevance feedback’ group.. Experimental data The raw data obtained from the trial occurs at irregular time intervals, based on when subjects looked at recommendations or browsed the web. For ease of analysis, data is collated into weekly figures by summing interactions throughout each week. Group data is computed by summing the weekly contribution of each subject within a group. Figure 12 shows the metrics measured. Recommendation accuracy = No of papers browsed or jumped to No of recommended papers Predicted profile accuracy = No of <future papers> matching <top topics> No of <future papers> Profile accuracy = No of <papers> matching <top topics> No of <papers> <future papers> = browsed/jumped papers in the 4 weeks after profile <papers> = browsed/jumped papers over duration of profile (normally 1 day) <top topics> = top 3 topics of profile. Figure 12. Measured metrics Subject selection for the ‘profile feedback’ group was taken from those subjects who had provided profile feedback,.
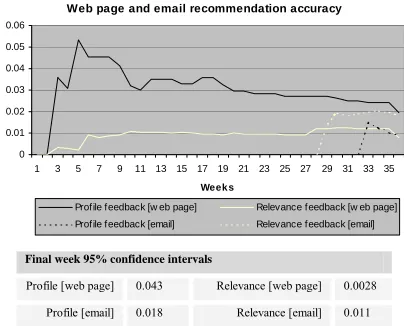
(6) with all other subjects placed into the ‘relevance feedback’ group. There were 9 subjects in the ‘profile feedback’ group and 251 in the ‘relevance feedback’ group. This is representative of the fact that only a fraction of potential subjects chose to invest the time and effort required to get the most out of the system.. topics in a 4 week window after the profile was created. This measures the ability of a profile to predict subject interests. Metrics are measured for every profile computed over the period of the trial, providing a view on how the quality of the profiles varies over the length of the trial. Figure 14 shows the figures for the profile metrics.. Explicit feedback measured includes jumping to search results and jumping to recommendations via the web page interface, interest feedback on search results and feedback on profiles via the profile visualization interface.. While not statistically significant, there is a trend for the ‘profile feedback’ group to have profiles that are better at predicting future browsing interests. This trend is not reflected in the daily profile accuracy figures however, where the two groups are similar. This would appear to show that the two groups are profiling slightly different interest sets, with the ‘profile feedback’ interests of a longer-term nature.. Implicit feedback is obtained from unobtrusive monitoring via the web proxy. The proxy logs are parsed to extract subjects’ browsed URLs, which are recorded with a timestamp. These URLs are later correlated with the research paper database to obtain a set of browsed research papers.. Profile accuracy and profile predictive accuracy 0.5 0.4. Experimental results The recommendation accuracy metric is a measure of the effectiveness of individual recommendations. Email support was added in the last few months of the trial. Figure 13 shows the recommendation accuracy for web page and email recommendations.. 0.3 0.2 0.1 0 1. 3. 5. 7. 9. 11 13 15. 17 19 21 23 25. 27 29 31 33. 35. Weeks. Web page and email recommendation accuracy. Prof ile feedback [profile]. Relevance feedback [profile]. Prof ile feedback [predictive]. Relevance feedback [predictive]. 0.06. Final week 95% confidence intervals. 0.05 0.04 0.03. Profile [profile]. 0.23. Relevance [profile]. 0.036. Profile [predictive]. 0.23. Relevance [predictive]. 0.036. 0.02. Figure 14. Profile accuracy / profile predictive accuracy. 0.01 0 1. 3. 5. 7. 9. 11 13. 15. 17. 19. 21. 23. 25. 27. 29. 31. 33. 35. Week s Profile feedback [w eb page]. Relevance feedback [w eb page]. Profile feedback [email]. Relevance feedback [email]. Final week 95% confidence intervals Profile [web page]. 0.043. Relevance [web page]. Profile [email]. 0.018. Relevance [email]. 0.0028 0.011. Figure 13. Web page / email recommendation accuracy The small number of subjects within the ‘profile feedback’ group accounts for the larger confidence intervals. While not statistically significant, there is an apparent trend for more accurate recommendation when using profile feedback, especially in the earlier weeks. Accuracy tends to fall off over time since users tend to provide most feedback early on. Email recommendations appeared to be preferred by the ‘relevance feedback’ group, slightly outperforming the ‘profile feedback’ group. Profile accuracy measures the number of papers browsed or jumped to that match the top 3 profile topics for the duration of that profile; since profiles are updated daily, the average duration of a profile is one day. This is a good measure of the accuracy of the current interests within a profile. Profile predictive accuracy measures the number of papers browsed or jumped to that match the top 3 profile. In addition to measuring subject group interactions with the system, the AdaBoostM1 boosted IBk classifier performance was computed. A standard cross-validation test was applied to the classifier training set, to obtain the figures for precision and recall. Table 1 shows the results. The precision value is a measure of how many correctly classified documents there were as a proportion of the number classified. The recall value is a measure of how many documents were classified as a proportion of the total number of documents. A 42% precision is reasonable when you consider the number of possible classes the classifier can choose from, and the small size of the training set. Table 1. Classifier precision and recall Classifier. Precision. Recall. Classes. Examples. Terms. 0.42. 1.0. 97. 714. 1152. Discussion of trends The ‘profile feedback’ group outperformed the ‘relevance feedback’ group for most of the metrics, and the experimental data revealed several trends. Web page recommendations, and jumps to those recommendations, were better for the ‘profile feedback’ group, especially early on in the first few weeks after registering. This is probably because the ‘profile feedback’ users tended to draw interest profiles initially, and only.
(7) update them occasionally afterwards. Profiles are thus most accurate early on, becoming out-dated as time goes by. This aging effect on the profile accuracy is shown by the ‘profile feedback’ group performance gradually falling towards that of the ‘relevance feedback’ group. Interestingly, the initial performance enhancement gained using profile feedback appears to help overcome the cold-start problem [9], a problem inherent to all recommender systems. Email recommendation appeared to be preferred by the ‘relevance feedback’ group, especially by users who infrequently checked their web page recommendations. A reason for this could be that since the ‘profile feedback’ group used the web page recommendations more, they needed to use email recommendations less. There is certainly a limit to how many recommendations any user needs over a given time period; nobody regularly checked for recommendations more than once a week. The overall recommendation accuracy was about 1%, or 25% for the profile feedback group; 5% accuracy equates to roughly 1 in 2 sets of individual recommendations containing a downloaded paper. This may appear low, especially when compared to other recommendation systems such as Quickstep, but it reflects the nature of the recommendation service offered, the larger domain and users who had no motivation to use the system other than self-interest. The optional nature of the system assisted uptake and acceptance on a wide scale, as did advertising and word of mouth. However, users simply ignored the recommender if it did not help to achieve their current work goal, quickly giving up if accuracy was too low. Subjects who were often busy preferred emails, since they can be read at a convenient time. The profile accuracy of both groups was similar, but there was a significant difference between the accuracy of profile predictions. This reflects the different types of interests held in the profiles of the two groups. The ‘profile feedback’ group’s profiles appeared to be longer term, based on knowledge of the users general research interests provided via the profile interface. The ‘relevance feedback’ profiles were based solely on the browsing behaviour of the users current task, hence contained shorter-term interests. Perhaps a combination of profile feedback-based longer-term profiles and behaviour-based short-term profiles would be most successful. The overall profile accuracy was around 30%, reflecting the difficulty of predicting user interests in a real multi-task environment. Integrating some knowledge of which task the user is performing would allow access to some of the other 70% of their research interests. These interests were in the profile but did not make it to the top 3 topics of current interest. Profile feedback users tended to regularly check recommendations for about a week or two after drawing a profile. This appeared to be because users had acquired a. conceptual model of how the system worked, and wanted to keep checking to see if it had done what they expected. If a profile was required to be drawn before registering on the system, this behaviour pattern could be exploited to increase system uptake and gain some early feedback. This may in turn increase initial profile accuracy and would certainly leave users with a better understanding of how the system worked, beneficial for both gaining user trust and encouraging effective use of the system.. RELATED WORK Group Lens [6] is an example of a collaborative filter, recommending newsgroup articles based on a Pearson-r correlation of other users’ ratings. Fab [2] is a contentbased recommender, recommending web pages based on a nearest-neighbour algorithm working with each individual user’s set of positive examples. Foxtrot is a hybrid recommender system, combining both types of approach. Personal web-based agents such as NewsDude [3] and NewsWeeder [7] build profiles from observed user behaviour. These systems filter new stories and recommend unseen ones based on content. Personal sets of positive and negative example are maintained for each user’s profile. In contrast, by using an ontology to represent user profiles Foxtrot shares these limited training examples. Digital libraries classify and store research papers, such as CiteSeer [4]. While Foxtrot is a digital library, its content is dynamically and autonomously updated from the browsing behaviour of its users. Very few systems in the recommender system literature perform user trials using real users, making direct comparison difficult. Most use either labelled benchmark document collections to test classifier accuracy or logged user data taken from sources such as newsgroups. NewsWeeder reports a 40-60% classification precision with real users, while Personal Webwatcher [11] reports a 6090% classification precision using benchmark data. Foxtrot’s classifier reports a low 42% precision, but this appears much better when the number of classes is taken into account and the potential this allows for improving profiling via inference and profile feedback. The Quickstep [10] system had a recommendation accuracy of about 10% with real users, and provides a useful system for comparison. Foxtrot manages 2-5% recommendation accuracy, which reflects the different types of subjects involved in the two trials. A recommendation accuracy of 5% means that roughly 1 in 2 sets of individual recommendations contained a paper that was downloaded. This lower accuracy can be accounted when you consider the subjects; Quickstep subjects were willing researchers taken from a computer science laboratory, while the Foxtrot subjects were staff and students of a large department who would only be willing to use the system if it was perceived to offer direct benefits to their work. Most systems in the literature do not attempt such hard and realistic problems..
(8) CONCLUSIONS. REFERENCES. The experiment detailed in this paper provides empirical evidence as to the effectiveness of using an ontological approach to user profiling in an agent-based recommender system. As with the predecessor system Quickstep, Foxtrot uses an ontology to represent user profiles, allowing training examples to be shared and knowledge of interests inferred without the need for direct observation.. [1] Aha, D. Kibler, D. Albert, M. “Instance-based learning algorithms”. Machine Learning, 6:37-66, (1991). Profile visualization and profile feedback was explored as a mechanism to further improve the profiling process, and was found to enhance both profiling accuracy and the resulting recommendation usefulness. The ontological approach to profiling provides a suitable basis to create a profile visualization that is understandable to users. The overall performance of the Foxtrot system was found to be favourably comparable with other recommender systems when the difficult real-world problem domain was taken into account. Roughly 1 in 2 sets of recommendations contained a paper that was downloaded. While the recommendations were far from perfect, the system did provide a useful service to those users who chose to invest time and effort in using the system. Individual aspects of the system could be enhanced further to gain a relatively small performance increase, such as increasing the training set size, fine tuning the ontological relationships and trying alternative classification algorithms. However, the main problem is that the systems profiler is not capturing about 70% of the user’s interests. We expect major progress to come from expanding the ontology and using a task model for profiling. Expanding the ontology to include more relationships than just is-a links between topics would allow much more powerful inference, and thus give a significant boost to profiling accuracy. Knowledge of the projects people are working on, common technologies in research areas and linked research areas would all help. This technology can also help the cold-start problem [9]. Knowledge of a user’s current task would allow the profiler to distinguish between short and long term tasks, separate concurrently running tasks and adjust recommendations accordingly. While 70% of users’ browsing interests were not in the current profile’s top 3 topics, they were in the profile somewhere at a lower level of relevance. Having separate profiles for each user task would allow a finer grained profiling approach, improving performance. This is far from easy to achieve in practice, but it appears to be an important aspect of user profiling and one that future versions of this system may well investigate.. ACKNOWLEDGMENTS This work is funded by EPSRC studentship award number 99308831.. [2] Balabanović, M. Shoham, Y. “Fab: Content-Based, Collaborative Recommendation”. Communications of the ACM 40(3), 67-72, (1997) [3] Billsus, D. Pazzani, M. J. “A Personal News Agent that Talks, Learns and Explains”. In Autonomous Agents 98, Minneapolis MN USA, (1998) [4] Bollacker, K. D. Lawrence, S. Giles, C. L. “CiteSeer: An Autonomous Web Agent for Automatic Retrieval and Identification of Interesting Publications”. In Autonomous Agents 98, Minneapolis MN USA, (1998) [5] Freund, Y. Schapire, R. E. “Experiments with a New Boosting Algorithm”. Proceedings of the Thirteenth International Conference on Machine Learning, (1996) [6] Konstan, J. A. Miller, B. N. Maltz, D. Herlocker, J. L. Gordon, L. R. Riedl, J. “GroupLens: Applying Collaborative Filtering to Usenet News”. Communications of the ACM 40(3), 77-87, (1997) [7] Lang, K. “NewsWeeder: Learning to Filter NetNews”. In ICML95 Conference Proceedings, 331-339, (1995) [8] McCallum, A. K. Nigam, K. Rennie, J. Seymore, K. “Automating the Construction of Internet Portals with Machine Learning”. Information Retrieval 3(2), pages 127-163, (2000) [9] Middleton, S. E. Alani, H. Shadbolt, N. R. De Roure, D.C. “Exploiting Synergy Between Ontologies and Recommender Systems”. International Workshop on the Semantic Web, Proceedings of the 11th International World Wide Web Conference WWW2002, Hawaii, USA, (2002) [10] Middleton, S. E. De Roure, D. C. Shadbolt, N. R. “Capturing Knowledge of User Preferences: ontologies on recommender systems”. In Proceedings of the First International Conference on Knowledge Capture (KCAP 2001), Victoria, B.C. Canada, (2001) [11] Mladenić, D. “Personal WebWatcher: design and implementation”. Technical Report IJS-DP-7472, Department for Intelligent Systems, J. Stefan Institute, (1996) [12] Porter, M. “An algorithm for suffix stripping”. Program 14 (3), pp. 130-137, (1980) [13] Sebastiani, F. “Machine learning in automated text categorization”. ACM Computing Surveys, (2002) [14] SMART Staff “User's Manual for the SMART Information Retrieval System”. Technical Report 7195, Revised April 1974, Cornell University (1974).
(9)
Figure
+2
Related documents
Party system: features and trends – major national political parties in India: ideologies and programmes – coalition politics in India: nature and trends – political parties in
For for-profit firms, it would be expected that exemption from taxes on capital, such as the federal and state corporate income taxes and property taxes, would increase the ratio
We argue that (i) a Markov chain Monte Carlo procedure can implement the algorithm efficiently, (ii) it can detect significant geographical discontinuities in allele frequencies
Study on Logging Interpretation Model and Its Application for Gaotaizi Reservoir of L Oilfield.. Lei Xu1, Pengju Li1,
With these insights in mind, I then examine the Court’s freedom of religion case law, identify the underlying assumptions about religion and about certain religious groups, and
Without effective institutions and facilities, countries will fail to exploit the opportunities of the global economy.[9] One of the opportunities of globalization
A systematic review of the literature was performed in order to identify, select, evaluate and synthesize research evidence in order to systematize the state of knowledge of
2 Detailed scale drawings, including plan views and elevations of all space only stands must be submitted to the event organiser prior to the event, so that they may ensure that
