University of Warwick institutional repository
This paper is made available online in accordance with
publisher policies. Please scroll down to view the document
itself. Please refer to the repository record for this item and our
policy information available from the repository home page for
further information.
To see the final version of this paper please visit the publisher’s website.
Access to the published version may require a subscription.
Authors:
Steve StrandArticle title: The limits of social class in explaining ethnic gaps in
educational attainment
Year of
publication:
2009
Link to
published
version:
http://www.tandf.co.uk/journals/carfax/01411926.html
Publisher
statement:
The limits of social class in explaining ethnic gaps in educational attainment
Paper accepted for publication in the
British Educational Research Journal.
Please cite as Strand. S. (in press). The limits of social class in explaining ethnic
gaps in educational attainment.
British Educational Research Journal, in press.
Accepted for publication 4/12/2009. Estimated date of publication: 18 months.
Dr Steve Strand Associate Professor Institute of Education University of Warwick
England, UK Tel: 044 24 7652 2197 e-mail:[email protected]
Running Head: The limits of social class ...
The limits of social class in explaining ethnic gaps in educational attainment
ABSTRACT
This paper reports an analysis of the educational attainment and progress between age 11 and age 14 of over 14,500 students from the nationally representative Longitudinal Study of Young People in England (LSYPE). The mean attainment gap in national tests at age 14 between White British and several ethnic minority groups were large, more than three times the size of the gender gap, but at the same time only about one-third of the size of the social class gap. Socio-economic variables could account for the attainment gaps for Black African, Pakistani and Bangladeshi students, but not for Black Caribbean students. Further controls for parental and student attitudes, expectations and behaviours indicated minority ethnic groups were on average more advantaged on these measures than White British students, but this was not reflected proportionately in their levels of attainment. Black Caribbean students were distinctive as the only group making lessprogressthan White British students between age 11 and 14 and this could not be accounted for by any of the measured contextual variables. Possible
explanations for the White British-Black Caribbean gap are considered.
INTRODUCTION
Public concern about the attainment of ethnic minority groups has been long standing both in the UK and US. The seminal work of the Coleman report (1966) was the first to report a comprehensive collection of nationally representative data across the US. Verbal and non-verbal reasoning, reading and mathematics tests were completed at age 8, 11, 14 and 17. The results revealed a consistent picture where “the black student averages tend to be about one standard deviation below those of whites” (p219). Early work in the UK was summarised in the Swann report (1985) which concluded that Black Caribbean children “as a group are
African, Black Other, Pakistani and Bangladeshi students are below the mean for their White British peers, while the mean scores for Chinese, Indian and Irish students are higher than the mean of their White British peers.
The most frequently cited explanation for ethnic gaps in educational attainment relates to the substantial differences in socio-economic status between Black and White groups. For example the US Census reports 8% of Whites living in poverty compared to 11% of Asians, 22% of Hispanics and 25% of both Blacks and Native Americans (US Census Bureau, 2006). In England the Labour Force Survey 2004/05 defines 20% of White British households as being in income poverty compared to 25% of Indian, 30% of Black Caribbean, 45% of Black African, 55% of Pakistani and 65% of Bangladeshi households (Kenway & Palmer, 2007).
Socioeconomic disadvantage may have a direct influence on children’s development, for example through limited material resources and an increased risk of a range of health and developmental problems, and an indirect influence through parental education, expectations and aspirations (e.g., McLoyd, 1998).
However large scale representative studies have had mixed success in eliminating the attainment gap using controls for socio-economic status. Phillips, Brooks-Gunn, Duncan, Klebanov and Crane (1998) in an extensive analysis of the survey of the Children of the National Longitudinal Study of Youth (CNLSY) report traditional socio-economic measures account for no more than one-third of the Black-White test score gap at age 5/6 years. Further controls for a broader range of family environment and parenting practices were more
(2000) using the Youth Cohort Study report that at age 16 ethnic gaps still persist even when gender and social class were taken into account. Wilson, Burgess & Briggs (2005) analyse national data on examination results at age 16 and report that Black Caribbean pupils still had lower attainment than White British students after control for age, poverty, gender, special educational needs and neighbourhood deprivation (although the difference was less than -0.10 SD). However as with younger students factors other than SES, such as parental involvement and educational aspirations, may account for more of the gap (e.g., Yan & Lin, 2005, Strand & Winston, 2008).
National population data are powerful in establishing the existence of ethnic gaps in educational attainment. However population data typically contain very limited contextual data to help interpret these results, breadth comes at the price of depth. Research is needed using longitudinal datasets that combine the benefits of nationally representative samples with detailed and rich data on possible explanatory factors. This is particularly the case in England where there has been no longitudinal study covering educational attainment in adolescence since the Birth Cohort Study of 1970. The Longitudinal Study of Young People in England (LSYPE) offers the opportunity to explore these issues with a recent and large nationally representative sample. The LSYPE interviewed a representative sample of over 15,000 young people aged 14 years in 2004. It also interviewed their parents/guardians and collected a wide range of quantitative data about the students, their families and their school and neighbourhood contexts. The primary aim of this paper is to focus on the relationships between various
student, family, school and neighbourhood factors and educational attainment and progress in the first three years of secondary school (age 11 to age 14), with a particular focus on
understanding the reasons for differences in the educational attainment and progress of different ethnic groups. The following specific research questions are posed:
What are the size of ethnic gaps in educational attainment at age 14, and in educational
progress between age 11 and age 14?
What other student, family, school and neighbourhood factors are significantly associated
with attainment and progress?
Can these factors account for (statistically explain) differences in the educational attainment
METHODOLOGY
Sample
The dataset used here is wave 1 of the Longitudinal Study of Young People in England
(LSYPE). Wave 1 occurred in summer 2004, and the target population was young people born between 1stSeptember 1989 and 31stAugust 1990 and attending Year 9 (US Grade 8) in all schools in England. LSYPE used a two stage sampling procedure. At the first stage a sample of schools was drawn with probability proportionate to size from a stratified frame by school
deprivation status. Deprived schools, defined as those in the top quintile of the percentage of students entitled to free school meals, were over-sampled in the ratio 1.5:1. Schools were also stratified by region and by school admission policy (comprehensive, selective and secondary modern). At the second stage a sample of students in Y9 was drawn from the school rolls along with their parental and address details. Sample boosts took place for ethnicity at the student level with boosts made in the following six groups: Black African; Black Caribbean;
Bangladeshi; Indian; Pakistani and Mixed heritage. The method used delivered both a constant sampling fraction for each sub-population and a fixed cluster size and therefore avoided
precision losses through corrective (design) weighting and excessive variation in cluster sizes.
While the total LSYPE sample was 15,770 households, not all cases were eligible for inclusion in this analysis of attainment at age 14. 938 students had no recorded age 14 test scores, including all 530 students drawn from private schools where national tests are optional. Additionally 329 students were not interviewed or refused to give their ethnicity so the eligible sample was 14,503 students drawn from 629 schools with an average number of students per school of 22.7 (range 1 to 45, SD 5.3). In the analyses to follow the data have been weighted to compensate for differential selection chances in the sample design and to remove
non-response biases. Non non-response weights were calculated through comparison of respondents to School Census student level population data. The combined design and non-response weights are applied using the SPSS Complex Samples module V15.0. Deprivation status was included as a separate stratum selected with unequal probability (1.5:1) and school (the primary
Measures
Educational attainment
Age 14 average test score:At the end of Year 9 students complete national tests in English, mathematics and science. The actual test marks obtained by each student, and the test tier to which they were entered, were used to generate ‘fine grained’ test levels on a decimal scale. These fine grained levels were then converted to points scores to give differentiated outcome measures and were combined to create an average points score which was normally
distributed with a mean of 33.5 and SD of 6.7 (range 15.0 - 48.8). Each point score
corresponds to roughly four months progress in terms of the original conception of a National Curriculum level as representing two years of educational progress (TGAT, 1988). This was the dependent variable in models ofeducational attainment.
Age 11 average test score:At the end of Year 6 all students in England complete national tests in English, mathematics and science. There are a total of eight tests in reading, writing,
spelling, mathematics with and without a calculator, mental mathematics, and two tests in science. The total test marks obtained by each student were summed across all tests and the resulting total was subject to a normal score transformation so the mean age 11 test score is represented by zero with a SD of 1. Including this variable in regression models along with the pupils’ age 14 average test score gave a measure of pupils’ educational progress.
Measures derived from LSYPE
LSYPE data collection was based on separate 45 minute face-to-face interviews with the young person and with their parents, conducted in the respondents own home.A shorter 10 minute interview with the second parent (where present) covered only employment details and employment history. An initial analysis of the LSYPE data created a set of variables that were both (i) significantly associated with educational attainment at age 14, and (ii) varied
significantly across different ethnic groups (see Strand, 2007 for detail). The variables are organised into four blocks based on a theoretical model of the nature of various influences on educational attainment (Powdthavee, Levacic & Vignoles, 2006). The four main blocks were composed of:
Family background: Structural features such as the social class of the home, maternal
Parental attitudes and behaviour. A set of variables entered before any individual
student variables on the presumption that family influences logically precede or at least create the context for individual student attitudes and behaviour.
Student risk and protective factors: these included both risk factors which were
associated with an increased likelihood of low attainment at age 14, and protective factors including attitudes or motivations that were positively associated with high attainment.
School context and neighbourhood deprivation: These were entered last to determine
whether school or neighbourhood deprivation had any effect over and above the influence of individual and family factors.
The division of variables between these blocks is not a rigid demarcation but is a useful way of structuring the wide range of data available through LSYPE. Twenty-seven specific variables were created and are described in detail in Appendix 1.
Analytical approach
The data are analysed in a multiple regression framework which identifies the unique (net) contribution of particular variables to variation in educational attainment while other background variables are controlled. This is important because differences in attainment between ethnic groups may be attributable to the impact of socio-economic and demographic factors, as described in the introduction. The analysis adopts a hierarchal approach by sequentially entering the four blocks of variables described above. While there is a substantial body of research establishing the relation between structural variables such as social class and
educational attainment (e.g. Sirin, 2005), there is relatively little evidence of the mechanisms or the more proximal influences through which this association is mediated. By entering the structural factors first, it is possible to explore the subsequent effect of entering more dynamic family or individual measures. If these more proximal measures influence or mediate the effect of social class we might expect the inclusion of these variables to both improve the prediction of educational attainment and to reduce the relative impact of socio-economic variables. This may also help to better understand how socio-economic effects on attainment are mediated.
Treatment of missing data
been calculated as continuous scales (such as academic self concept and attitude to school) were divided into discrete categories. This has advantages since it: (i) prevents the loss of explanatory power that would come from listwise deletion;(ii) allows for the direct modelling of missing data rather than imputing values, for example by mean substitution, which has its own interpretative problems; (iii) allows for non-linearities in the relationships with attainment; (iv) can simplify the interpretation of the relationships with attainment, since we can directly contrast different groups; and (v) ensures a consistent base in terms of the sample size across a range of hierarchical regression models including increasingly large number of explanatory variables.
RESULTS
Comparison of mean scores at age 14
Analyses were completed separately for each of the English, mathematics and science tests. The results revealed a consistent picture with the mean scores for Pakistani, Bangladeshi, Black Caribbean and Black African groups significantly lower than for White British students in all three subjects. Pakistani students had a particularly low mean score in English, and Black Caribbean students a particularly low mean score in mathematics, relative to all other ethnic groups. However given the consistent pattern across subjects subsequent analyses will focus on age 14 average test score.
Table 1 presents the mean and SE of the average age 14 test score by ethnic group, social class and gender. In relation to ethnic group, the mean score for Indian pupils was slightly higher than for White British students (p<.05) and there was no significant difference between the mean scores for White British, Mixed heritage and Any Other ethnic group. However the mean score for Pakistani, Bangladeshi, Black African and Black Caribbean students were all significantly lower than for White British students by around three points. This is equivalent to over a whole year of progress in terms of the definition of NC levels. Thus ethnic group differences in attainment at age 14 are substantial.
contrast to the attention paid to each of these ‘gaps’ in the UK media, who focus almost exclusively on the gender gap.
< --- Insert Table 1 about here ---- >
However ethnicity and social class are themselves correlated, so that at least in part the ethnic gaps may reflect average differences in social class. Appendix 2 presents a breakdown within each ethnic group of the proportion of students at all levels of the explanatory variables
described in Appendix 1. This shows for example that (when excluding missing cases) 42% of White British students are from homes in the top two social classes, compared to 37% of Black Caribbean, 36% of Black African, 29% of Indian, 19% of Pakistani and only 9% of Bangladeshi students. At the other end of the scale, the proportion of students from homes where the head of the household has never worked or is long term unemployed is 3% for White British but 7% for Indian, 8% for Black Caribbean, 23% for Pakistani, 26% for Black African and 40% for Bangladeshi households. A fuller description and discussion of this descriptive data is contained in Strand (2007). The next section uses multiple regression analyses to attempt to identify the net influence of ethnicity in relation to attainment.
Contextual analysis of attainment at age 14
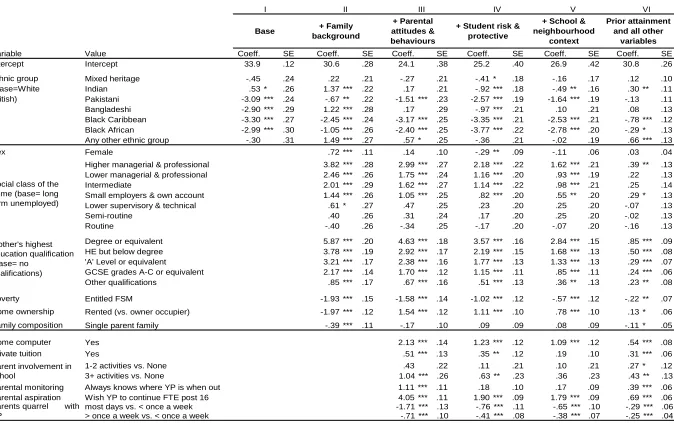
Table 2 presents the results of the multiple regression analyses for age 14 average test score. Model I includes only ethnic group as an explanatory variable and shows the simple association between ethnic group and age 14 test score before taking account of any other variables. The model shows a statistically significant and substantial association between ethnicity and attainment, as already described.
Model II - Family background
with entitlement to FSM (-2.0 points), being in rented rather than owned accommodation (-1.9 points) and being in a single parent family (-0.4 points).
Generally, after taking account of family background, Indian and Bangladeshi students achieve higher results than would be expected given their socio-economic circumstances. For Pakistani students the extent of underachievement relative to White British students is reduced by 80% from -3.1 to -0.7 points, and for Black African students by 66% from -3.0 to -1.1 points. What is notable is how small the impact of these controls is on the attainment of Black Caribbean
students. The Black Caribbean coefficient has only dropped by 25% from -3.3 to -2.5 points and is still substantially below the White British mean even after accounting for the social class of the home, gender, maternal education, entitlement to FSM, home ownership and single parent status.
< --- Insert Table 2 about here ---- >
Model III: Parental attitudes and behaviours
This block added six further variables to the model, all of which were positively associated with attainment. Parental expectations that the student would continue in FTE post 16 was
associated with higher attainment (4.0 points), as was providing a home computer (2.1 points), a low level of quarrelling with the student (1.7 points), a high level of parental involvement with the school (1.0 point), parental supervision (1.1 points) and providing private tuition (0.5 points). Overall adding these variables provided a modest boost to the explanatory power of the model raising the percentage of the variance explained from 25% to 34%. These changes tended on the whole to impact negatively on the coefficients for all minority ethnic groups. This is because most groups were more advantaged on these measures than the White British group. On average minority ethnic parents were more likely to have paid for private tuition, more involved with their child’s school, had higher educational aspirations for their children, were more likely to know where their children were when they were out and less likely to quarrel with the children (see Appendix 1). All these are generally advantaging factors, as shown by the above coefficients, but they were not associated with proportionately greater attainment within the minority ethnic groups.
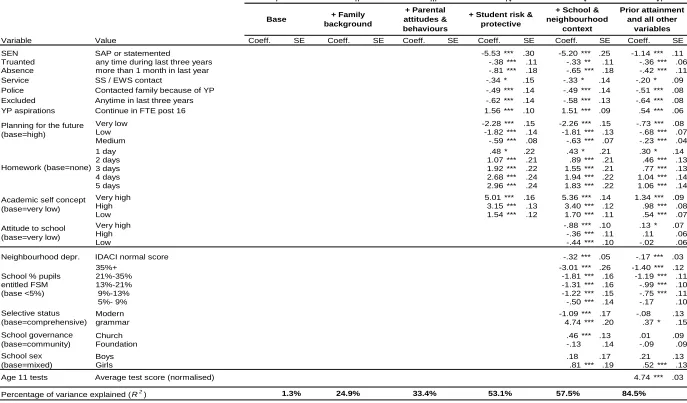
Model IV - Student risk and protective factors
between the top and bottom bands; homework with a 3.0 point gap between those completing homework every evening vs. those never completing homework; planning for the future with 2.3 point gap between the top and bottom bands and student educational aspirations with a 1.6 point boost for those students planning to continue in FTE post 16. There were negative associations of attainment with extended absence from school (-0.8), being excluded (-0.7), involvement with the police (-0.5), truanting (-0.3) and Social Service or EWS contact because of the student’s behaviour (-0.3). Interestingly a positive attitude to school was negatively associated with attainment, though it was positively associated with progress age 11-14 (see model VI, Table 2).
Again the net effect of including these variables was (with the exception of Black Caribbean students) to further depress the coefficients for minority ethnic groups relative to White British. The coefficients for Indian, Pakistani, Bangladeshi and Black African groups relative to White British all declined by over 1.0 point relative to Model III. Again this is because most minority ethnic groups were more advantaged on these measures than White British students. On average minority students were more likely to aspire to continue in education post 16, to have a positive academic self concept, to plan for the future and to have a positive attitude to school, and less likely to have been excluded (except Black Caribbean students) or to have had extended absence (except Pakistani students). All these are advantaging factors across the sample as a whole, as shown by their coefficients, but they were not associated with
proportionately greater attainment within the minority ethnic groups.
Model V - School and neighbourhood context
neighbourhood deprivation (IDACI score) has a significant association with attainment with a 0.6 point difference between those living in neighbourhoods one SD above the mean
deprivation compared to those living in neighbourhoods one SD below the mean deprivation.
Minority ethnic students were much more likely to attend deprived schools, less likely (except Indian students) to attend grammar schools, more likely to attend single-sex girls schools and lived in substantially more deprived neighbourhoods than White British students. As a result the gaps for Pakistani, Bangladeshi, Black Caribbean and Black African groups relative to White British closed by roughly 1.0 point compared to Model IV, but were still substantial. Looking at the ethnic coefficients, the contextual variables effectively account for the low attainment of the Bangladeshi group. They also explain a substantial part of the low attainment of Pakistani students who still appear to underachieve by -1.5 points, but this is half the -3.0 point difference in unadjusted attainment. However the success of the model in accounting for the low
attainment of Black Caribbean and Black African students is much smaller. Even after including all the contextual variables these groups are still achieving around -2.5 points less than would be expected given their family, student, school and neighbourhood context. Indian students are also underachieving since although their unadjusted age 14 score is 0.55 of a point above that of White British students, it is -0.50 of a point below what might be expected given the family, student, school and neighbourhood contexts.
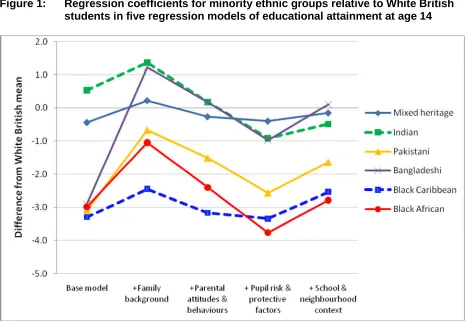
Figure 1 presents a summary of the ethnic coefficients over the five models. Confidence
intervals around these means are not shown, but can be inferred from the standard errors given in Table 2.
< --- Insert Figure 1 about here ---- >
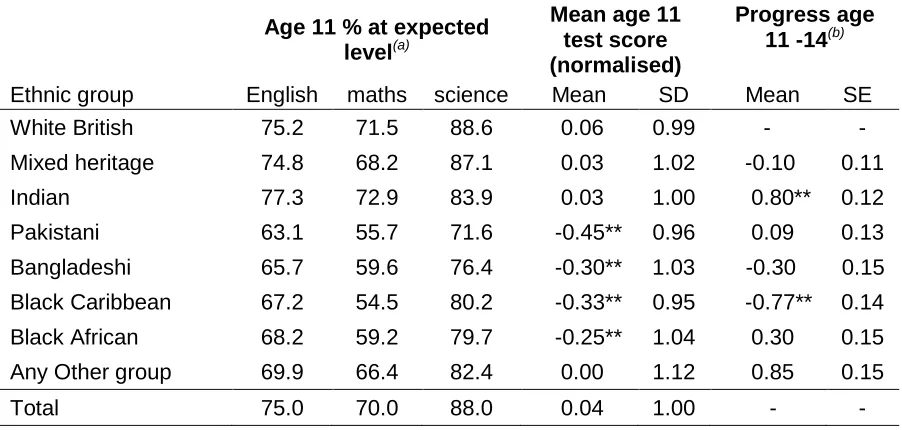
Educational progress age 11-14
The models described so far have sought to explain differences in educational attainmentat age 14. By adding each student’s prior attainment at age 11 the model addresses differences ineducational progressage 11-14. This section asks whether there are differences between ethnic groups in progress age 11-14, and if so whether the differences can be explained by the contextual variables available in the LSYPE dataset.
one-third of a SD lower and the mean for Black African students was one-quarter of a SD below the mean for White British. Prior attainment is an extremely powerful predictor of later attainment (the correlation between students’ age 11 and age 14 average test score is .89) so age 11 average test score can account for 79% of the variance in age 14 average test score. The last two columns give a measure of progress age 11-14. The substantial ethnic gaps at age 14 for Pakistani, Bangladeshi and Black African students reflect earlier differences already existing at age 11: the gaps relative to White British students neither widen nor lessen during the first three years of secondary school. For these groups it is therefore essential to explore influences occurring during primary school to better understand the nature of the gaps. There are however two ethnic groups where the gaps actually grow during the first three years of secondary
school: Indian students make 0.80 points more progress than White British students pulling further aheadthan they were at age 11, and Black Caribbean students make 0.77 points less progress than White British students fallingfurther behindthan they were at age 11.
< --- Insert Table 3 about here ---- >
To explore whether these difference in educational progress can be explained by the contextual variables, Model VI in Table 2 adds age 11 score to all the other explanatory variables to form a contextual value added model. Because prior attainment accounts for so much of the variance in age 14 score, the coefficients for most explanatory variables are smaller than they were in the model V. However there are still statistically significant associations between the contextual variables and student progress.
Family background: Students from higher managerial and professional homes made more progress (0.4) than students from households where the main parent was long term
unemployed, as did students from the small employers/self-employed group (0.3), but none of the other contrasts are significant. Students of mothers educated to degree level made more progress (0.9) than those with mothers with no qualifications, and there were significant but decreasing boosts associated with mothers with higher education but below degree (0.5), ‘A’ level or equivalent (0.3), GCSE 5+ A*-C or equivalent (0.2) and with other qualifications (0.2). Students entitled to FSM made less progress (-0.2) than their peers not entitled to FSM.
Student risk and protective factors:All the variables have a significant association with
progress, most notably: students in the top band of academic self-concept make more progress (1.4) than those in the bottom band; students completing any amount of homework make more progress than those completing none, ranging from 1.1 points for those completing homework every weekday evening to 0.3 for those completing homework only one evening a week; Students with identified SEN make less progress (-1.2) than their peers without SEN; students who plan for the future make more progress (0.7) than those who do not plan; students ever excluded from school make less progress (-0.7) than those never excluded; students whose behaviour has led to the involvement of the police make less progress (-0.5); students who aspire to continue in FTE after the age of 16 make more progress (0.5), students who have had long term absence make less progress (-0.4); students who have truanted during the key stage make less progress (-0.3); students whose behaviour has led to social services/EWS
involvement make less progress (-0.2), and students in the top band for attitude to school make more progress (0.1) than those in the bottom band.
School and neighbourhood context: students in the most deprived schools make less progress (-1.4) than those in the least deprived schools; students attending grammar schools make more progress (0.4) than students attending comprehensive schools; girls in single sex schools (but not boys in single sex schools) make more progress (0.5) than students in mixed sex schools; and over and above the impact of individual and school disadvantage, students living in more deprived areas make less progress (-0.3) than those living in better off areas (contrast between +/- 1 SD of IDACI score).
With respect to ethnic group, and once all the above contextual factors are included, the better progress of Indian students relative to White British students is somewhat moderated (0.30 points) though still highly statistically significant. The poor progress of the Black Caribbean students relative to White British is not explained at all, remaining at around -0.80 points. Black African students also appear to make less than expected progress relative to similar White British students, although the statistical significance of the effect is much lower (-0.29 points, p<.05).
Interactions between ethnic group, gender and social class
class interactions were also investigated but were relatively weak, and the ethnic gaps were highly significant at all levels of social class.
DISCUSSION
Contextualising ethnic gaps in educational attainment at age 14
This research has reported wide variation in educational attainment at age 14 between different ethnic groups. Pakistani, Bangladeshi, Black Caribbean and Black African groups achieve an average age 14 score around 3.0 points below the White British group, equivalent to around a whole year of progress in terms of the TGAT framework (1988). Explanations of these gaps in terms of socio-economic status (social class of the home, maternal education, gender, poverty, home ownership and single parent status) have mixed success in accounting for the gaps. Indian and Bangladeshi students achieve higher results than would be expected given their social class and maternal educational qualifications. The Pakistani gap relative to White British students is reduced by over 80%, and the gap for Black African students is reduced by two-thirds. However the low attainment of the Black Caribbean group is not substantially reduced, and their mean KS3 score remains -2.5 points below the comparable White British mean. Socio-economic status therefore does not provide an adequate account of all ethnic group differences in attainment at age 14.
As well as the family background variables, further contextual models included more subtle measures such as parental involvement in school, parents’ and students’ educational aspirations, students’ academic self concept, amount of homework completed, attitudes to school and a wide range of educational risk factors, as well as school and neighbourhood deprivation. This doubled the predictive power of the model. However model V could not fully account for the low attainment of the Pakistani group and was particularly poor at explaining the low attainment of Black Caribbean and Black African groups. Controlling for these parental and student variables substantiallydepressed the attainment of all minority ethnic groups relative to White British students. Minority ethnic groups were generallymoreadvantaged than White British students on many of these parental and student variables but they did not see the proportionately greater attainment expected.
greater poverty, are more likely to live in rented accommodation, to have identified SEN, to be temporarily excluded from school, are less likely to complete four evenings or more of
homework and are more likely to attend schools that are more deprived and live in more deprived neighbourhoods. In terms of advantaging factors relative to White British students, Black Caribbean students (and their parents) have higher educational aspirations, have a more positive attitude to school, a higher academic self concept and are more likely to be actively planning for the future. However, this extensive set of variables does not provide an explanation of the low attainment of the Black Caribbean group.
Ethnic gaps in student progress age 11-14
Much of the difference between ethnic groups in attainment at age 14 can be accounted for by pre-existing differences at age 11. To address ethnic differences at age 14 a key focus should be on processes occurring during the primary school phase, since the age 14 differences are largely replications of ethnic group differences already apparent at the end of primary school. However there were two ethnic groups of particular interest in that their gaps relative to the White British group actually widen between age 11 and age 14. These are Indian students who pull further ahead of their White British peers than they were at age 11, and Black Caribbean students who fall even further behind their White British peers than they were at age 11.
The greater progress of Indian students is partly explained by advantaging factors in their family and home lives. Indian students are the ethnic group most likely to complete homework five evenings a week (32% vs. 19% White British); the group most likely to have a home computer (94% vs. 90%); the group most likely to pay for private lessons (25% vs. 11%); the group where parents are most likely to say they always know where their child is when they are out (92% vs. 82%); the group least likely to have a identified SEN (5% vs. 8%); the group least likely to truant (8% vs. 16%); the group least likely to have had social services or EWS contact (3.5% vs. 8%), and lastly, the group least likely to have been excluded from school (4% vs. 11%). Against this there are also disadvantaging factors, for example only 28% of Indian students are from the top two social classes compared to 41% of White British students, the mothers of 46% of the Indian students had no educational qualifications compared to 16% of White British students, they are more likely to attend the most disadvantaged schools (18% vs 6% White British students) and to live in more deprived neighbourhoods (35% in the most disadvantaged quartile and only 13% in the least disadvantaged quartile). These factors
‘protective factors’ in relation to the educational attainment and progress that have also been suggested for British Chinese students (e.g., Francis & Archer, 2005) and Asian Americans (Yan & Lin, 2005).
In contrast, the measured contextual factors do not account for the poor progress made by the Black Caribbean group which remained at -0.78 points. Expressed in NC months of progress, this indicates Black Caribbean students made around three months less educational progress than would be predicted from their prior attainment and all other student, family school and neighbourhood factors. In terms of social class and mothers’ educational qualifications, differences between Black Caribbean and White British groups are relatively small. Black Caribbean students are substantially more likely to live in single parent households, but this variable was not significantly related to educational progress. Relative to White British students Black Caribbean students on average experience greater poverty, live in more deprived
neighbourhoods, are more likely to have identified SEN, more likely to be excluded from school and were the group that completed the least homework. However these factors do not appear to account for their poor educational progress.
Explanations of ethnic gaps
Phillips et al. (1998) report that socio-economic status, including racial disparities in family income, wealth, parental education and school resources, explain only about a third of the black-white test score gap for six year olds, and conclude that “reducing economic inequality between black and white parents would probably not reduce the black-white gap much” (p138). The current research suggest similar conclusions may be reached for some UK minority ethnic groups, since the broad range of SES variables could not explain the low attainment of the Black Caribbean group. Increasingly there is a move to explaining the ethnic group variation in attainment that remains after the effects of parental social class and/or maternal education are statistically removed. For example Phillips et al. (1998) also report that also including
since the higher aspirations and motivations among many ethnic minorities do not seem to return the proportional gains in terms of attainment that they do for White British students. Thus while social class and its correlates are important predictors of educational attainment they have limited success in explaining the differences in attainment between White British and the Black Caribbean and Black African groups.
It is therefore necessary to look at wider explanations of ethnic group differences in attainment, beyond those captured by the specific variables described above. For example it has been argued that the perceptions of teachers, acquired in the staffroom and the classroom through disciplinary problems with previous students, engender low expectations about the behaviour and academic potential of Black Caribbean students and can lead teachers to interpret certain behaviours more negatively than similar behaviour from White British students (Gillborn, 1990). Students are assumed to react to this discrimination by becoming demotivated or
confrontational. This reinforces the social stereotyping by teachers and a vicious spiral ensues. In addition, the concept of indirect or ‘institutional racism’ has also become prominent, moving beyond individualistic conscious intent to encompass organizational arrangements that may have nothing to do with ethnicity directly, but may nevertheless have disproportionate negative impacts on some ethnic groups (Gibson & Youdell, 2000). Other authors argue that racism, at least in the overt sense, cannot be a complete explanation for ethnic group differences in attainment. Modood (2003) argues “If racism leads to victims being turned off school and dropping out, why do Asian men and women have such high staying-on rates and make academic progress? While recognizing that there are differences in the racism experienced by Caribbean and Asian groups, Asian students experience more frequent and more violent racial harassment from other students than do Caribbean students (yet) this high level peer racism and bullying does not stop Asian students from persisting with high levels of motivation and performance” (Modood, 2003, p58). This does not discount the possibility of social stereotyping or institutional racism against some ethnic groups, but does highlight the importance of
considering how well general explanations apply to different minority ethnic groups.
A further category of explanations allows that differences in attainment are at least partially to do with what students bring into the school with them. In explaining the relatively high
students derive positive self-esteem from constructing themselves as good students. Similar arguments are made in relation to Indian and to ‘African Asian’ groups in the UK (Modood, 2003). Cultural explanations are also proposed for the low attainment of some minority ethnic groups. For example, Sewell (1997) observes that Black Caribbean boys may experience considerable pressure by their peers to adopt the norms of an ‘urban’ or ‘street’ subculture. More credence is given to unruly behaviour with teachers and antagonistic behaviour with other students than to high achievement or effort to succeed, particularly at secondary school
(Haynes et al., 2006). A highly influential paper by Fordham and Ogbu (1986) argues that notions of ‘acting White’ or ‘acting Black’ become identified in opposition to one another. Hence because acting White includes doing well at school, acting Black necessarily implies not doing well in school. Aspects of this view have been reflected in concerns about the development of ‘gangsta’ culture and the absence of positive Black male role models at home as well as in schools (e.g. Abbott, 2002). However there is variable empirical support for Fordham and Ogbu’s ethnographic claims when tested on wide and representative samples (e.g. Cook & Ludwig, 1998; Fryer & Torelli, 2005).
In conclusion, the results indicate the low attainment and poor progress of Black Caribbean students cannot be accounted for by social class or indeed by a wide range of student, family, school and contextual variables. The results mitigate against common explanations of Black Caribbean-White British gap related to socio-economic deprivation, parental involvement or student attitudes to school. Other explanations involving teacher expectations, institutional racism and cultural differences have been introduced. In relation to these claims a further analysis of the LSYPE data in relation to school practices, particularly entry to different tiers in national tests, is reported in a separate paper (Strand, 2009). This suggests that in-school factors, such as teacher expectations, do play a significant part in understanding the relative gap for Black Caribbean students.
References
Abbott, D. (2002).Teachers are failing black boys. The Observer, 6thJanuary 2002. http://education.guardian.co.uk/racism/story/0,,629469,00.html
Caplan, C., Choy, M., & Whitmore, J. (1991). Children of the boat people: A study of educational success. Ann Arbour: University of Michigan Press.
Cook, P. J., & Ludwig, J (1998).The burden of “acting white”: Do black adolescents disparage academic achievement?In Jenks, C. & Philips, M (Eds). The Black-White test score gap. Washington: Brookings Institution Press.
Demack, S., Drew, D., & Grimsley, M. (2000). Minding the gap: Ethnic, gender and social class differences in attainment at 16, 1988-95. Race, Ethnicity and Education, 3(2), 117-143. DfES (2006).Ethnicity and education. London: DfES. Available of the world wide web at:
http://publications.teachernet.gov.uk/eOrderingDownload/DFES-0208-2006.pdf
[accessed 27th June 2007).
Fordham, S. & Ogbu, J. (1986). Black students school success: Coping with the burden of ‘acting White’.Urban Review, 18, (3), 176-206.
Francis B. & Archer L. (2005) British-Chinese students’ and parents’ constructions of the value of education,British Educational Research Journal, 31, (1), 89-108.
Fryer, R. G., & Levitt, S. D. (2004). Understanding the Black-White Test Score Gap in the First Two Years of School.Review of Economics and Statistics, 86(2), 447-464.
Fryer, R. G., & Torelli, P. (2005). An empirical analysis of 'Acting White': NBER Working Paper Series, Vol. w11334. Available at SSRN:http://ssrn.com/abstract=723303.
Gillborn, D. (1990)Race, Ethnicity and Education: Teaching and learning in multi-cultural schools. London: Unwin Hyman.
Gillborn, D. & Youdell, D. (2000).Rationing education: Policy, practice, reform and equity. Buckingham: Open University Press.
Haynes, J., Tikly, L. & Caballero, C. (2006). The barriers to achievement for White/Caribbean students in English schools.British Journal of Sociology of Education, 27, (5), 569-583. Hedges, L. V., & Nowell, A. (1998). Black-White test score convergence since 1965. In C.
Jenks & M. Phillips (Eds.),The Black-White test score gap(pp. 149-181). Washington, DC: Brooking Institution Press.
Jencks, C. & Philips, M. (1998).The Black-White test score gap. Washington: Brookings Institution Press.
Kenway, P., & Palmer, G. (2007).Poverty among ethnic groups: How and why does it differ? York: Joseph Rowntree Foundation.
KewallRamani, A., Gilbertson, L., Fox, M., & Provasnik, S. (2007). Status and trends in the education of racial and ethnic minorities (NCES 2007-039).Washington, DC: National Centre for Educational Statistics, Institute of Educational Sciences, US Department of Education.
Modood, T. (2003).Ethnic differentials in educational performance. In Mason, D. (2003) (Ed). Explaining ethnic differences: Changing patterns of disadvantage in Britain. Bristol: Open Press.
Phillips, M., Brooks-Gunn, J., Duncan, G., Klebanov, P., & Crane, J. (1998). Family
background, parenting practices, and the Black-White test score gap. In C. Jenks & M. Phillips (Eds.), The Black-White test score gap (pp. 229-272).Washington DC:
Brookings Institution Press.
Powdatheee, N. Levacic, R. & Vignoles, A. (2006). The influence of family and social factors on educational attainment: A review of UK quantitative studies. London: Institute of
Education.
Sewell, T. (1997). Black masculinity and schooling: How black boys survive modern schooling. Stoke on Trent: Trentham books.
Sirin, S. R. (2005). Socioeconomic status and academic achievement: A meta-analytic review of research.Review of Educational Research, 75, (32), 417-453.
Strand, S. (1999). Ethnic group, sex and economic disadvantage: Associations with students’ educational progress from Baseline to the end of Key Stage 1. British Educational Research Journal, 25, (2), 179-202.
Strand, S. (2007).Minority ethnic students in the Longitudinal Study of Young People in England. DCSF Research Report RR-002.London: Department for Children, Schools and Families. Available online at:
http://www.dfes.gov.uk/research/data/uploadfiles/DCSF-RR002.pdf (128 pages). Strand, S. (2009).In-school factors and the White British-Black Caribbean attainment gap:
Test, tiers and unintended consequences of assessment practice. Paper presented at the Annual Conference of the American Educational Research Association, San Diego, California, 13-17 April 2009.
Strand, S. & Winston, J. (2008). Educational aspirations in inner city schools. Educational Studies, 34, (4), 249-267.
Swann Report (1985). Education for all.The report of the committee of enquiry into the education of children from ethnic minority groups. London: HMSO.
Sylva, K., Melhuish, E., Sammons, P., Siraj-Blatchford, I. & Taggart, B. (2004). The Effective Provision of Pre-School Education (EPPE) project: Final Report. London: Department for Education and Skills.
TGAT (1988).Task Group on Assessment and Testing. London: Department for Education and Science.
Table 1: Mean and SE of age 14 average test score by ethnic group, gender and social class
Variable Value Mean SE
Un-weighted N
Ethnic group White British 33.9 .12 9406
Mixed heritage 33.4 .24 754
Indian 34.4 .26 990
Pakistani 30.8 .23 918
Bangladeshi 31.0 .27 703
Black Caribbean 30.6 .26 558
Black African 30.9 .29 577
Any other group 33.6 .31 597
Gap (White British vs. lowest minority) 3.3
Gender Male 33.3 0.14 7378
female 34.1 0.12 7140
Gap 0.8
Social class of the home
Higher managerial and professional 38.1 0.18 1378 Lower managerial and professional 36.1 0.13 2851
Intermediate occupations 34.4 0.19 899
Small employers and own account workers 34.0 0.16 1585 Lower supervisory and technical 32.7 0.14 1421
Semi-routine occupations 31.5 0.16 1580
Routine occupations 30.5 0.19 1367
Never worked/long term unemployed 28.5 0.23 1019
Gap (highest vs. lowest) 9.6
Grand mean 33.5 6.7(a) 14503
Notes. Data are weighted by combined design and non-response weights. The overall sample and ethnic group mean scores matches the relevant national averages for 2004 indicating the sample is
Table 2: Regression models of age 14 average points score
VALUE-ADDED
I II III IV V VI
Variable Value Coeff. SE Coeff. SE Coeff. SE Coeff. SE Coeff. SE Coeff. SE
Intercept Intercept 33.9 .12 30.6 .28 24.1 .38 25.2 .40 26.9 .42 30.8 .26
Ethnic group Mixed heritage -.45 .24 .22 .21 -.27 .21 -.41 * .18 -.16 .17 .12 .10
(Base=White Indian .53 * .26 1.37 *** .22 .17 .21 -.92 *** .18 -.49 ** .16 .30 ** .11
British) Pakistani -3.09 *** .24 -.67 ** .22 -1.51 *** .23 -2.57 *** .19 -1.64 *** .19 -.13 .11
Bangladeshi -2.90 *** .29 1.22 *** .28 .17 .29 -.97 *** .21 .10 .21 .08 .13
Black Caribbean -3.30 *** .27 -2.45 *** .24 -3.17 *** .25 -3.35 *** .21 -2.53 *** .21 -.78 *** .12
Black African -2.99 *** .30 -1.05 *** .26 -2.40 *** .25 -3.77 *** .22 -2.78 *** .20 -.29 * .13
Any other ethnic group -.30 .31 1.49 *** .27 .57 * .25 -.36 .21 -.02 .19 .66 *** .13
Sex Female .72 *** .11 .14 .10 -.29 ** .09 -.11 .06 .03 .04
Higher managerial & professional 3.82 *** .28 2.99 *** .27 2.18 *** .22 1.62 *** .21 .39 ** .13
Lower managerial & professional 2.46 *** .26 1.75 *** .24 1.16 *** .20 .93 *** .19 .22 .13
Intermediate 2.01 *** .29 1.62 *** .27 1.14 *** .22 .98 *** .21 .25 .14
Small employers & own account 1.44 *** .26 1.05 *** .25 .82 *** .20 .55 ** .20 .29 * .13
Lower supervisory & technical .61 * .27 .47 .25 .23 .20 .25 .20 -.07 .13
Semi-routine .40 .26 .31 .24 .17 .20 .25 .20 -.02 .13
Routine -.40 .26 -.34 .25 -.17 .20 -.07 .20 -.16 .13
Degree or equivalent 5.87 *** .20 4.63 *** .18 3.57 *** .16 2.84 *** .15 .85 *** .09
HE but below degree 3.78 *** .19 2.92 *** .17 2.19 *** .15 1.68 *** .13 .50 *** .08
'A' Level or equivalent 3.21 *** .17 2.38 *** .16 1.77 *** .13 1.33 *** .13 .29 *** .07
GCSE grades A-C or equivalent 2.17 *** .14 1.70 *** .12 1.15 *** .11 .85 *** .11 .24 *** .06
Other qualifications .85 *** .17 .67 *** .16 .51 *** .13 .36 ** .13 .23 ** .08
Poverty Entitled FSM -1.93 *** .15 -1.58 *** .14 -1.02 *** .12 -.57 *** .12 -.22 ** .07
Home ownership Rented (vs. owner occupier) -1.97 *** .12 1.54 *** .12 1.11 *** .10 .78 *** .10 .13 * .06
Family composition Single parent family -.39 *** .11 -.17 .10 .09 .09 .08 .09 -.11 * .05
Home computer Yes 2.13 *** .14 1.23 *** .12 1.09 *** .12 .54 *** .08
Private tuition Yes .51 *** .13 .35 ** .12 .19 .10 .31 *** .06
1-2 activities vs. None .43 .22 .11 .21 .10 .21 .27 * .12
3+ activities vs. None 1.04 *** .26 .63 ** .23 .36 .23 .43 ** .13
Parental monitoring Always knows where YP is when out 1.11 *** .11 .18 .10 .17 .09 .39 *** .06
Wish YP to continue FTE post 16 4.05 *** .11 1.90 *** .09 1.79 *** .09 .69 *** .06
most days vs. < once a week -1.71 *** .13 -.76 *** .11 -.65 *** .10 -.29 *** .06
> once a week vs. < once a week -.71 *** .10 -.41 *** .08 -.38 *** .07 -.25 *** .04
Parents quarrel with YP
Base
+ School & neighbourhood
context
Social class of the home (base= long term unemployed)
Parent involvement in school Mother's highest education qualification (base= no qualifications) Parental aspiration CONTEXTUALISED MODELS + Family background + Parental attitudes & behaviours
+ Student risk & protective
Prior attainment and all other
Table 2: Regression models of age 14 average points score (continued)
VALUE-ADDED
I II III IV V VI
Variable Value Coeff. SE Coeff. SE Coeff. SE Coeff. SE Coeff. SE Coeff. SE
SEN SAP or statemented -5.53 *** .30 -5.20 *** .25 -1.14 *** .11
Truanted any time during last three years -.38 *** .11 -.33 ** .11 -.36 *** .06
Absence more than 1 month in last year -.81 *** .18 -.65 *** .18 -.42 *** .11
Service SS / EWS contact -.34 * .15 -.33 * .14 -.20 * .09
Police Contacted family because of YP -.49 *** .14 -.49 *** .14 -.51 *** .08
Excluded Anytime in last three years -.62 *** .14 -.58 *** .13 -.64 *** .08
YP aspirations Continue in FTE post 16 1.56 *** .10 1.51 *** .09 .54 *** .06
Very low -2.28 *** .15 -2.26 *** .15 -.73 *** .08
Low -1.82 *** .14 -1.81 *** .13 -.68 *** .07
Medium -.59 *** .08 -.63 *** .07 -.23 *** .04
1 day .48 * .22 .43 * .21 .30 * .14
2 days 1.07 *** .21 .89 *** .21 .46 *** .13
3 days 1.92 *** .22 1.55 *** .21 .77 *** .13
4 days 2.68 *** .24 1.94 *** .22 1.04 *** .14
5 days 2.96 *** .24 1.83 *** .22 1.06 *** .14
Very high 5.01 *** .16 5.36 *** .14 1.34 *** .09
High 3.15 *** .13 3.40 *** .12 .98 *** .08
Low 1.54 *** .12 1.70 *** .11 .54 *** .07
Very high -.88 *** .10 .13 * .07
High -.36 *** .11 .11 .06
Low -.44 *** .10 -.02 .06
Neighbourhood depr. IDACI normal score -.32 *** .05 -.17 *** .03
35%+ -3.01 *** .26 -1.40 *** .12
School % pupils 21%-35% -1.81 *** .16 -1.19 *** .11
entitled FSM 13%-21% -1.31 *** .16 -.99 *** .10
(base <5%) 9%-13% -1.22 *** .15 -.75 *** .11
5%- 9% -.50 *** .14 -.17 .10
Modern -1.09 *** .17 -.08 .13
grammar 4.74 *** .20 .37 * .15
Church .46 *** .13 .01 .09
Foundation -.13 .14 -.09 .09
Boys .18 .17 .21 .13
Girls .81 *** .19 .52 *** .13
Age 11 tests Average test score (normalised) 4.74 *** .03
Percentage of variance explained (R2)
Prior attainment and all other
variables CONTEXTUALISED MODELS
Base + Family
background
+ Parental attitudes & behaviours
+ Student risk & protective
+ School & neighbourhood
context
Planning for the future (base=high)
Homework (base=none)
Academic self concept (base=very low)
Attitude to school (base=very low) Selective status (base=comprehensive) School governance (base=community) School sex (base=mixed)
Table 3: Mean Age 11 score and progress age 11-14 by ethnic group
Age 11 % at expected level(a)
Mean age 11 test score (normalised)
Progress age 11 -14(b)
Ethnic group English maths science Mean SD Mean SE
White British 75.2 71.5 88.6 0.06 0.99 -
-Mixed heritage 74.8 68.2 87.1 0.03 1.02 -0.10 0.11
Indian 77.3 72.9 83.9 0.03 1.00 0.80** 0.12
Pakistani 63.1 55.7 71.6 -0.45** 0.96 0.09 0.13
Bangladeshi 65.7 59.6 76.4 -0.30** 1.03 -0.30 0.15
Black Caribbean 67.2 54.5 80.2 -0.33** 0.95 -0.77** 0.14 Black African 68.2 59.2 79.7 -0.25** 1.04 0.30 0.15
Any Other group 69.9 66.4 82.4 0.00 1.12 0.85 0.15
Total 75.0 70.0 88.0 0.04 1.00 -
Figure 1: Regression coefficients for minority ethnic groups relative to White British students in five regression models of educational attainment at age 14
APPENDIX 1: Definition of explanatory variables derived from LSYPE
Family background
Ethnic group:Information on students’ ethnic group was collected through self-identification from 16 ethnic categories (plus don’t know/refused). The rationale for the LSYPE sampling strategy was to focus on the attainment of the six main minority ethnic groups and White British students, hence ethnic group was collapsed into seven categories plus a generic ‘any other group’. The seven categories were White British, Mixed heritage, Indian, Pakistani, Bangladeshi, Black Caribbean and Black African which together these groups accounted for 96% of all students interviewed.
Socio-economic classification of the home (SEC):The SEC of the head of the household was coded by matching their occupation/size of organisation using the Office of National Statistics eight SEC analytic classes, ranging from higher managerial and professional occupations through to never worked or unemployed for the last six months or more. Mothers’ highest educational qualifications: The highest educational qualifications of the
student’s mother was measured on a six point scale ranging from degree or above through to no educational qualifications.
Entitlement to a Free School Meal (FSM):This is a widely used measure of family poverty since only students from families claiming state benefits are eligible for FSM.
Home ownership: A binary indicator of whether the family owned or rented their home. Home ownership provides a measure of socio-economic status in England where many families aspire to own their own home and there is relatively little Local Authority or social housing.
Family composition:students living in a household with a single adult were contrasted with those living in a household with more than one adult.
Parental attitudes and behaviours
Parents educational aspirations for the young person: The main parent was asked what they would like their child to do when s/he reached school leaving age 16. This variable identifies students whose parents wished them to remaining in full-time education (FTE) beyond the official school leaving age of 16 years.
Provision of educational resources: There were two measures (a) whether the family provided a home computer for the students use, and (b) whether the family paid for private lessons in subjects that are taught in school as part of the National Curriculum.
Parental involvement in school: The parent interview included questions on parents’
were ignored (e.g. 98.2% of parents talked to their children about their reports). Activities that required special knowledge or resources were also excluded (e.g. help out with teacher assessment, host an exchange student, donations or financial support to the school, employed at school, help with special interest groups like sport or drama). Following this process seven binary outcomes were created (attended a parents
evening in the last 12 months; talked to teacher about the child in the last 12 months; helped out in class; helped elsewhere in the school e.g. library; helped with fundraising activities, involved in Parent Teacher association and acted as school or parent
governor. A summary variable was created which recorded parent involved in one, two or three or more activities, contrasted again none.
Parental supervision: A binary indicator of whether the main parent reported they ‘always knew where the young person was when s/he was out’ or not.
Family discord: The frequency with which parent reported quarrelling with the student, with ‘most days’ and ‘more than once a week’ contrasted against ‘less than once a week’.
Student risk and protective factors
Special Educational Needs (SEN):This was a binary variable to identify students who were either at School Action Plus or had a statement for SEN, both of which require the involvement of an external agency not just school based identification, contrasted with those with no such identification.
Truancy: A binary indicator of whether the student has truanted at any time in last 12 months. Long term absence: a binary indicator of whether the student had been absent from the school
for one month or more in the past 12 months.
Service involvement:A binary indicator of whether the parents reported they had ever been contacted by Social Services or the Educational Welfare Service about the student’s behaviour. Also a separate measure of police involvementwhere the parents had been contacted by the police because of something the student has done.
Excluded: A binary indicator of whether the student has been either temporarily or permanently excluded in the last three years.
Student’s educational aspirations: A binary indicator of whether the student intends to remain in full-time education (FTE) after age 16 (the end of compulsory schooling) or not.
Homework:The number of evenings a week on which the young person reported they usually completed homework, ranging from none through to five.
Academic self concept:A scale measuring academic self concept was created from seven items each measured on a five point Likert scale. The seven items were: I get good marks for my work, how good do you think you are at school work, how good do your teachers think you are at school work, and how good do you think you are at English, mathematics, science and ICT respectively. The scores were summed to create a short scale which had good internal consistency (Cronbach’s alpha= .73). The scores were divided into four score bands.
Attitude to school: This was measured by nine questions relating to attitudes to school,
teachers and lessons each coded on a five point Likert scale. Items included questions such as “I am happy when I am at school”; “I work as hard as I can in school”, “the work I do in lessons is a waste of time”. For the purpose of the analysis the continuous scores were coded into quartile bands and contrasted against the least positive band.
School and neighbourhood context
A wide range of school level variables were tested but only the four variables listed below, plus neighbourhood deprivation, were significantly related to attainment.
Selective status:Comprehensive schools do not select by ability and take in the whole ability range. Grammar schools select by ability, taking the more able children from a
geographical area based on their scores on a reasoning test at age 11. Secondary modern schools cater for the students in selective areas who are not selected by the grammar schools.
School type: Church schools and Foundation schools were contrasted with community (non-denominational) schools.
School sex: Schools were coded as co-educational, singles sex boys or single sex girls. School deprivation: The percentage of students in the school entitled to FSM was used as an
indicator of the relative deprivation of the school. Schools were placed into six bands ranging from the least deprived (<5% entitled to FSM) to the most deprived (35% or more entitled to FSM). These bandings are those used by the DCSF in analysis of school performance.
APPENDIX 2: Contextual variables by ethnic group
Variable Value White
British Mixed her-itage Indian Paki-stani Bangl-adeshi Black Caribb ean Black Africa n Any other group
Gender Male 51.5% 48.7% 52.6% 50.8% 43.8% 49.6% 49.5% 51.1%
Female 48.5% 51.3% 47.4% 49.2% 56.2% 50.4% 50.5% 48.9%
Social class of the home
Missing 15.1% 16.3% 18.6% 20.7% 27.3% 17.2% 18.9% 21.4%
Higher managerial and professional
14.7% 13.5% 10.4% 7.0% .6% 6.6% 11.5% 17.5%
Lower managerial and professional
27.0% 29.1% 18.8% 12.4% 8.2% 30.1% 23.9% 18.9%
Intermediate 7.4% 7.7% 7.2% 3.5% .9% 15.5% 8.9% 4.2%
Small employers and own account
12.5% 10.0% 18.2% 26.2% 11.9% 6.9% 3.6% 17.7%
Lower supervisory and technical
12.2% 10.2% 10.5% 4.5% 14.5% 10.8% 5.1% 9.1%
Semi-routine 12.3% 13.5% 13.7% 9.4% 11.8% 14.3% 14.9% 9.6%
Routine occupations 10.6% 7.8% 14.4% 13.7% 12.1% 8.3% 6.1% 9.2%
Never worked/long term unemployed
3.4% 8.1% 6.8% 23.3% 40.0% 7.6% 25.9% 13.9%
Mothers highest educational qualification
Missing 4.8% 6.3% 4.2% 10.0% 10.5% 8.9% 9.4% 6.6%
Degree or equivalent 11.5% 15.2% 8.5% 7.8% 1.0% 9.5% 16.5% 11.7%
HE below degree level 13.3% 17.3% 6.3% 4.0% 1.5% 23.8% 16.8% 7.9%
‘A’ level or equivalent 14.4% 12.1% 9.1% 5.9% 2.1% 15.9% 9.9% 7.7%
GCSE grades A-C equiv 34.6% 23.8% 25.2% 9.7% 7.3% 29.1% 14.8% 14.3%
Other qualifications 10.6% 6.7% 8.1% 4.3% 2.6% 11.2% 2.9% 8.9%
No qualification 15.6% 25.0% 42.8% 68.2% 85.5% 10.6% 39.1% 49.5%
Entitled to a FSM
Missing .1% .1% .3% .6% .3% .2% 1.2% .3%
No 87.2% 74.9% 86.2% 61.9% 41.4% 73.8% 58.6% 70.4%
Yes 12.8% 25.1% 13.8% 38.1% 58.6% 26.2% 41.4% 29.6%
Owner occupier
Missing 1.4% 1.6% 1.1% 2.4% 1.6% 2.6% 2.7% 3.1%
Rented 25.5% 41.9% 13.7% 21.5% 54.2% 55.7% 68.2% 47.5%
Owned 74.5% 58.1% 86.3% 78.5% 45.8% 44.3% 31.8% 52.5%
Single parent household
Missing .6% .7% .8% 1.0% 1.3% 1.6% .5% 1.4%
No 77.2% 58.5% 87.8% 84.7% 85.2% 43.1% 55.7% 78.1%
Yes 22.8% 41.5% 12.2% 15.3% 14.8% 56.9% 44.3% 21.9%
Household has home computer
Missing .1% .0% .1% .0% .0% .0% .0% .0%
No 10.1% 15.2% 6.0% 18.2% 19.3% 19.0% 13.6% 13.0%
Yes 89.9% 84.8% 94.0% 81.8% 80.7% 81.0% 86.4% 87.0%
Private tuition Missing .0% .1% .0% .1% .1% .0% .5% .0%
No 88.9% 83.1% 75.2% 85.8% 88.1% 85.9% 78.4% 80.0%
Yes 11.1% 16.9% 24.8% 14.2% 11.9% 14.1% 21.6% 20.0%
Parental involvement
in school
1-2 activities 87.1% 87.0% 87.7% 86.7% 84.9% 89.1% 82.4% 84.6%
3+ activities 9.8% 10.6% 9.0% 8.3% 6.3% 9.1% 14.2% 11.4%
0 activities 3.2% 2.4% 3.3% 5.0% 8.8% 1.8% 3.4% 4.1%
Parental supervision
Missing .1% .1% .0% .1% .1% .0% .2% .0%
Does not always know where child is when out
18.4% 18.1% 8.3% 11.4% 14.0% 18.4% 9.7% 11.3%
Always knows where child is when out
81.6% 81.9% 91.7% 88.6% 86.0% 81.6% 90.3% 88.7%
Parent wishes YP continue FTE post 16
Missing .1% .0% .2% .0% .1% .0% .0% .2%
No 23.1% 12.2% 4.9% 5.5% 5.7% 8.0% 1.6% 8.3%
Yes 76.9% 87.8% 95.1% 94.5% 94.3% 92.0% 98.4% 91.7%
parent reported quarrelling with YP
Missing 2.5% 4.0% 16.8% 40.2% 54.1% 5.3% 16.9% 19.9%
Most days 13.6% 14.9% 9.7% 13.6% 7.0% 12.2% 12.0% 12.5%
More than once week 25.5% 20.6% 17.1% 13.8% 11.8% 23.9% 17.9% 16.7%
Less than once week 60.9% 64.5% 73.2% 72.6% 81.1% 63.8% 70.1% 70.7%
SEN Missing .1% .1% .3% .6% .3% .2% 1.2% .3%
SAP/Statemented 8.2% 8.5% 4.8% 7.6% 8.9% 13.6% 6.5% 5.7%
Not SAP/Stat 91.8% 91.5% 95.2% 92.4% 91.1% 86.4% 93.5% 94.3%
truant in last 12 months
Missing 5.5% 6.7% 7.2% 9.5% 14.1% 5.5% 11.2% 8.0%
Yes 15.9% 21.7% 8.2% 13.6% 15.7% 19.1% 13.1% 12.0%
No 84.1% 78.3% 91.8% 86.4% 84.3% 80.9% 86.9% 88.0%
Variable Value White British Mixed her-itage Indian Paki-stani Bangl-adeshi Black Caribb ean Black Africa n Any other group
month in last year
Yes 4.2% 6.7% 3.3% 6.4% 2.4% 2.8% 2.0% 3.0%
No 95.8% 93.3% 96.7% 93.6% 97.6% 97.2% 98.0% 97.0%
Social Services/EWS involvement
Missing 2.3% 4.2% 15.9% 39.3% 53.8% 4.6% 16.7% 19.0%
Yes 7.5% 9.4% 3.4% 5.4% 4.3% 8.8% 5.9% 5.4%
No 92.5% 90.6% 96.6% 94.6% 95.7% 91.2% 94.1% 94.6%
Police involvement
Missing 2.6% 4.4% 16.0% 39.5% 53.8% 5.1% 17.1% 19.9%
Yes 8.5% 10.9% 2.4% 2.2% 2.0% 4.8% 4.1% 3.8%
No 91.5% 89.1% 97.6% 97.8% 98.0% 95.2% 95.9% 96.2%
Excluded in last 3 years
Missing 2.2% 3.9% 15.8% 39.2% 53.8% 4.6% 16.4% 19.0%
Yes 10.5% 15.5% 4.0% 6.9% 5.1% 19.8% 10.9% 8.5%
No 89.5% 84.5% 96.0% 93.1% 94.9% 80.2% 89.1% 91.5%
YP educ. aspirations
Leave at 16/DK 23.2% 15.7% 5.4% 8.8% 7.8% 14.6% 3.6% 12.4%
Stay in FTE post 16 76.8% 84.3% 94.6% 91.2% 92.2% 85.4% 96.4% 87.6%
Planning for the future
Very Low 7.9% 7.1% 8.5% 15.0% 17.1% 7.1% 10.0% 7.3%
Low 9.4% 8.2% 10.2% 13.4% 15.3% 6.2% 5.3% 9.5%
Medium 34.2% 31.6% 31.9% 31.1% 29.8% 29.4% 29.9% 36.2%
High 48.5% 53.1% 49.4% 40.6% 37.8% 57.3% 54.8% 47.0%
Homework Missing 10.2% 11.4% 4.0% 3.5% 5.8% 6.6% 3.7% 4.8%
None 3.6% 4.2% 1.8% 2.2% 2.1% 4.3% 1.9% 2.1%
1 evening 14.1% 13.3% 7.8% 10.4% 11.4% 11.9% 6.0% 7.6%
2 evenings 21.3% 17.6% 12.8% 17.9% 19.7% 17.3% 17.0% 18.0%
3 evenings 26.8% 27.6% 26.9% 28.0% 28.3% 36.8% 30.1% 26.3%
4 evenings 14.8% 14.8% 18.6% 15.7% 14.8% 10.6% 15.6% 19.3%
5 evenings 19.3% 22.6% 32.2% 25.8% 23.8% 19.1% 29.4% 26.7%
Academic self concept
Missing 7.2% 8.9% 5.3% 6.7% 9.1% 8.0% 7.5% 8.8%
Very high 18.3% 22.9% 30.9% 28.9% 28.0% 24.6% 33.3% 25.3%
High 33.8% 34.6% 38.1% 41.6% 38.0% 31.5% 36.5% 40.6%
Low 33.9% 31.4% 24.1% 24.1% 28.2% 35.1% 24.0% 25.2%
Very low 14.0% 11.2% 7.0% 5.4% 5.9% 8.8% 6.2% 8.8%
Attitude to school
Missing 7.5% 8.9% 5.6% 7.7% 8.2% 8.9% 7.5% 10.2%
Very high 26.7% 26.7% 42.5% 44.1% 38.2% 30.2% 46.4% 34.3%
High 20.7% 19.0% 24.9% 21.7% 21.8% 21.0% 16.8% 18.7%
Low 26.1% 30.2% 23.4% 23.9% 27.3% 25.6% 22.6% 29.3%
Very low 26.5% 24.1% 9.2% 10.3% 12.7% 23.3% 14.2% 17.6%
School % pupils FSM band
Missing 1.3% 1.5% .5% .7% 1.6% .9% 1.6% 1.4%
35%+ 7.9% 19.5% 22.8% 51.7% 72.6% 33.2% 45.9% 28.9%
21%-35% 13.0% 18.5% 18.3% 22.1% 9.9% 27.7% 21.9% 16.1%
13%-21% 15.2% 17.5% 25.5% 9.3% 6.6% 16.6% 11.7% 13.9%
9%-13% 15.6% 13.7% 13.5% 6.3% 4.2% 9.3% 6.9% 13.9%
5%-9% 24.3% 15.5% 7.9% 5.3% 2.5% 7.1% 6.6% 11.2%
<5% 22.7% 13.8% 11.5% 4.5% 2.5% 5.1% 5.3% 14.6%
School admissions
Secondary modern 4.9% 3.1% 2.2% 3.2% 1.2% 1.3% 2.8% 4.6%
Grammar 3.7% 4.2% 6.1% 1.8% .4% 2.4% 2.5% 3.4%
Comprehensive 91.3% 92.7% 91.7% 95.0% 98.4% 96.4% 94.7% 92.0%
school type Church 14.1% 17.3% 6.8% 2.9% 9.7% 24.3% 27.0% 17.1%
Foundation 17.0% 16.4% 17.1% 10.3% 6.1% 13.1% 8.5% 16.1%
Community 68.9% 66.3% 76.1% 86.7% 84.1% 62.6% 64.4% 66.7%
School sex Boys school 3.6% 5.5% 5.8% 4.0% 8.7% 6.9% 7.8% 7.6%
Girls school 3.6% 12.0% 10.3% 16.1% 22.2% 18.4% 16.9% 15.1%
mixed 92.8% 82.5% 83.9% 79.9% 69.1% 74.6% 75.3% 77.2%
IDACI band
most deprived 25% 25.1% 45.6% 34.3% 66.3% 85.9% 70.1% 70.6% 44.7%
middle 50% 48.1% 39.4% 52.4% 28.8% 13.3% 26.8% 25.6% 38.0%
least deprived 25% 26.7% 14.9% 13.2% 4.9% .7% 3.1% 3.7% 17.1%
Note: