http://wrap.warwick.ac.uk/
Original citation:
Smith, J. A., Hammond, Simon D. and Jarvis, Stephen A. (2011) The effect of an
application performance modelling tool. In: UK Performance Engineering Workshop
(UKPEW'11), Bradford, United Kingdom, 7-8 July, 2011
Permanent WRAP url:
http://wrap.warwick.ac.uk/45692
Copyright and reuse:
The Warwick Research Archive Portal (WRAP) makes this work by researchers of the
University of Warwick available open access under the following conditions. Copyright ©
and all moral rights to the version of the paper presented here belong to the individual
author(s) and/or other copyright owners. To the extent reasonable and practicable the
material made available in WRAP has been checked for eligibility before being made
available.
Copies of full items can be used for personal research or study, educational, or
not-for-profit purposes without prior permission or charge. Provided that the authors, title and
full bibliographic details are credited, a hyperlink and/or URL is given for the original
metadata page and the content is not changed in any way.
A note on versions:
The version presented in WRAP is the published version or, version of record, and may
be cited as it appears here.
The Effect of an Application Performance
Modelling Tool
J.A. Smith, S.D. Hammond and S.A. Jarvis
Performance Computing and Visualisation Department of Computer Science
University of Warwick, UK [email protected]
Abstract. One of the most important metrics of machine efficiency in HPC is job turnaround time, which is the time taken for a user to sub-mit a job and recieve their results. This time consists of two primary components; run-time, which depends on the resources allocated to the job, and queue wait time, which is dependent on the resources requested and the present level of machine usage.
This paper investigates the effect of applying application performance modelling techniques to producing run-time estimates for jobs to be scheduled on parallel High Performance Computing systems. Our aim through the development of such tools is to improve turnaround time for jobs across the system. This investigation is performed from the per-spective of a community of HPC users who would make use of a tool to assist in job submission.
We implement and validate a higher performance implementation of the scheduling algorithm used by the Maui scheduler and demonstrate that it matches the behaviour of an existing Maui configuration. We formu-late a method for generating potential performance model results and use it to to modify three workloads from production supercomputers to include generated performance model wall-time estimates. We then ap-ply the scheduling simulator to the workloads in order to simulate the effect of using of such a tool for the three real workloads.
Examining the results from the simulation, we show a randomly selected sample set of tool users obtaining and improvement of upto 23% in aver-age queuing time, and conclude that a tool that uses performance models to generate improved wall-time estimates would be beneficial to users of HPC systems.
1
Introduction
Traditionally, High Performance Computing (HPC) has been the preserve of spe-cialists running proprietary, purpose-designed systems. However, the low initial cost and attractive price/performance ratio of clusters built from commodity off-the-shelf (COTS) components has led to wide adoption of HPC in industry and academia, driven by the economic and capability benefits of conducting re-search and experimentation computationally. The result is that HPC is now to be found outside of the supercomputing centre, in server rooms and offices, and even on-demand from cloud services such as Amazon’s EC2. The consequence of such widespread availability, is that a modern HPC system can be expected to be used by a broad spectrum of users, of greatly varying computing experience and expertise.
Specify job Setup application
Submit job
Wait for job start
Wait for job end
Queued
Running
Application
Problem
Ready
Finished
Use tool Setup application
Queued
Running
Application
Problem
Finished
Wait for job start
[image:3.595.232.382.294.520.2]Wait for job end
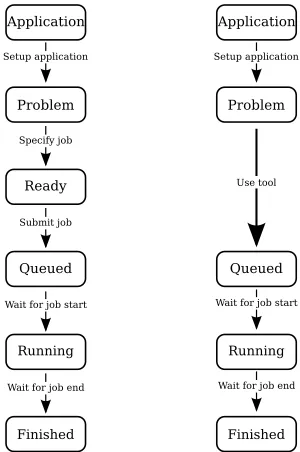
Fig. 1.Present workflow (left) against Tool workflow (right)
Unfortunately, this increased participation has not been met by improvements in cluster management software. At present, many HPC stacks do not match the needs of this broader HPC userbase. The present job workflow shown in Figure 1 has remained almost unchanged. Users are expected to prepare their application’s configuration and input data, specify the application’s requirements and use the job submission system to observe the job’s progress.
multiple queuing systems. This error-prone process is an artifact of the design of the queuing system, and serves as a hurdle to users attempting to get useful work done on HPC machines.
Significantly, although users are often very confident about their predictions for the resources their jobs require, they are not equipped to be able to accurately specify job requirements [7]. This combination inevitably means that job requests are poorly specified, leading to poor and unfair scheduling performance, and the user experience being lengthy job turnaround times.
The need for accurate resource requirements is a problem that can be ad-dressed by applyingapplication performance modelling tools and techniques [5, 6, 9]. These techniques permit the modelling of application behaviour in a math-ematical or simulation setting, providing a framework for predicting job require-ments.
Our first-hand experience of these problems on Francesca, a commodity 11.5 TFLOP/s 960-core Intel/Infiniband cluster at the University of Warwick, moti-vates our work in developing a job management tool to provide the benefits of application performance modelling to users in modern HPC environments. The proposed tool workflow is shown in Figure 1. This workflow follows the same pattern, but automates the difficult step of reserving sufficient resources and the error-prone step of defining a batch job.
This work concerns simulating the effects of the use of such a tool on HPC systems, where it can be expected that some users are using the tool to improve their estimates, whilst others are not.
This simulation is performed on three representative workloads: Blue Hori-zon, a smaller machine at San Diego Supercomputing Center installed in 2000; Intrepid, a production-class BlueGene/P at Argonne National Laboratory and Francesca, an research cluster for the University of Warwick. We develop a method for producing estimates of performance model predictions for an ex-isting workload. and use this technique with our representative workloads to simulate the effects of user uptake and model accuracy.
The contributions of this work are:
– The presentation of a stand-alone specialised implementation of the
schedul-ing algorithm used by Maui – an open source scheduler related to MOAB – demonstrating the similarily of its behaviour under a real workload. This scheduler is faster and more reliable than using Maui in simulation mode and the implementation provides a validated scheduler for inclusion in workload-aware predictive submission tools.
– We formulate a method for generating potential performance model
– We apply our method for generating runtime estimates to three workloads
from production machines to simulate the use of application performance models by the tool to accurately predict runtime length. The results of this simulation demonstrate that the use of application performance models at submit time has the potential to reduce average and maximum queue times.
The remainder of this paper is organised as follows: Section 2 contains details of our workloads; we cover our method for generating potential performance model predictions in Section 3; Section 4 describes our experimental setup; we present our results in Section 5; Section 6 covers our conclusions; and we present our planned further work in Section 7.
2
Experimental Workloads
We utilise workload data from three sources: (1) Francesca, a 960-core Xeon/Inf-iniband cluster at the University of Warwick; (2) Intrepid, a 163,840 core Blue-Gene/P located at the Argonne National Laboratory; and (3) Blue Horizon, a 1,152 core RS/6000 SP from the San Diego Supercomputer Center.
The Blue Horizon workload is from the Parallel Workloads Archive [1], and covers 223,810 jobs submitted between April 2000 and January 2003. This job mix contains submissions from the initial installation and covers almost 2 years of production use.
The Intrepid workload is also from the Parallel Workloads Archive. This covers jobs submitted from January 2009 to September 2009 and contains 68,936 production jobs. This workload represents a modern, proprietary supercomputer of significant size.
Our Francesca workload is the result of sampling Francesca’s Torque/Maui queue at 5 minute intervals between 14th June and 27th December 2010 and post-processing this data into a trace of 32,016 jobs. This trace ignores jobs that end in periods for which we do not have sample data (ie., those jobs for which we can not establish a runtime) and jobs that did not run, or were sufficiently short to not to be sampled whilst running.
The log from Francesca is unusual in that it records a workload from a diverse, multi-discipline research community and includes users from
complex-Workload Total Power-of-two Serial
Blue Horizon (SDSC) 223,810 92.13% 0.0004% Intrepid (ANL) Requested 68,936 99.89% 0.001% Francesca (Warwick) 32,016 95.88% 72.30%
physics domains, mathematics and chemistry through to code developers and users from social sciences.
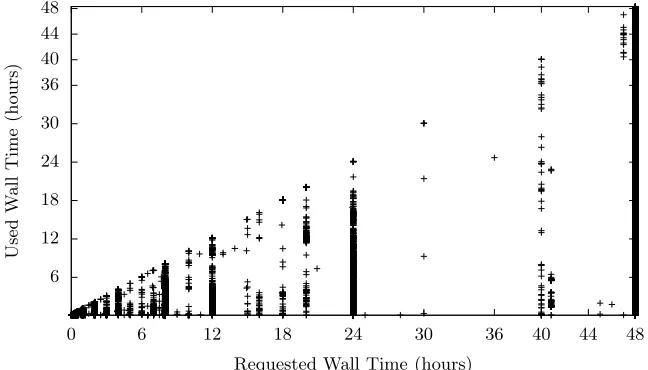
We compare our workload from Francesca with expected properties based on existing literature. Most relevantly, comparing the required walltime with the user-specified walltime estimates, we find little coherence between the two, only 30% of jobs use more than 75% of their walltime estimates. User walltime estimates are comparable, although, slightly better than that reported by Lee, Schwartzman, Hardy and Snavely [7], with 45%, rather than a majority of jobs using less than 20% of their requested time.
Requested Wall Time (hours)
U
se
d
W
a
ll
T
im
e
(h
o
u
rs
)
48 44 40 36 30
24 18
12 6
0 48 44 40 36
30
24
18
12
[image:6.595.145.469.257.442.2]6
Fig. 2.Requested wall time against used wall time (Francesca)
We also find that 53% of the jobs within our Francesca trace are submitted requesting the maximum available wall-time. As expected from Lee, Schwartz-man, Hardy and Snavely, in Figure 2 we observe user estimates that are highly modal, with prominent peaks on ‘round’ times, notably including a working day (8 hours), half a day, a day, and two days.
Job sizing compares favourably to that reported by Cirne and Berman [3]. Whilst the proportion of power-of-two jobs (jobs that request a power-of-two number of processor cores) is greater in Francesca’s workload; 85% of non-serial jobs are power-of-two compared to between 69.87% to 83.95%, it does follow the expected behaviour that the workload is dominated by power-of-two jobs, and the overall figure of 95.88% of all jobs are serial is in line with the same metric from Blue Horizon and Intrepid.
significantly different to both Blue Horizon and Intrepid. We assume this effect is due to Francesca being the most significant computing resource at Warwick during the period we gathered our workload data. We also note that the mini-mum partition size for production jobs on Intrepid is 2048 cores, which is likely to discourage serial tasks.
Workload Square Even Multiple-of-4 Multiple-of-10
Blue Horizon (SDSC) 1.45% 99.99% 99.99% 31.59% Intrepid (ANL) 1.26% 98.73% 98.73% 93.67% Francesca (Warwick) 5.30% 68.27% 40.32% 30.20%
Table 2.Breakdown of processor usage for non-power-of-2 processor-core requests
3
Prediction Estimate Model
Previous models of supercomputer workloads have used two principle techniques: the first [3, 4] generates workloads from observed queue behaviour such as ar-rival rates, runtime distributions and job sizing. The second auguments queue observations with additional knowledge of user behaviour [11] to produce more realistic and, therefore accurate, user estimates.
Our model, applies to performance prediction estimates of application run-time rather than user estimates of application runrun-time. Performance prediction estimates differ in that they do not cluster at ‘round’ numbers, and in that we expect their inaccuracy to be both low and bounded.
We assume that: (1) performance models are workload-oblivious; their pa-rameterisation is independent of the current machine utilisation and historical workload of the user; (2) the predictions of the tool are such that all jobs com-plete; (3) the error of the performance model is limited; and, finally (4) the jobs can be split into non-overlapping classes.
We model performance models being workload-oblivious by producing modal results. This captures indentically parameterized runs producing differing run-times. Tsafrir and Feitelson [10] claim that modality helps to reduce the effects of a ‘heel-toe’ dynamic , where overestimated runtimes tend to push the system towards a ‘smallest job first’ execution strategy, as smaller jobs backfill in before a later job; delaying the start time of the longer job.
For compatibility with existing performance models, which specify a maxi-mum error under a given set of conditions, we limit error by allowing up to a specified maximum error in estimates we provide.
Workload 10% 20% 30% 40% 50% 60% 70% 80% 90% 100%
Blue Horizon (SDSC) 4.22 8.82 12.94 17.40 21.68 26.18 29.90 34.06 37.61 41.07 Intrepid (ANL) 4.40 8.56 13.70 20.64 24.14 25.07 25.07 34.66 35.11 39.71 Francesca (Warwick) 3.71 7.35 10.37 13.85 17.49 19.12 23.75 24.78 27.58 30.76
Table 3.Average estimate error (%) with increasing maximum error
The average error in runtime for maximum error criterons between 0% and 100% are shown in Table 3. We note that the average error is a little under half of the available error range which reflects the expected naturally occurring clustering of runtimes in the workloads.
To ensure that all jobs run to completion, the estimate used for each class is conservative; it is the maximum runtime within this class, and hence will always be greater than or equal to the runtime of any job within its class.
4
Experimental Setup
The Maui scheduler allows administrators of High Performance Computing sys-tems to define policies that control the allocation of resources to jobs. These policies are defined as a set of rules – the Maui configuration.
Conceptually, Maui divides time into an infinite series of sequential fixed length scheduling iterations. From a simulation perspective, the basic Maui it-eration contains 9 stages:
1. Start new iteration
2. Read in new jobs for iteration 3. Determine set of ready jobs 4. Update job progress
5. Handle the termination of all completed jobs 6. Calculate priority for all jobs
7. Create job schedule, considering jobs in priority order. 8. Determine executable jobs from schedule
9. Begin job execution
Scheduler policies are applied in two stages. Firstly, when determining the set of ready jobs, jobs can be prevented from being considered for execution, when they breach a set of administrator defined rules. Secondly, scheduler policies are applied to the calculation of job priorities. The job priorities are calculated individually for each job by summing the weighted contributions for each sub-component – the weightings used are defined by the scheduler policies:
P riority=XComponentweight X
Scheduler priorities are therefore adjusted by the job configuration and workload metrics available within Maui. Priority adjustments can be a simple as adjusting the priority of jobs for an individual user, to limiting the number of jobs that can be backfilled in before a job, to integrating historical data for priority based ‘fairshare’ policies.
Maui’s ‘fairshare’ system stores n windows of length l for each metric of interest – the total period over which Maui accounts for historical usage is, simplyP eriod=nl. Maui calculates the historical activity as:
U sage= n X
i=1
window(i)·decay
i
Maui uses the difference between the proportion of used machine time used against a target proportion as a usage subcomponent value.
Our scheduling policies are a duplicate of the Maui configuration on Francesca. This configuration defines backfilling parameterised by favouring: (1) jobs that that have spent longer queuing; (2) larger numbers of processors (‘preference for scale’) (3) jobs that have been bypassed by jobs being backfilled and, finally (4) users who have used a small proportion of machine time during the previous 30 days (‘fairshare’). It also defines a scheduling iteration size of 30 seconds.
User specified wall-times are considered hard; jobs which do not complete within their estimate are terminated, and do not successfully complete. As ob-served in [8], this encourages users to over-request resources at the cost of a longer wait, rather than risk non-completion.
This scheduling configuration is applied to all three workloads, adjusting the number of available processing cores to match the number available in the source machine, in order to ensure that all jobs in the workload are runnable.
We use our scheduler to simulate the effect of a user population using a tool to apply performance models to their job requests. We consider the effect of increasing uptake amongst a user community, simulating 0% to 100% of users submitting jobs using tool assistance.
5
Results
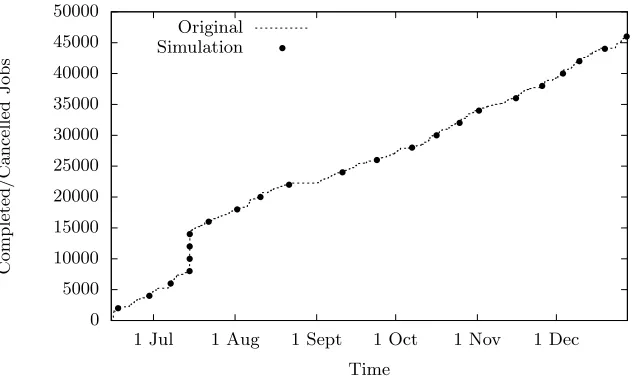
Comparing the output of our scheduler with the original schedule (see Figure 3) indicates that it provides a very acceptable simulacrum of the behaviour of Francesca’s own Maui scheduler, especially considering that the workload does not contain all the jobs that were submitted to Francesca and that it needs to extract fair share data from the tracefile during the first month.
Simulation Original
Time
C
o
m
p
le
te
d
/
C
a
n
ce
ll
ed
J
o
b
s
1 Dec 1 Nov
1 Oct 1 Sept
1 Aug 1 Jul
50000
45000
40000
35000
30000
25000
20000
15000
10000
5000
[image:10.595.149.466.230.422.2]0
Fig. 3.Comparison of scheduler job completion (with cancellation)
We used a specially prepared 46,287 job trace from Francesca containing both completed and cancelled jobs to perform our comparision; otherwise a sig-nificant deviation occurred during the second month, which corrected itself as the queue emptied and machine utilization dropped towards the end of August. This coincides with a large number of job cancellations which are visible as a vertical line. We note that the reason for the large numbers of submitted and cancelled jobs is due to users getting their jobs ready for August when much of user base is on vacation.
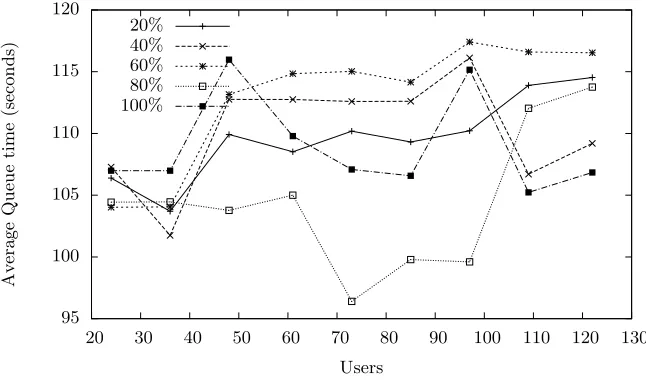
For each workload, we selected 20% of our user base at random (24 users for Francesca, 47 users for Intrepid and 93 users for Blue Horizon) as our initial ‘seed’ group of tool users; we then considered the effects of prediction accuracy and the proportion of the user base using the tool on the experience of our initial group.
100% 80% 60% 40% 20% Users A v er a g e Q u eu e ti m e (s ec o n d s) 130 120 110 100 90 80 70 60 50 40 30 20 120 115 110 105 100 95
Fig. 4.Francesca (Warwick): Average queue time for 20% userbase sample (Without tool assistance – 125 seconds)
is lower than the 125 seconds average queue time without tool assistance. The improvement is between 6% and 23%, depending on the proportion of the user-base that are tool users and the accuracy of the performance models used.
The 47 sample users in the Intrepid workload (Figure 5) also found our tool to be beneficial to their average queuing time. Again, this holds across our simulated ranges of tool uptake and prediction model accuracies. Tool users improve on their average, non-tool use average queue time of 12,476 seconds by between 6% and 15%.
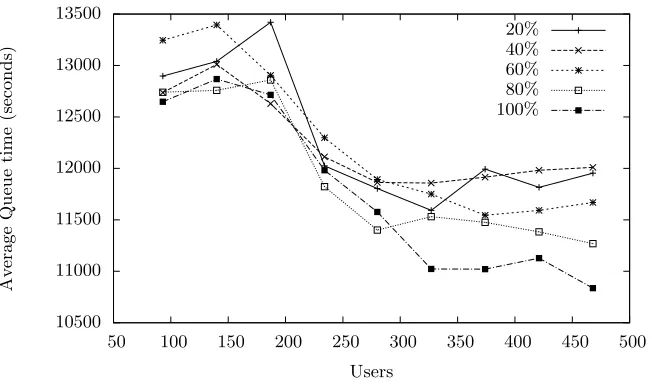
The Blue Horizon workload (Figure 6), also shows tool use to be beneficial to average queuing times. The 93 sample users, see a 1% to 20% improvement through tool use on a 13,614 seconds average queue time.
We note that, for both the Intrepid and Blue Horizon workloads, the queuing time of jobs decreases with increasing user base; a result that agrees with the findings of Chiang, Arpaci-Dusseau and Vernon [2] who found that improving the accuracy of estimates benefits all users, regardless of whether those users were personally using more accurate estimates.
100% 80% 60% 40% 20% Users A v er a g e Q u eu e ti m e (s ec o n d s) 240 220 200 180 160 140 120 100 80 60 40 12400 12200 12000 11800 11600 11400 11200 11000 10800 10600 10400
Fig. 5.Intrepid (ANL): Average queue time for 20% userbase sample (Without tool assitance – 12,476 seconds)
100% 80% 60% 40% 20% Users A v er a g e Q u eu e ti m e (s ec o n d s) 500 450 400 350 300 250 200 150 100 50 13500 13000 12500 12000 11500 11000 10500
[image:12.595.145.471.412.606.2]performance models because they produce accurate estimates that do not clus-ter about ‘round’ times, and we hypothesise that tool use causing an increase in the maximum queuing time for the Intrepid and Blue Horizon workloads is related to this ‘heel-toe’ effect.
6
Conclusions
We have presented a stand-alone implementation of the scheduling algorithm used by Maui, which in our experience is faster and more reliable than using the Maui scheduler in simulation mode. This scheduler implementation has been compared against the original behaviour of Francesca’s scheduler.
– We have shown our specialised implementation of the scheduling algorithm
used by Maui to validate against the behaviour we observe from Francesca’s queue data. This implementation provides a validated scheduler suitable for inclusion in workload-aware predictive submission tools.
– We have applied our method for generating potential performance model
predictions to three workloads from production high performance comput-ing systems, and shown that the average error reflects the expected clustercomput-ing of runtimes in the workloads.
– We have demonstrated using our scheduler implementation in conjunction
with our modified workloads to investigate the effect of an assistive tool that applies application performance modelling to producing wall-time estimates for the purpose of reducing the queuetime component of turnaround time.
Our simulations of modified workloads have been analysed from the perspective of the tool’s user community, concentrating on a group of 24 randomly selected initial ‘seed’ users.
Our observations of our group of tool users, suggest that HPC users would benefit from our proposed tool; our sample userbase saw up to a 23% improve-ment in average queuing time. Hence, the developimprove-ment of a tool that uses per-formance models to generate improved estimates for requested wall times would be beneficial to users of HPC systems.
7
Further Work
We plan to examine the effect of underpredicting job runtime. This extension to the work would include investigating submission strategies in the context of potential job failure and resubmission strategies for jobs that exceed their reserved time.
Lastly, we plan to investigate the effects of continuous model refinement, where we improve the parameterisation of the model over repeated application executions, and strategies for mitigating the high one-off cost of running an application where we are do not have characterisation data for that application’s execution.
References
1. Parallel Workloads Archive. http://www.cs.huji.ac.il/labs/parallel/ workload/logs.html.
2. S. Chiang, A. Arpaci-dusseau, and M.K. Vernon. The Impact of More Accurate Requested Runtimes on Production Job Scheduling Performance. InJob Scheduling Strategies for Parallel Processing, pages 103–127. Springer Verlag, 2002.
3. W. Cirne and F. Berman. A comprehensive model of the supercomputer workload.
InWorkload Characterization, 2001. WWC-4. 2001 IEEE International Workshop
on, pages 140 – 148, dec. 2001.
4. Dror G. Feitelson and Larry Rudolph. Metrics and benchmarking for parallel job scheduling. In In Job Scheduling Strategies for Parallel Processing, pages 1–24. Springer-Verlag, 1998.
5. S.D. Hammond, G.R. Mudalige, J.A. Smith, S.A. Jarvis, J.A. Herdman, and A. Vadgama. WARPP: A Toolkit for Simulating High Performance Parallel Scien-tific Codes. In 2nd International Conference on Simulation Tools and Techniques
(SIMUTools09), March 2009.
6. S.A. Jarvis, D.P. Spooner, H.N. Lim Choi Keung, J. Cao, S. Saini, and G.R. Nudd. Performance Prediction and its use in Parallel and Distributed Computing Systems. In Proceedings of the IEEE/ACM International Workshop on Perfor-mance Modelling, Evaluation and Optimization of Parallel and Distributed Systems
(PMEO’2003), April 2003.
7. C. Lee, Y. Schartzman, J. Hardy, and A. Snavely. Are User Runtime Estimates Inherently Inaccurate? In10th Workshop on Job Scheduling Strategies for Parallel Processing, 2004.
8. A.W. Mu’alem and D.G. Feitelson. Utilization, Predictability, Workloads, and User Runtime Estimates in Scheduling the IBM SP2 with Backfilling.IEEE Trans. Parallel Distrib. Syst., 12:529–543, June 2001.
9. G.R. Mudalige, M.K. Vernon, and S.A. Jarvis. A Plug-and-Play Model for Evalu-ating Wavefront Computations on Parallel Architectures. In22nd IEEE
Interna-tional Parallel and Distributed Processing Symposium (IPDPS08), April 2008.
10. D. Tsafrir and D.G. Feitelson. The Dynamics of Backfilling: Solving the Mys-tery of Why Increased Inaccuracy May Help. IEEE Workload Characterization Symposium, 0:131–141, 2006.
11. Dan Tsafrir, Yoav Etsion, and Dror G. Feitelson. Modeling User Runtime Es-timates. In 11th Workshop on Job Scheduling Strategies for Parallel Processing